

Key Market Outlook(s) and Pick(s)
On Thursday, I joined Taylor Riggs on Fox Business’ Mornings with Fox Business alongside Mark Tepper to discuss markets, the economy, outlook, bonds, inflation, AI, energy, GLP-1s, staples, the consumer, VF Corp (VFC), Disney (DIS), McCormick (MKC), and a lot more. Thanks to Taylor and Alexa Spilotras for having me on.
Canada Goose (GOOS) Update
For newer readers, here’s a quick overview of the key drivers behind our thesis on Canada Goose, an iconic luxury outerwear brand in the early innings of a DTC-led inflection as it evolves into a year-round lifestyle brand:
Company Overview
Founded in 1957 as a family-run business specializing in high-performance, Canadian-made down jackets and parkas. Evolved into an iconic premium luxury brand.
Chairman and CEO Dani Reiss (grandson of the founder). Took over in 2001 at age 27 when annual sales were ~$2.2M; FY2026 sales ~$1.53B (>600x growth in 25 years). Holds ~21% of shares outstanding. Repurchased another $1.06M worth of shares on 9/9/2026.
92 permanent retail stores globally as of Q1 FY27 (opened four net new in Q1, including the new Vancouver flagship; nine net new in FY2026, including conversions).
Geographic revenue mix: Greater China ~31.6%, United States ~25.1%, Canada ~17.9%, EMEA ~17.1%, APAC ex-China ~8.3%.
What Happened
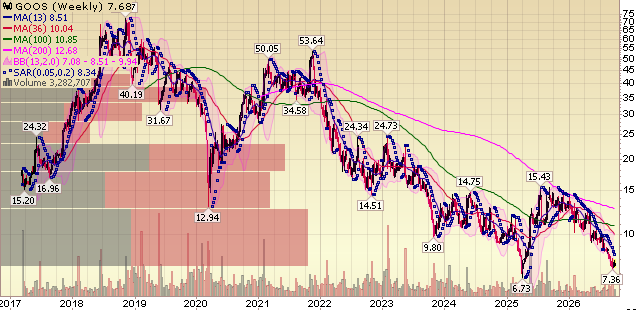
Went from flashy, high-growth story (trading >70x earnings at peak) to a value play (down nearly 90% from 2018 highs).
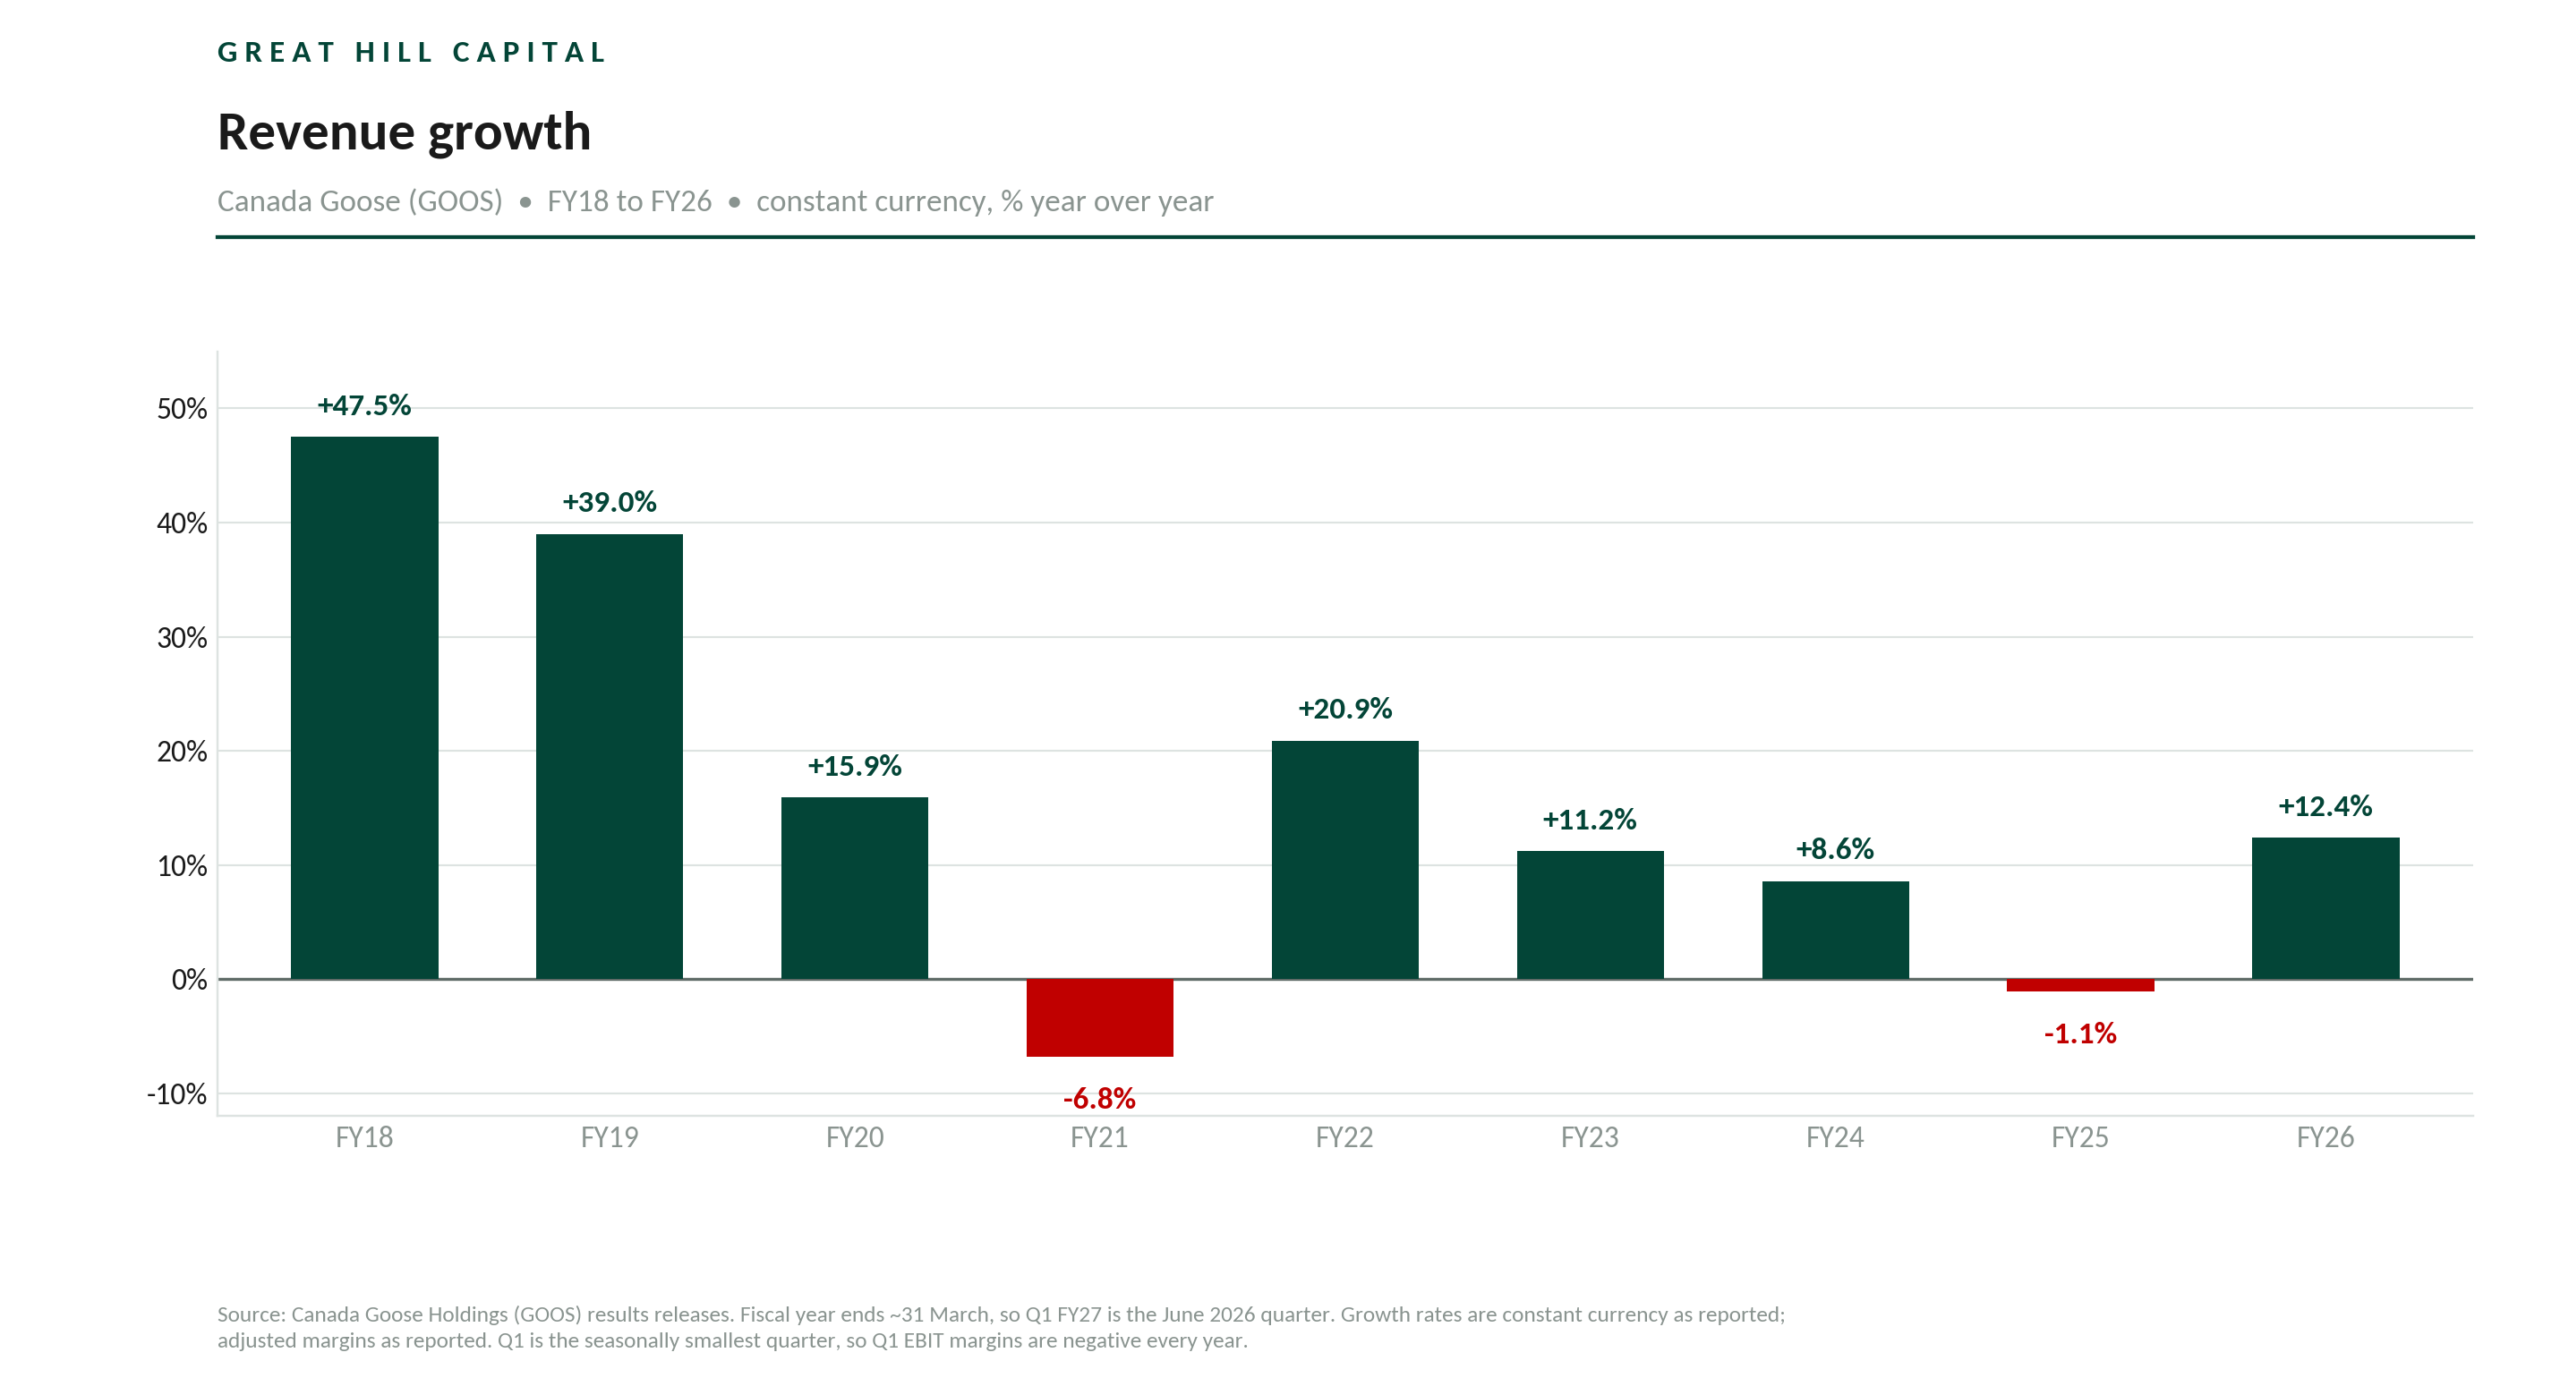
Sold off amid luxury sector weakness, slowing China consumer, discretionary pullback, and brand-specific challenges. Growth decelerated sharply from 40%+ annual rates to a trough of +1.1% in FY2025.
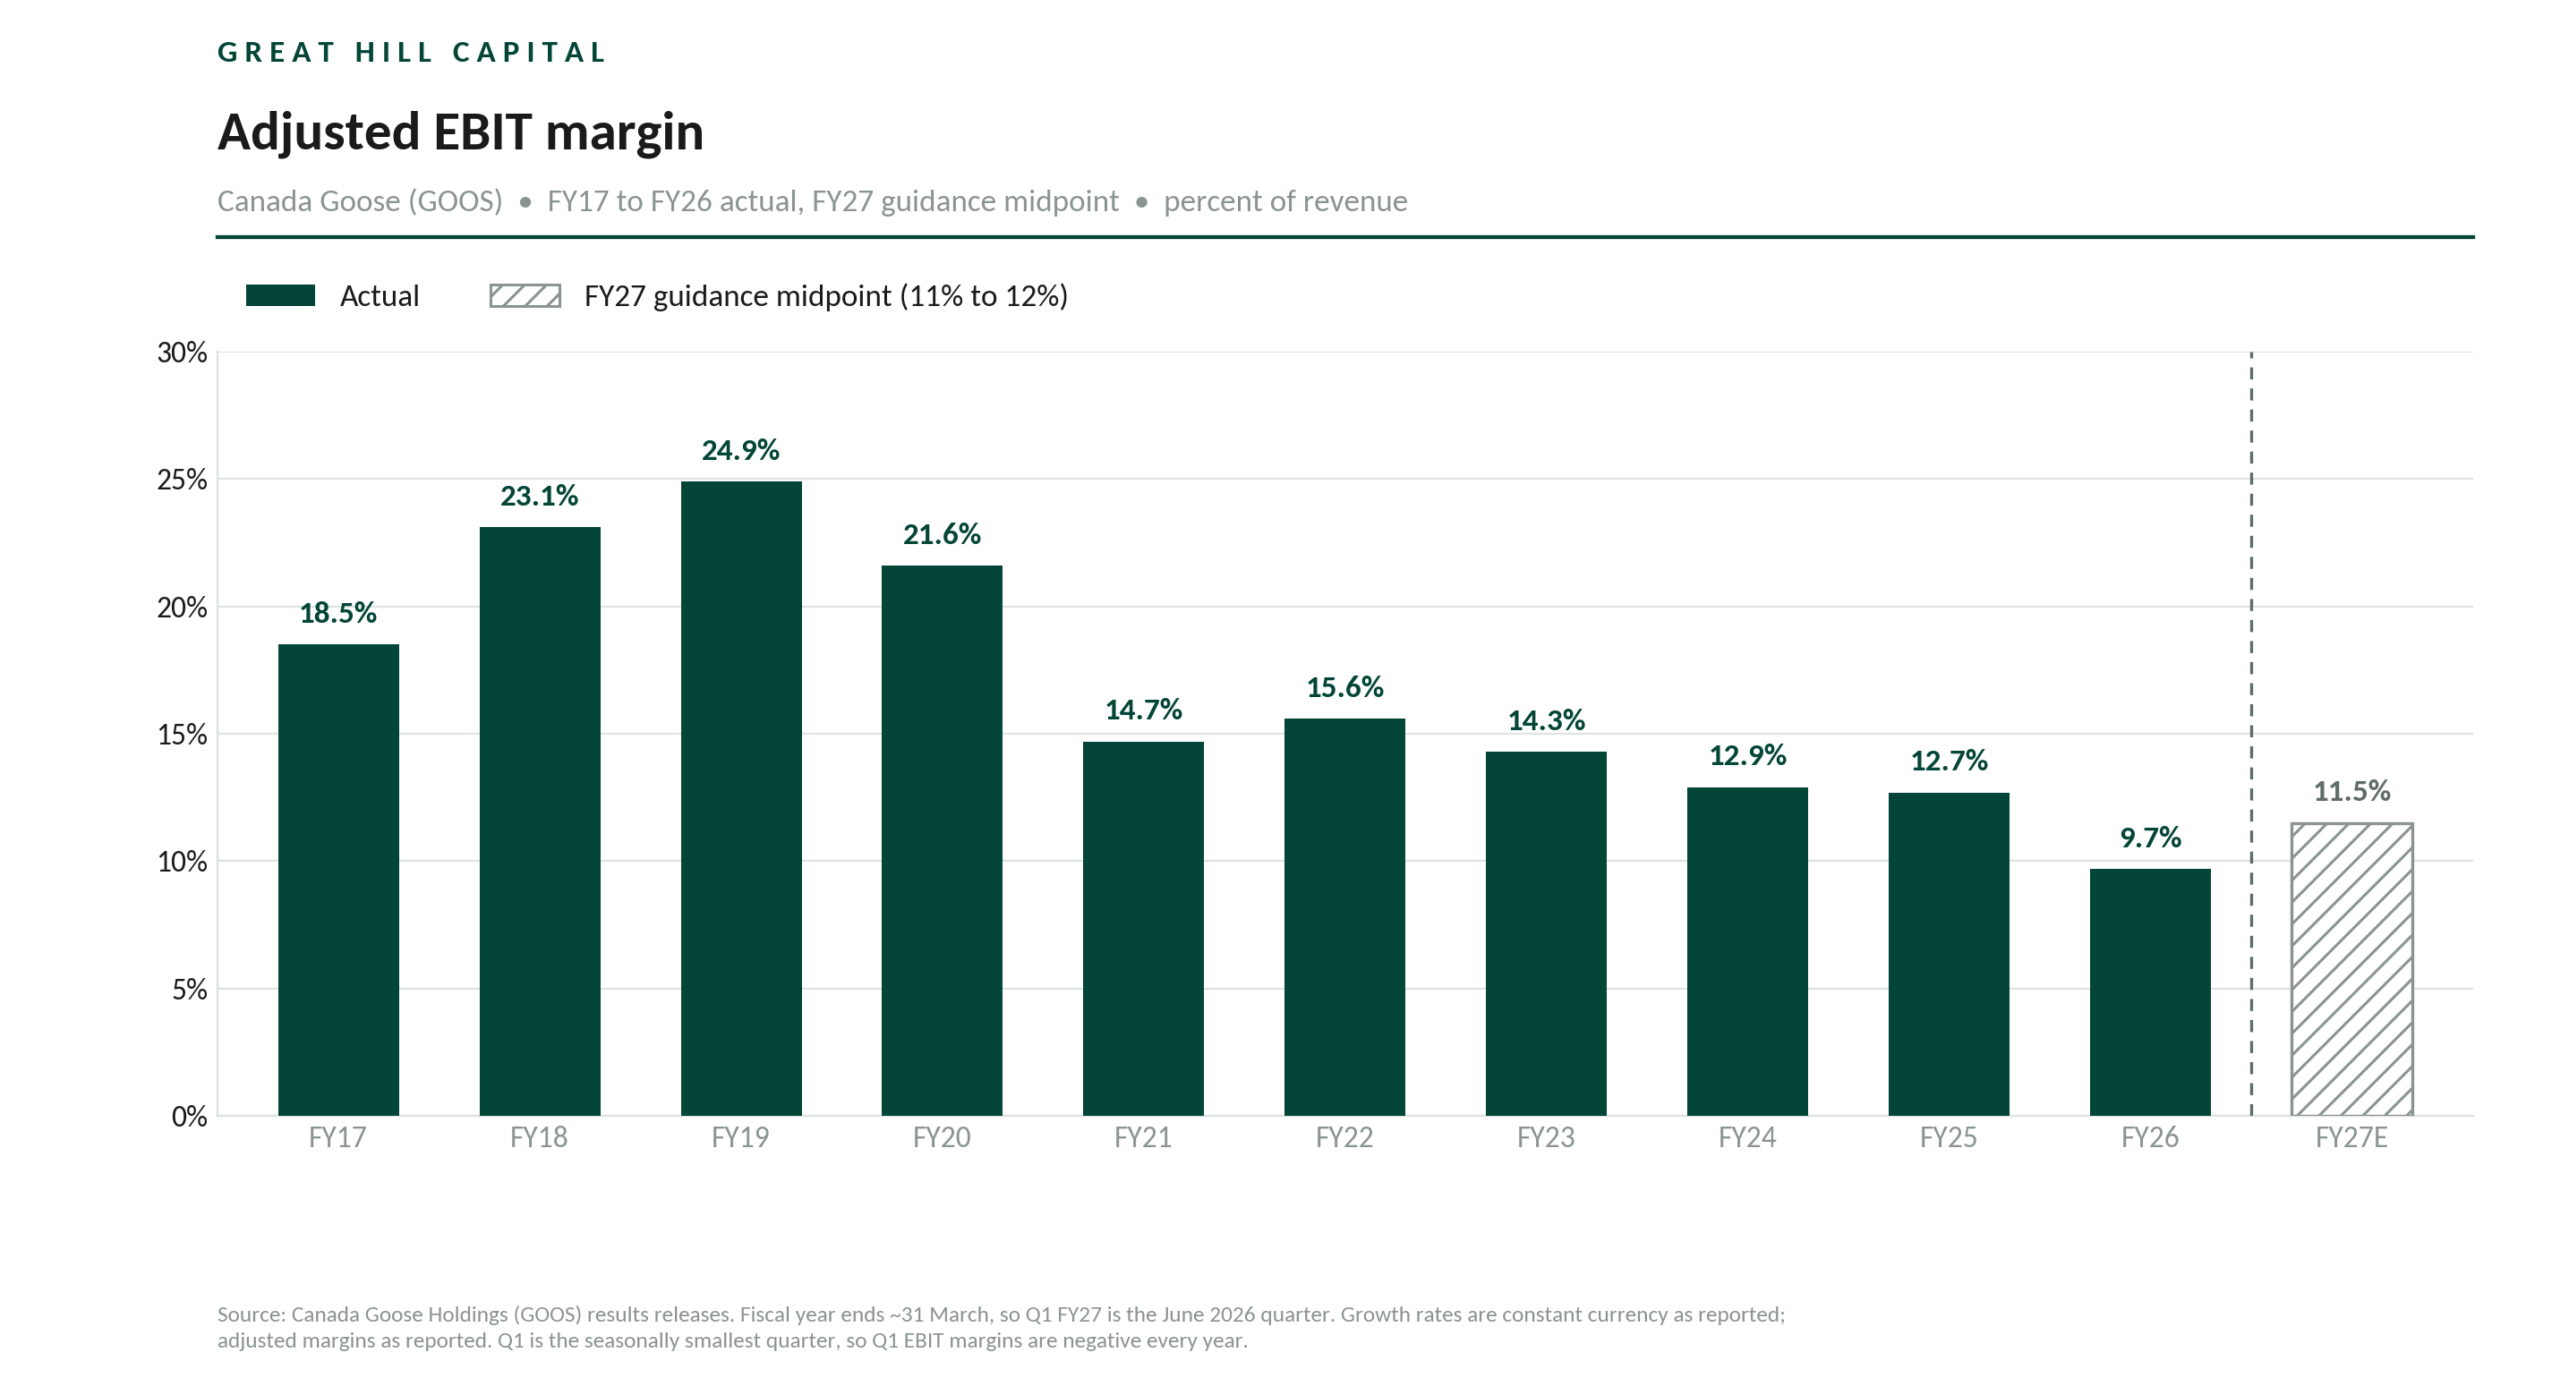
Lost operating leverage: operating margins halved from the mid-20% historical range to a low of ~9.7% in FY2026. Rising SG&A from retail expansion, increased marketing expenses, and one-time items pressured profitability.
Inflection to Growth
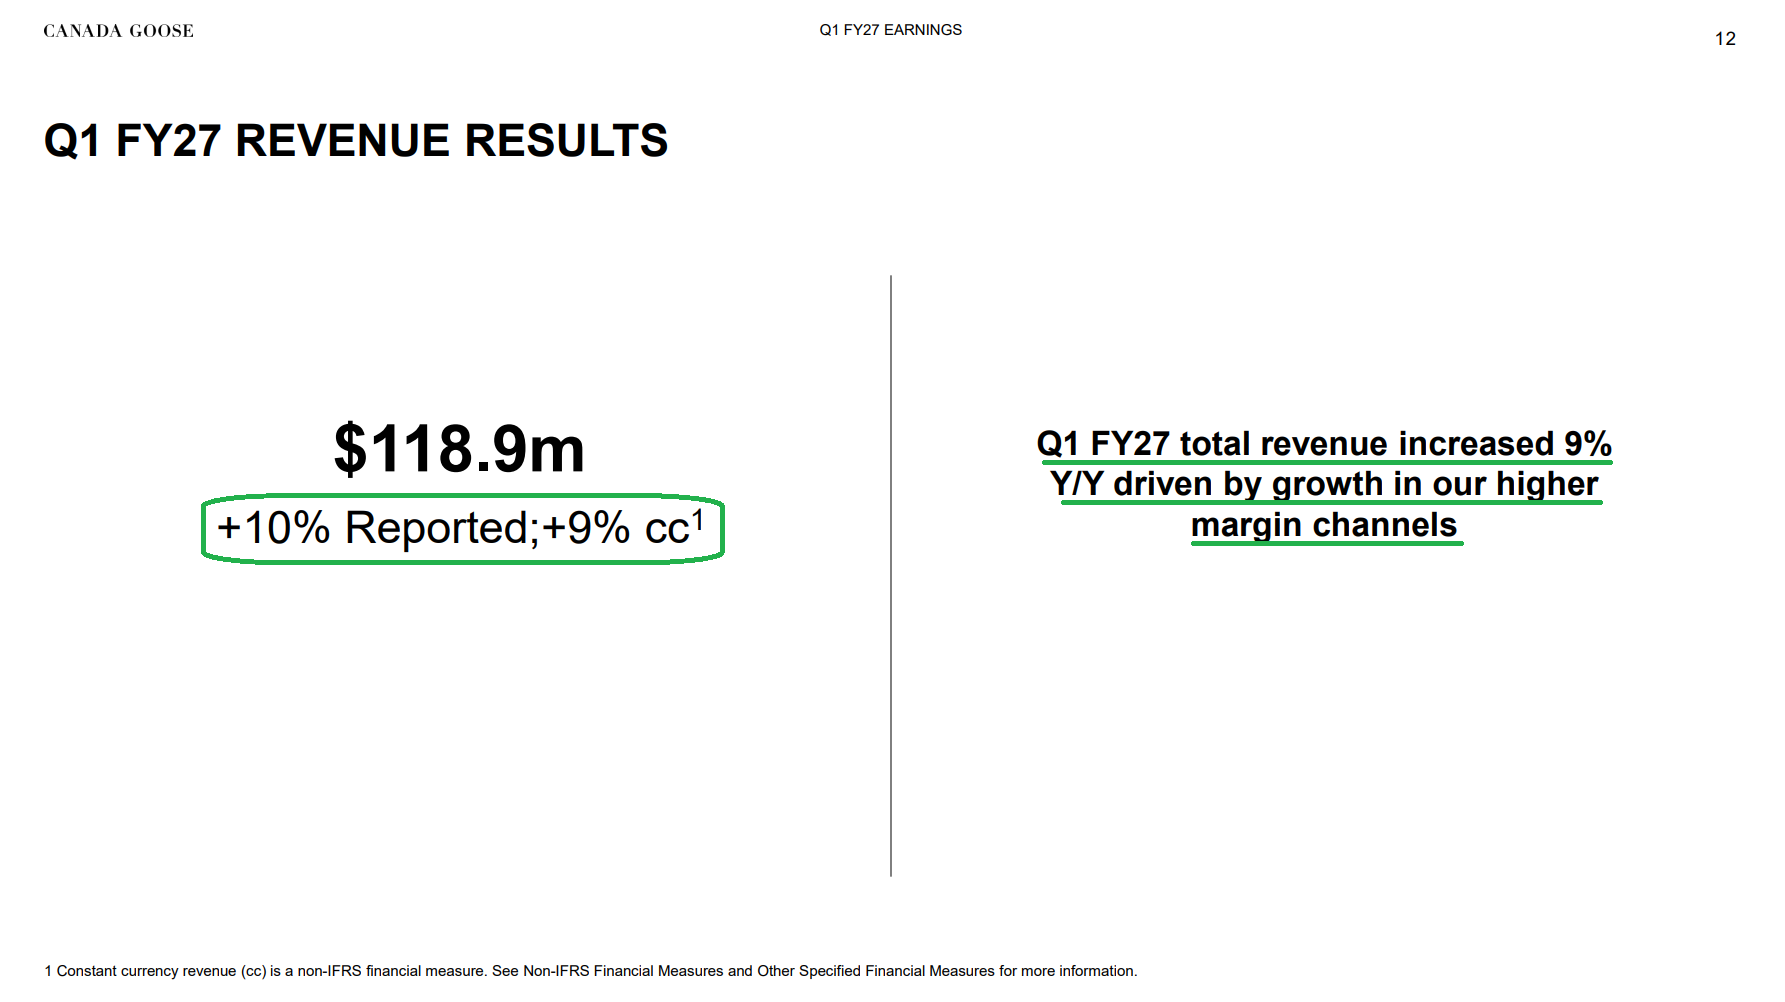
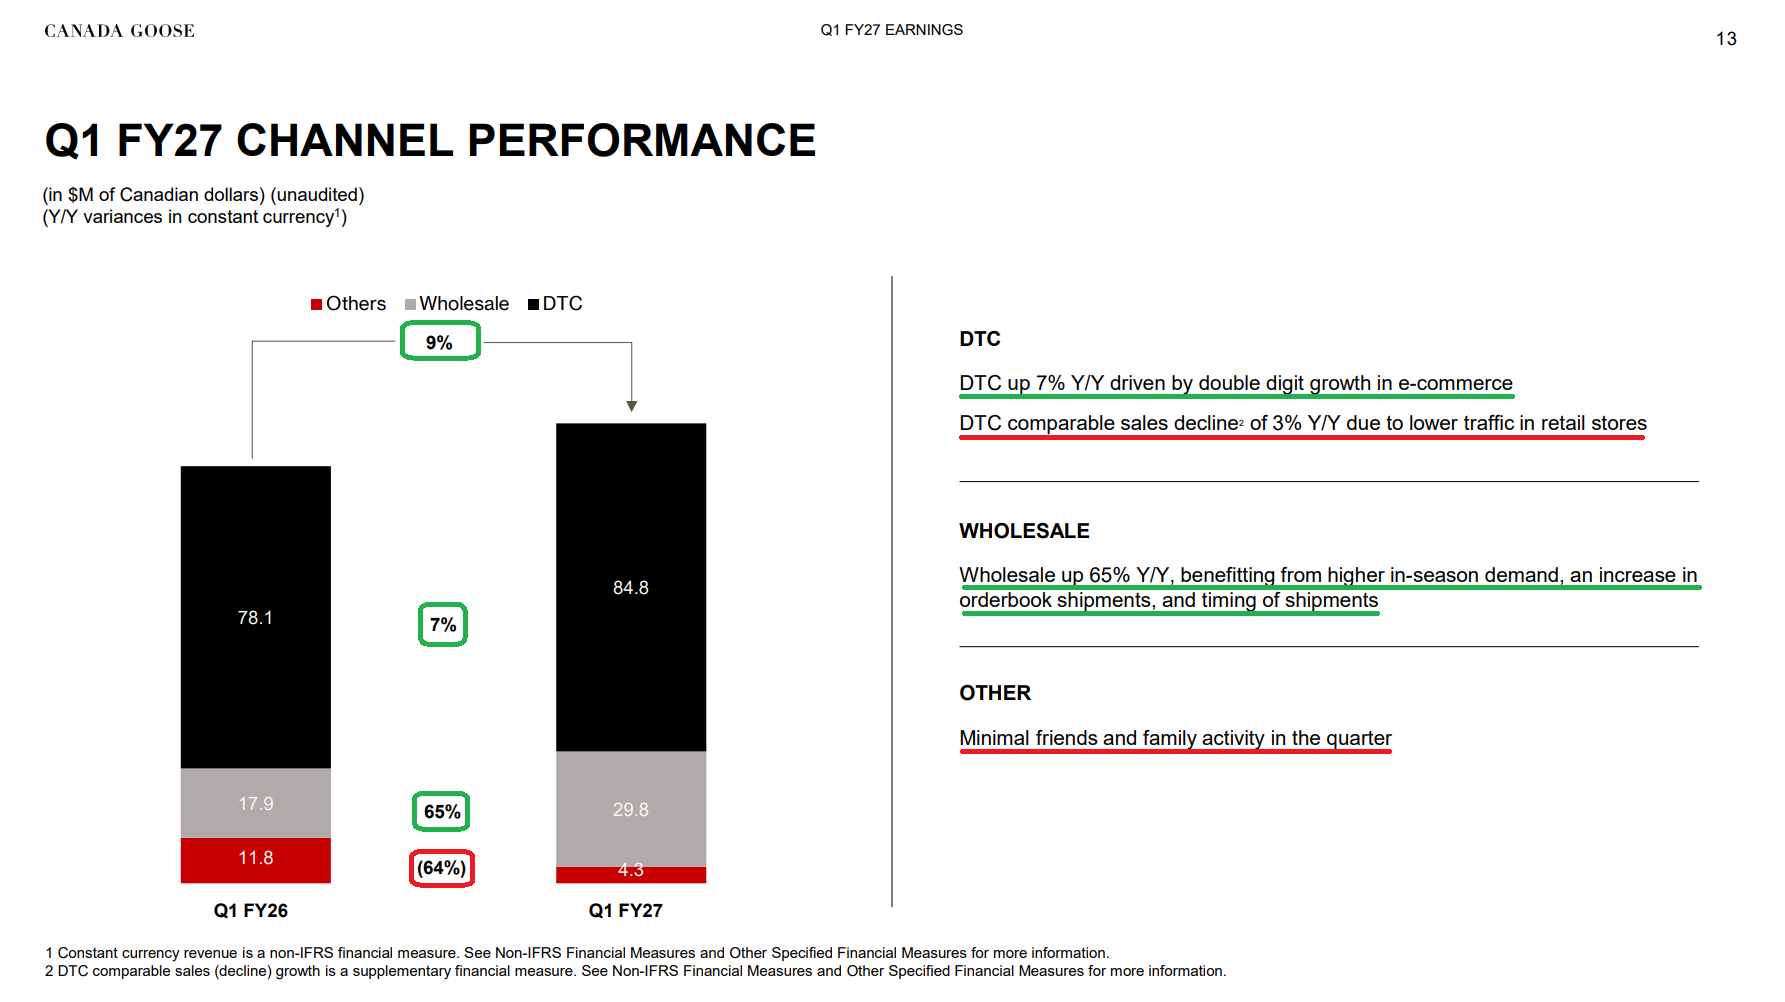
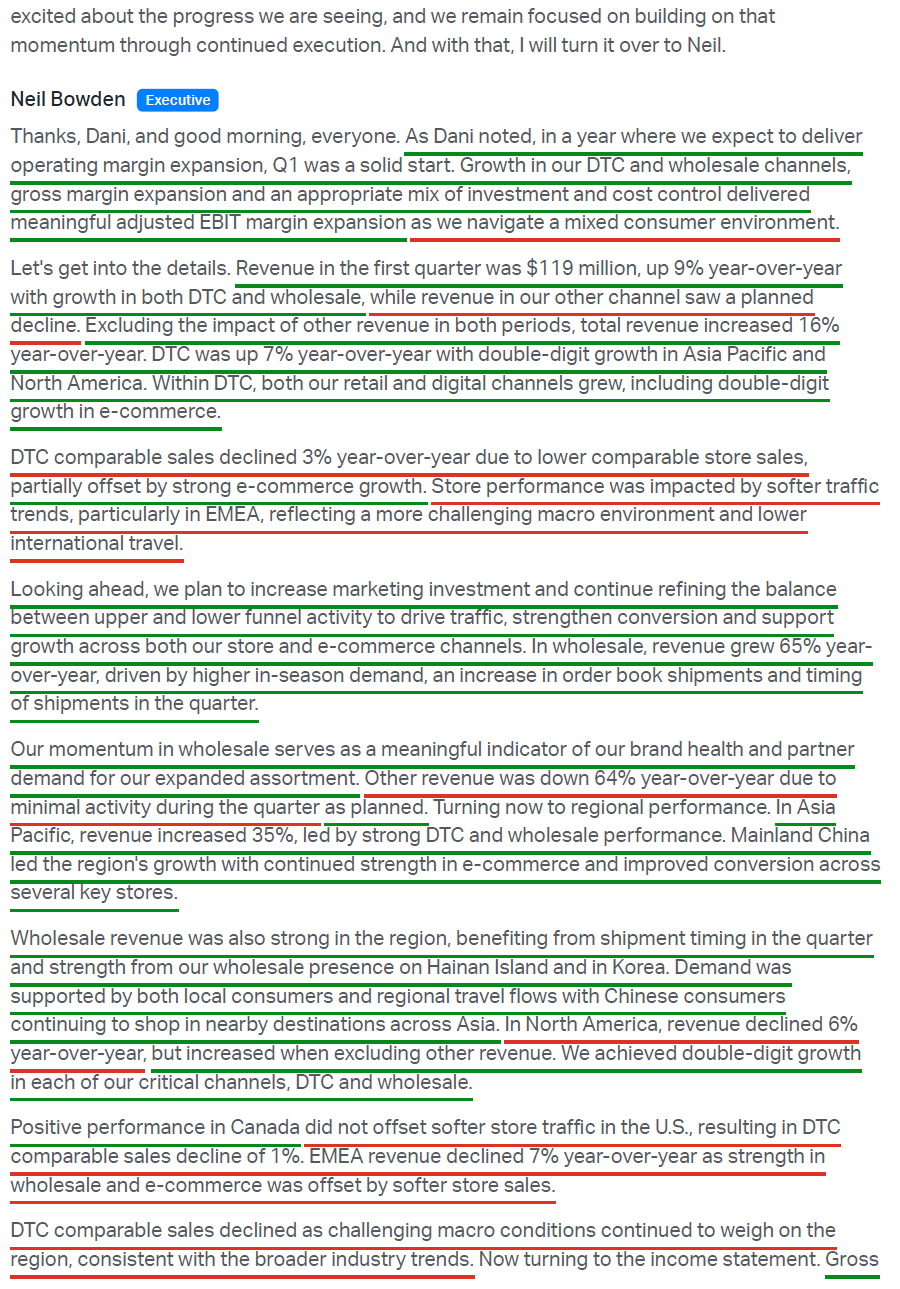
Q1 FY27: total revenue +10.3% Y/Y to $118.9M (+8.6% cc), ~$10M ahead of consensus, led by wholesale (+66.5%) and DTC (+8.6%).
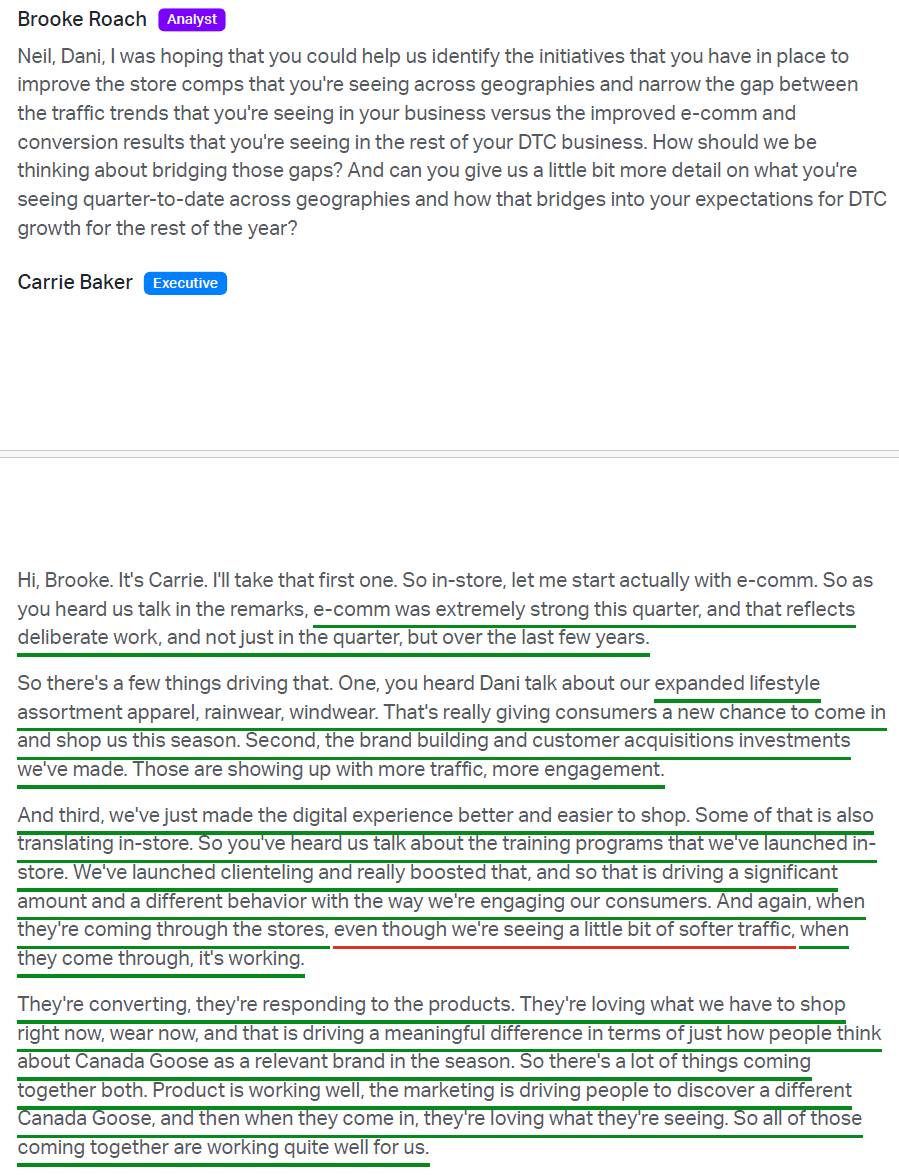
DTC comp declined 3.2% on softer store traffic, partially offset by double-digit e-commerce growth across all regions.
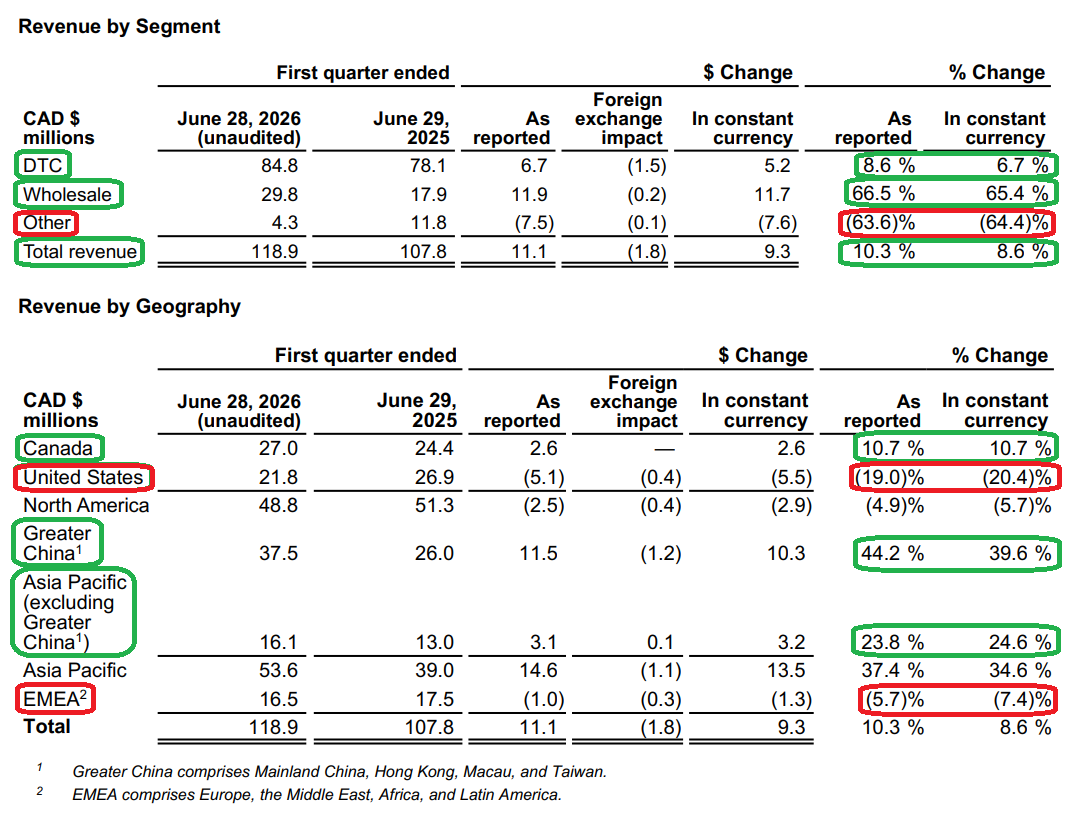
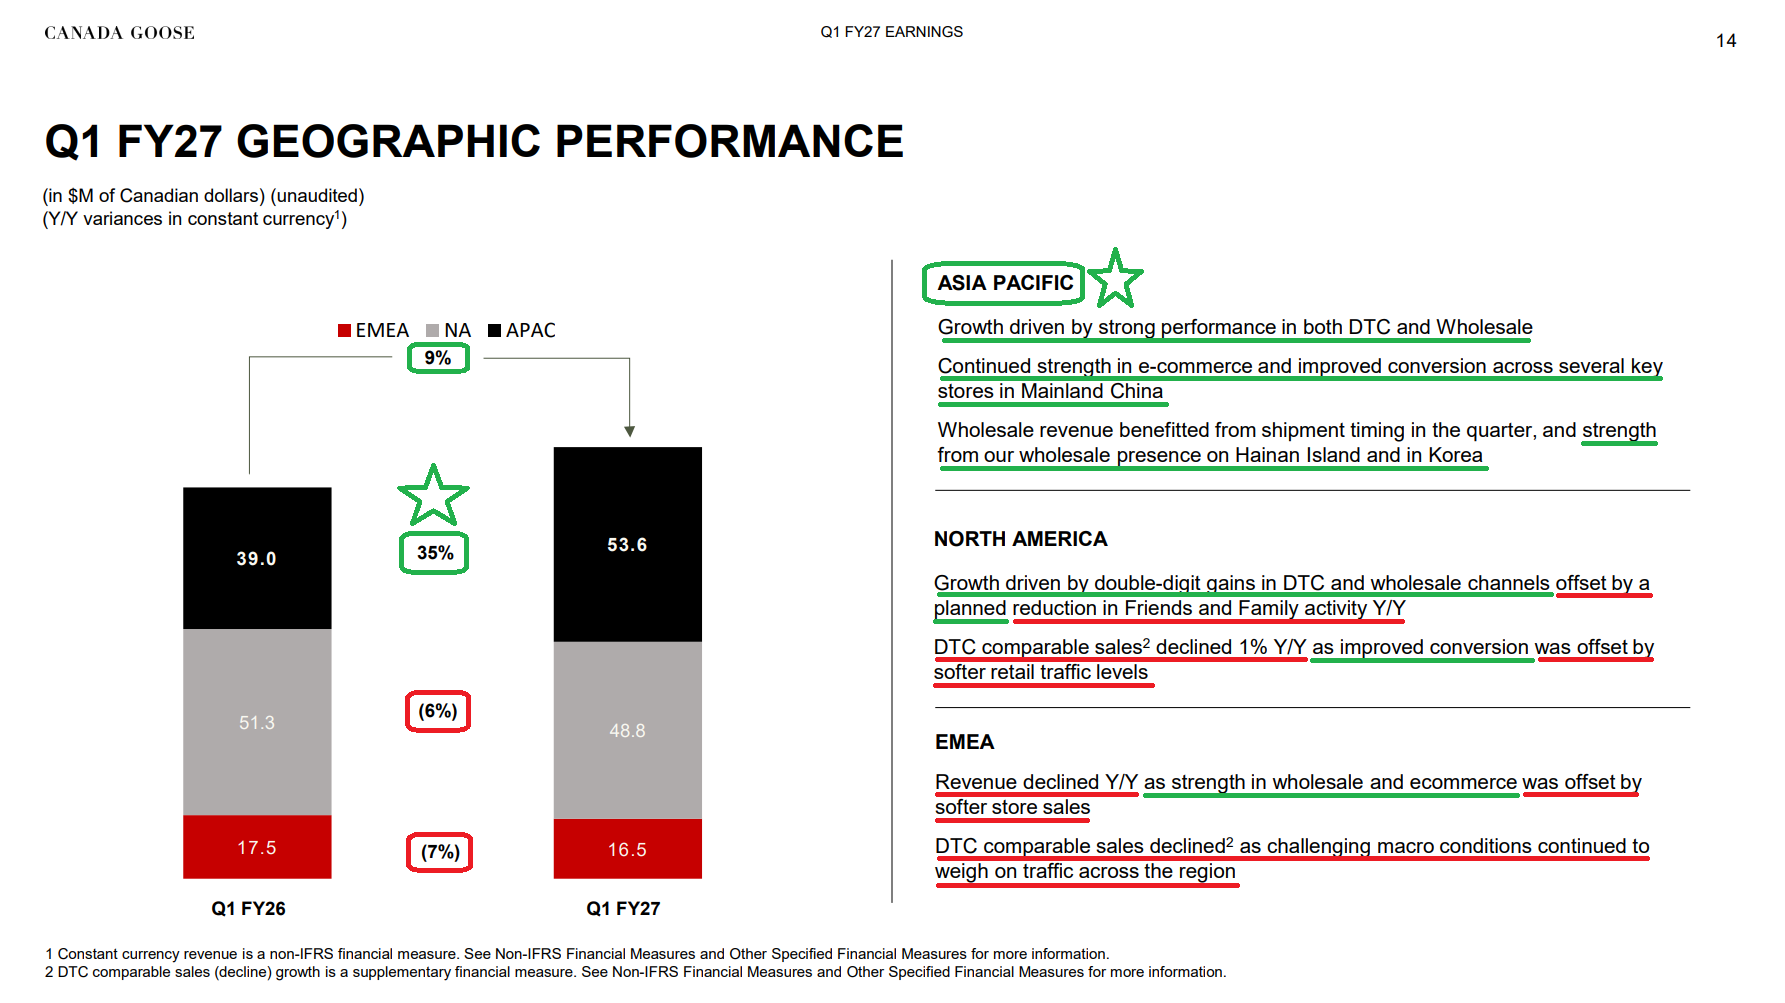
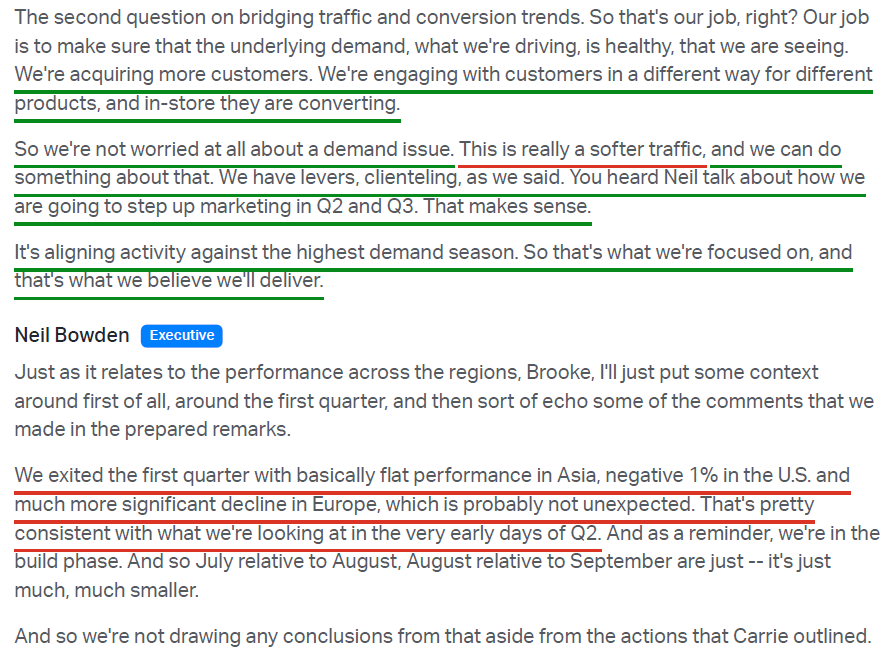
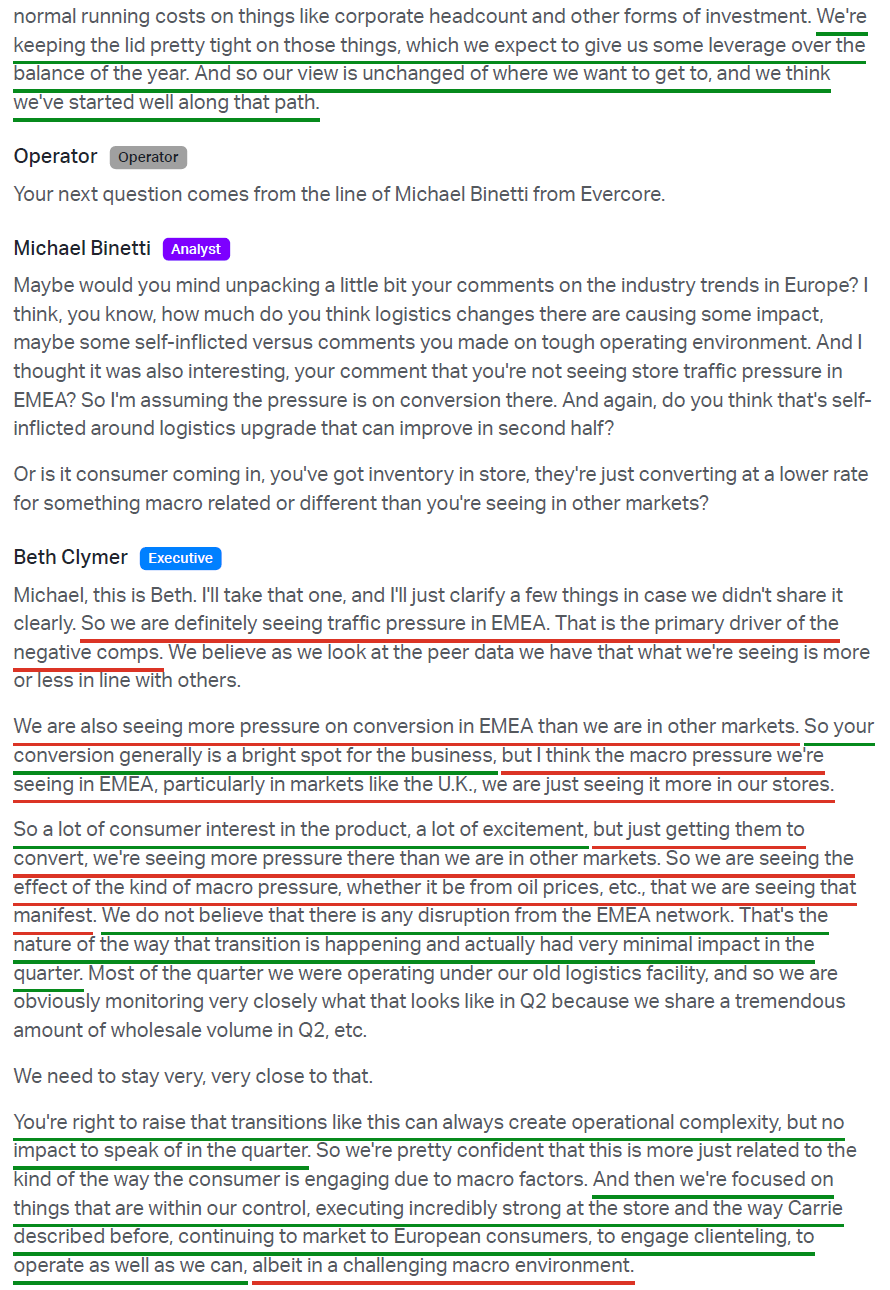
By geography in Q1 (cc): Asia Pacific +34.6% (Greater China +39.6%), Canada +10.7%, US -20.4%, EMEA -7.4%.
Full-year FY2026: total revenue +13.3% Y/Y to $1,528.2M (+12.4% cc), crossing $1.5B for the first time. Full-year DTC comp growth +8.4%.
Clear inflection to growth underway after a multi-year slowdown; still early innings.
DTC Expansion
Strategic pivot from wholesale to high-margin DTC (retail + e-commerce) for brand control and profitability. DTC commands mid-70% gross margins vs. mid-to-high 40% for wholesale.
DTC mix up from ~29% of revenue in FY2017 to ~76% in FY2026 ($1,157.4M of $1,528.2M).
Long-term target: ~80% by FY2028. Expected to sustain gross margins consistently north of 70%.
Plan to increase permanent store count to ~130 locations by end of FY2028 (92 as of Q1 FY27).
Wholesale Reset
The three-year wholesale channel reset toward brand-aligned partners and healthier inventory positions is now complete, and the channel has returned to growth (+11.7% reported / +8.5% cc for FY2026 to $291.2M) after three straight years of declines (-6% in FY23, -16% / -19% cc in FY24, and -16.5% / -18% cc in FY25).
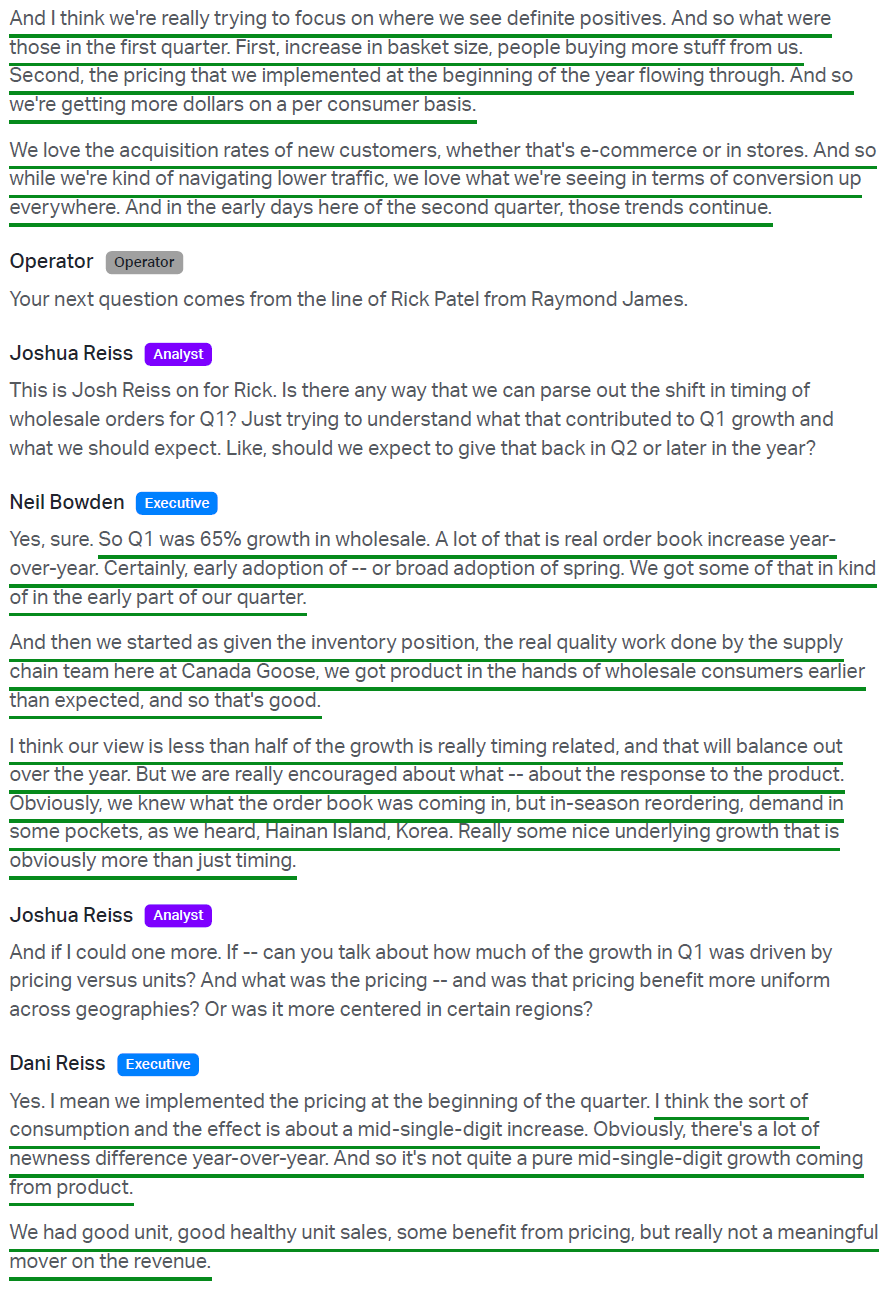
Q1 FY27 wholesale revenue +66.5% Y/Y to $29.8M (+65.4% cc) on a larger planned order book, stronger in-season reorders, and shipment timing, with strength in Hainan Island and Korea.
Wholesale is now a healthy contributor rather than a drag, with another year of growth expected in FY27 supported by encouraging Fall/Winter ’26 order book indications.
365-Day Relevance
Transforming from a winter-only, one-time $1,000+ parka brand to an all-season, 365-day relevant luxury lifestyle brand.
Expanding beyond heavy down-filled items (historically ~95% of business <15 years ago, now ~50%). Apparel led growth for the full year FY26, while down-filled outerwear remained the majority of revenue and a meaningful contributor to growth.
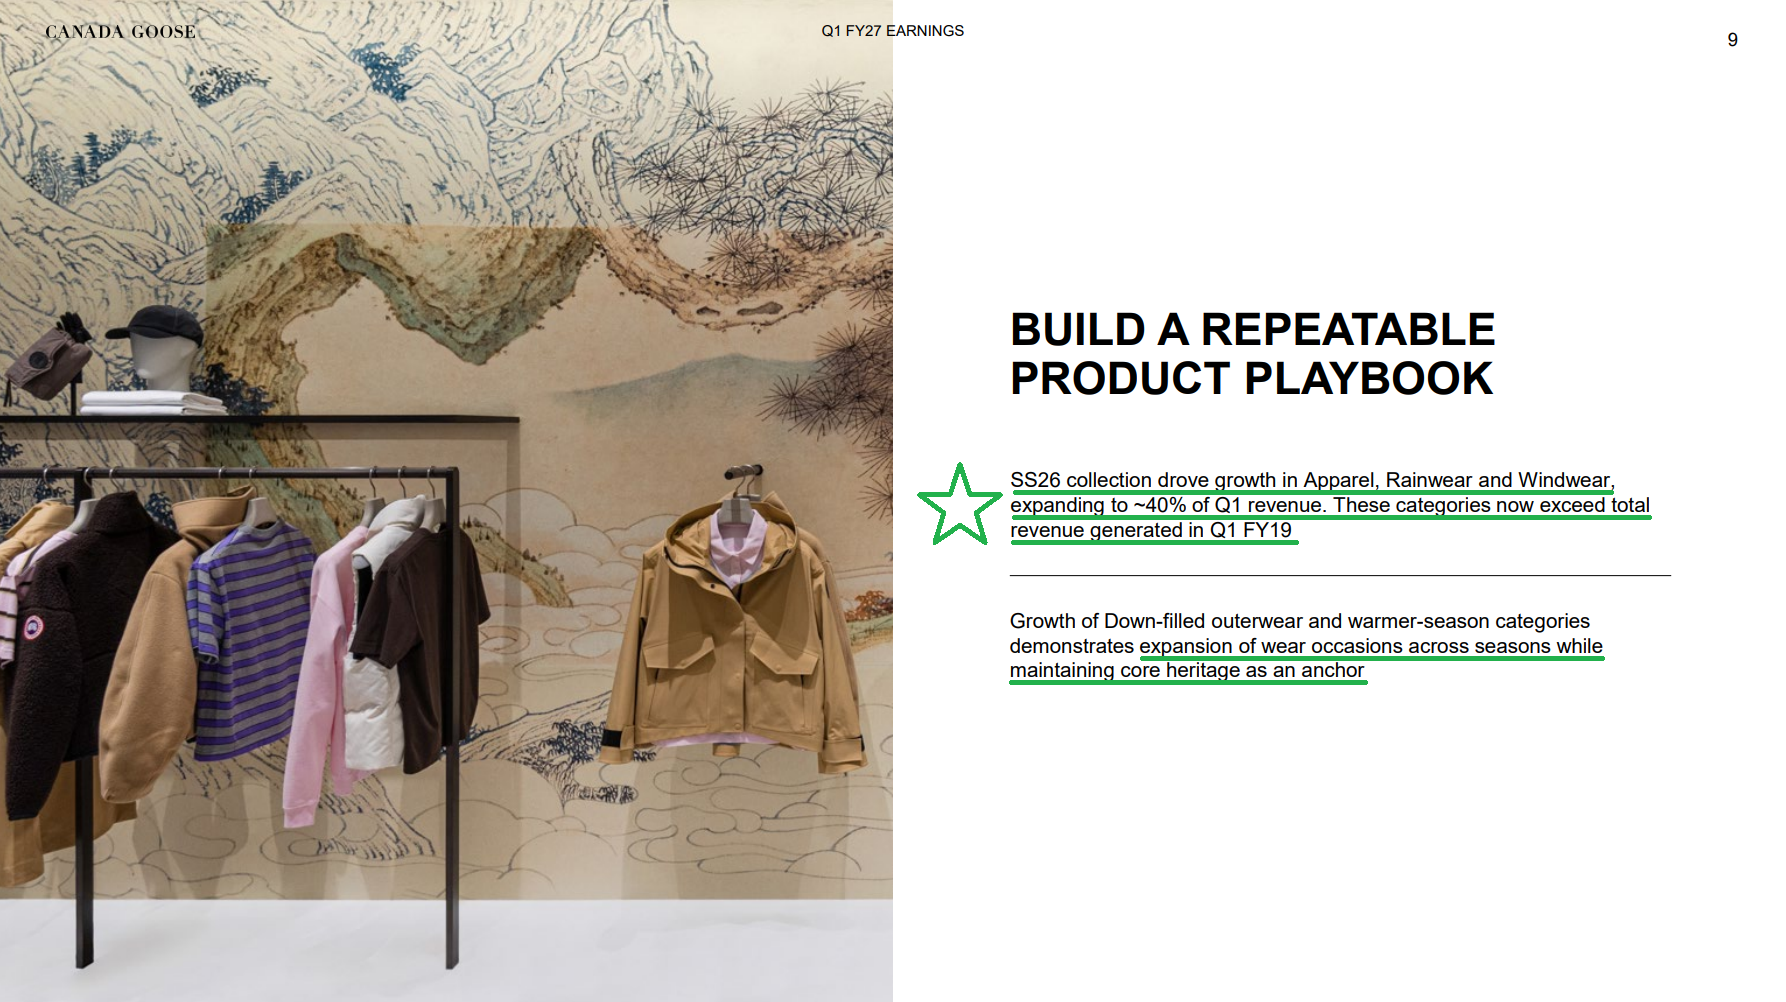
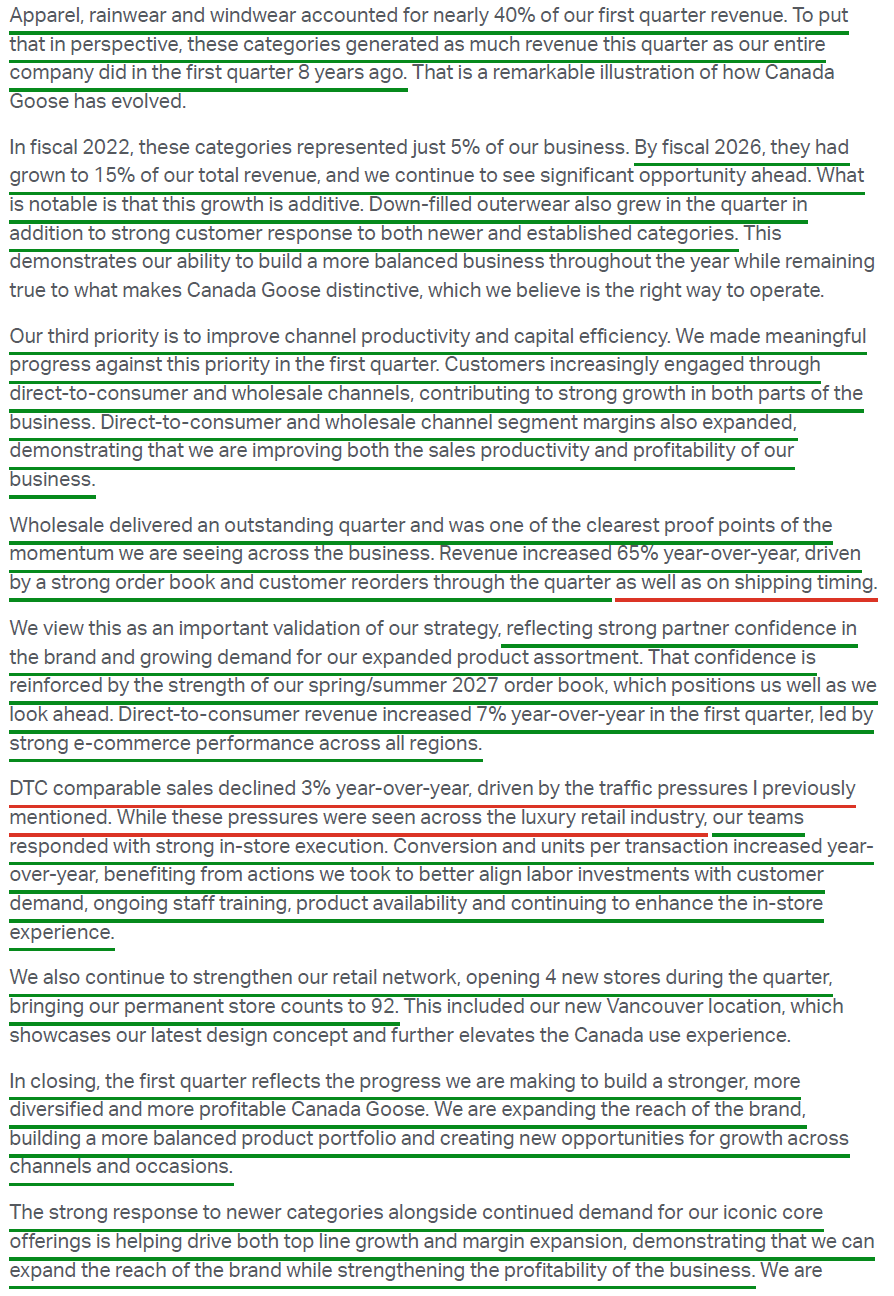
In Q1 FY27, apparel, rainwear, and windwear reached ~40% of revenue, now matching the company’s entire Q1 FY19 revenue.
Launched largest-ever Spring/Summer ’26 mainline collection, brought to market earlier than prior years to strengthen presence through the shoulder season.
Introduces lower price points (e.g., $175 T-shirt vs. $1,000+ parka) for more frequent purchases and year-round shopping. Builds repeat frequency and broader appeal to reduce seasonality.
Both new customer recruitment and repeat customer counts increased Y/Y in FY26, alongside a step up in purchase frequency.
Margin Expansion / Cost Discipline
FY2026 gross margin essentially flat at 69.7% (vs. 69.9% FY2025).
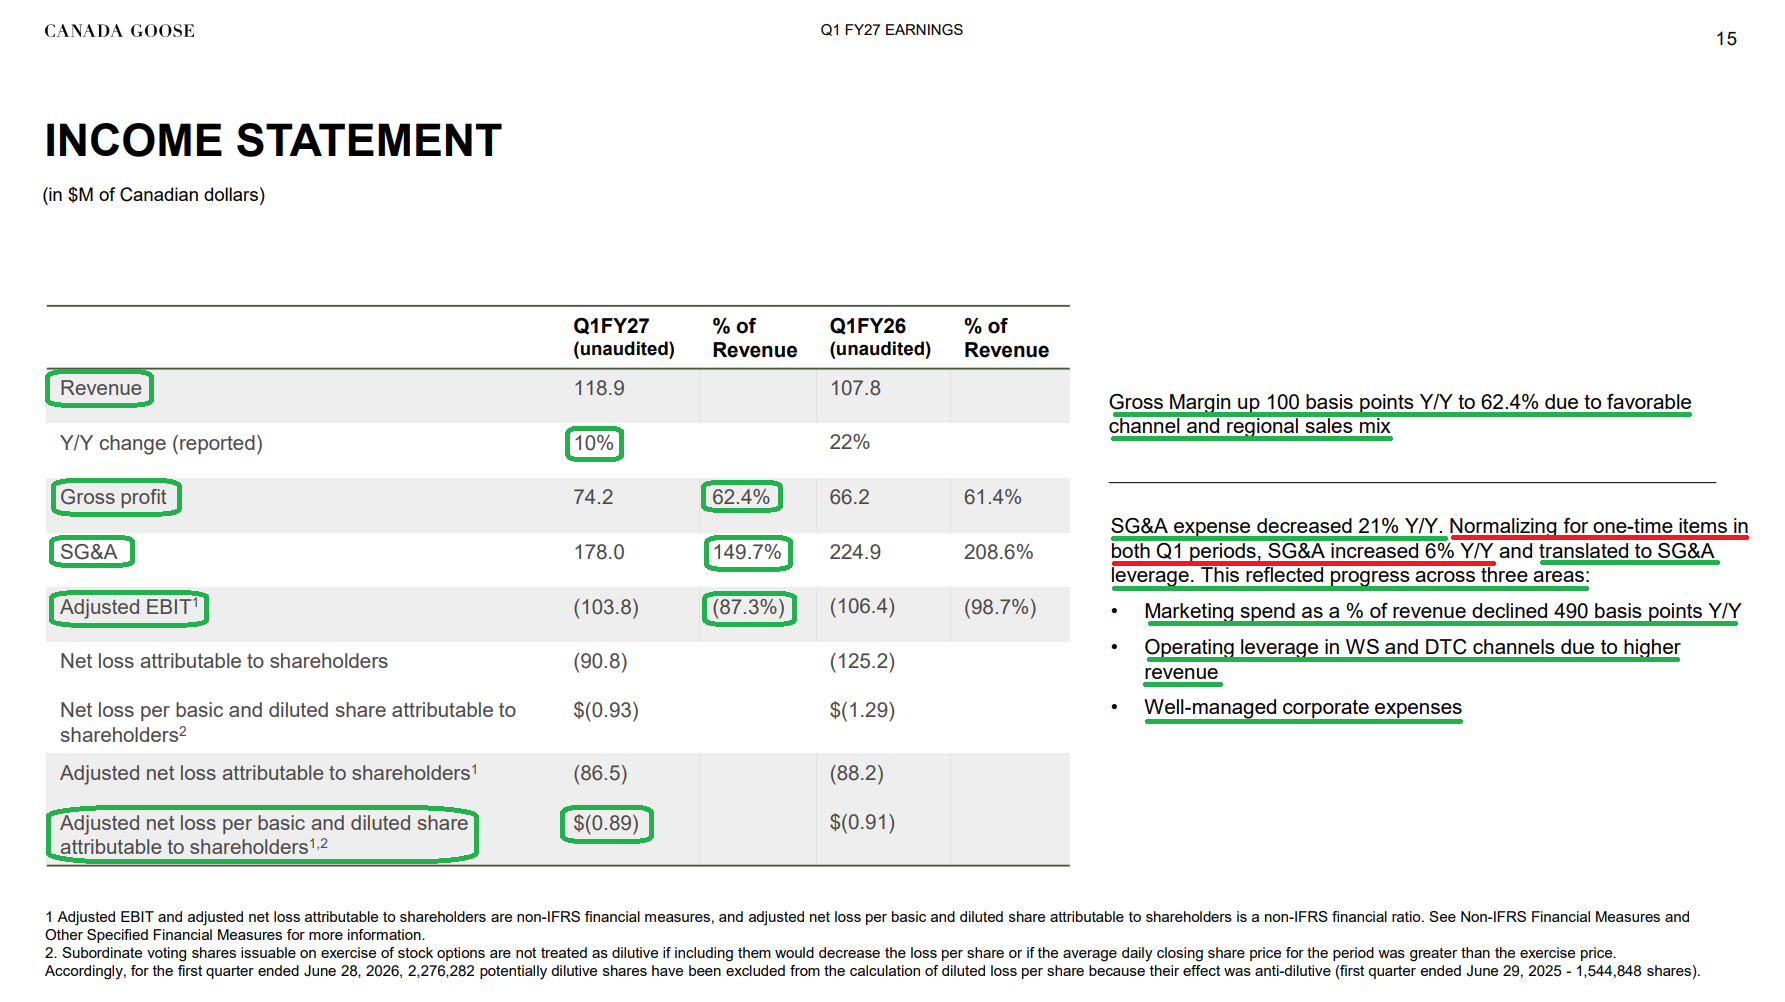
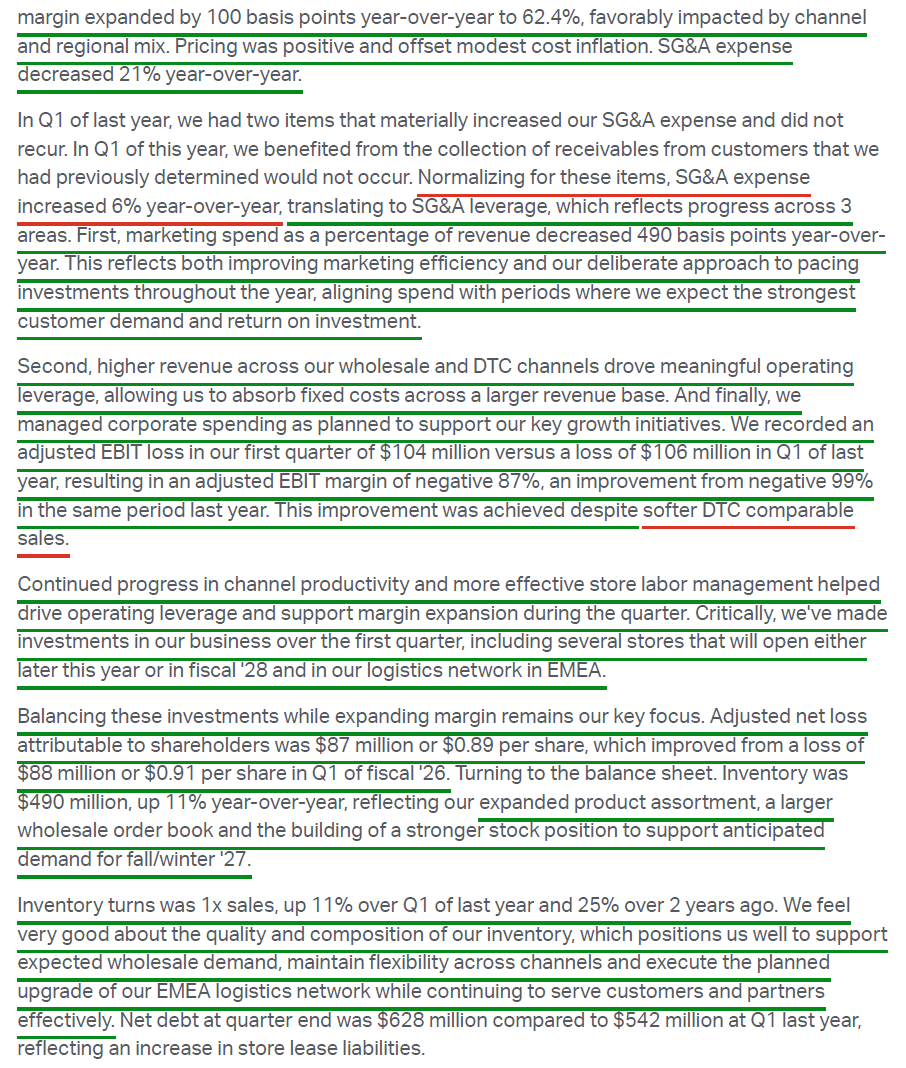
Q1 FY27 gross margin 62.4%, up 100 bps Y/Y, on favorable channel and regional mix. Q1 runs well below the full-year rate given seasonal channel mix.
FY2026 adjusted EBIT $148.0M (9.7% margin) vs. $171.4M (12.7% margin) in FY2025, with the full-year decline driven by three one-time headwinds: a $43.8M arbitration award, a $15M U.S. wholesale bad debt provision, and an $8.4M Q4 store impairment.
Q1 FY27 adjusted EBIT $(103.8)M, margin (87.3)% vs. (98.7)% a year ago, over 11 points of improvement and the strongest first-quarter margin since fiscal 2020.
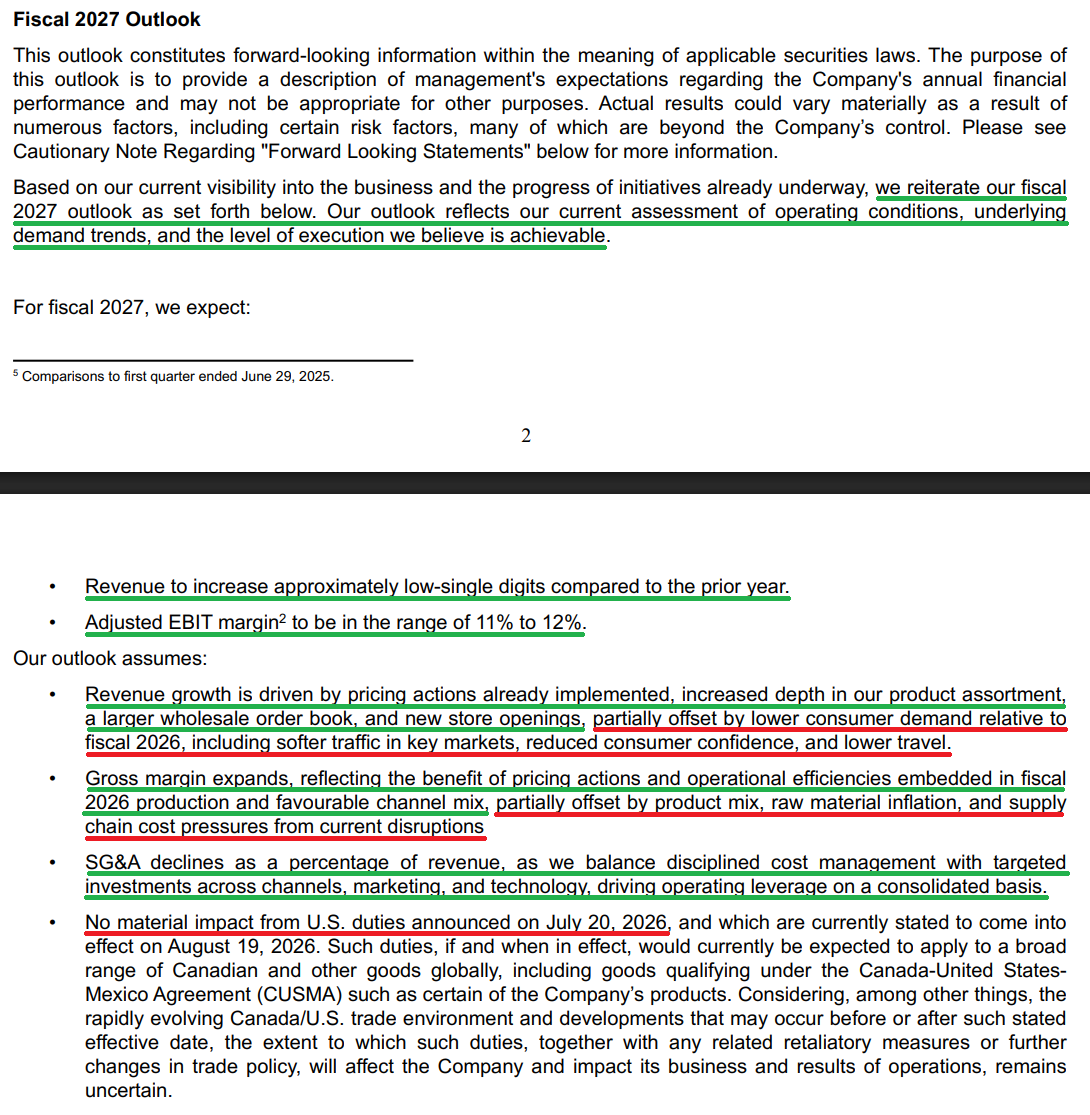
FY27 guidance: revenue to grow low-single digits Y/Y on a constant currency basis; adjusted EBIT margin of 11-12%, representing ~130-230 bps of expansion off the FY26 base.
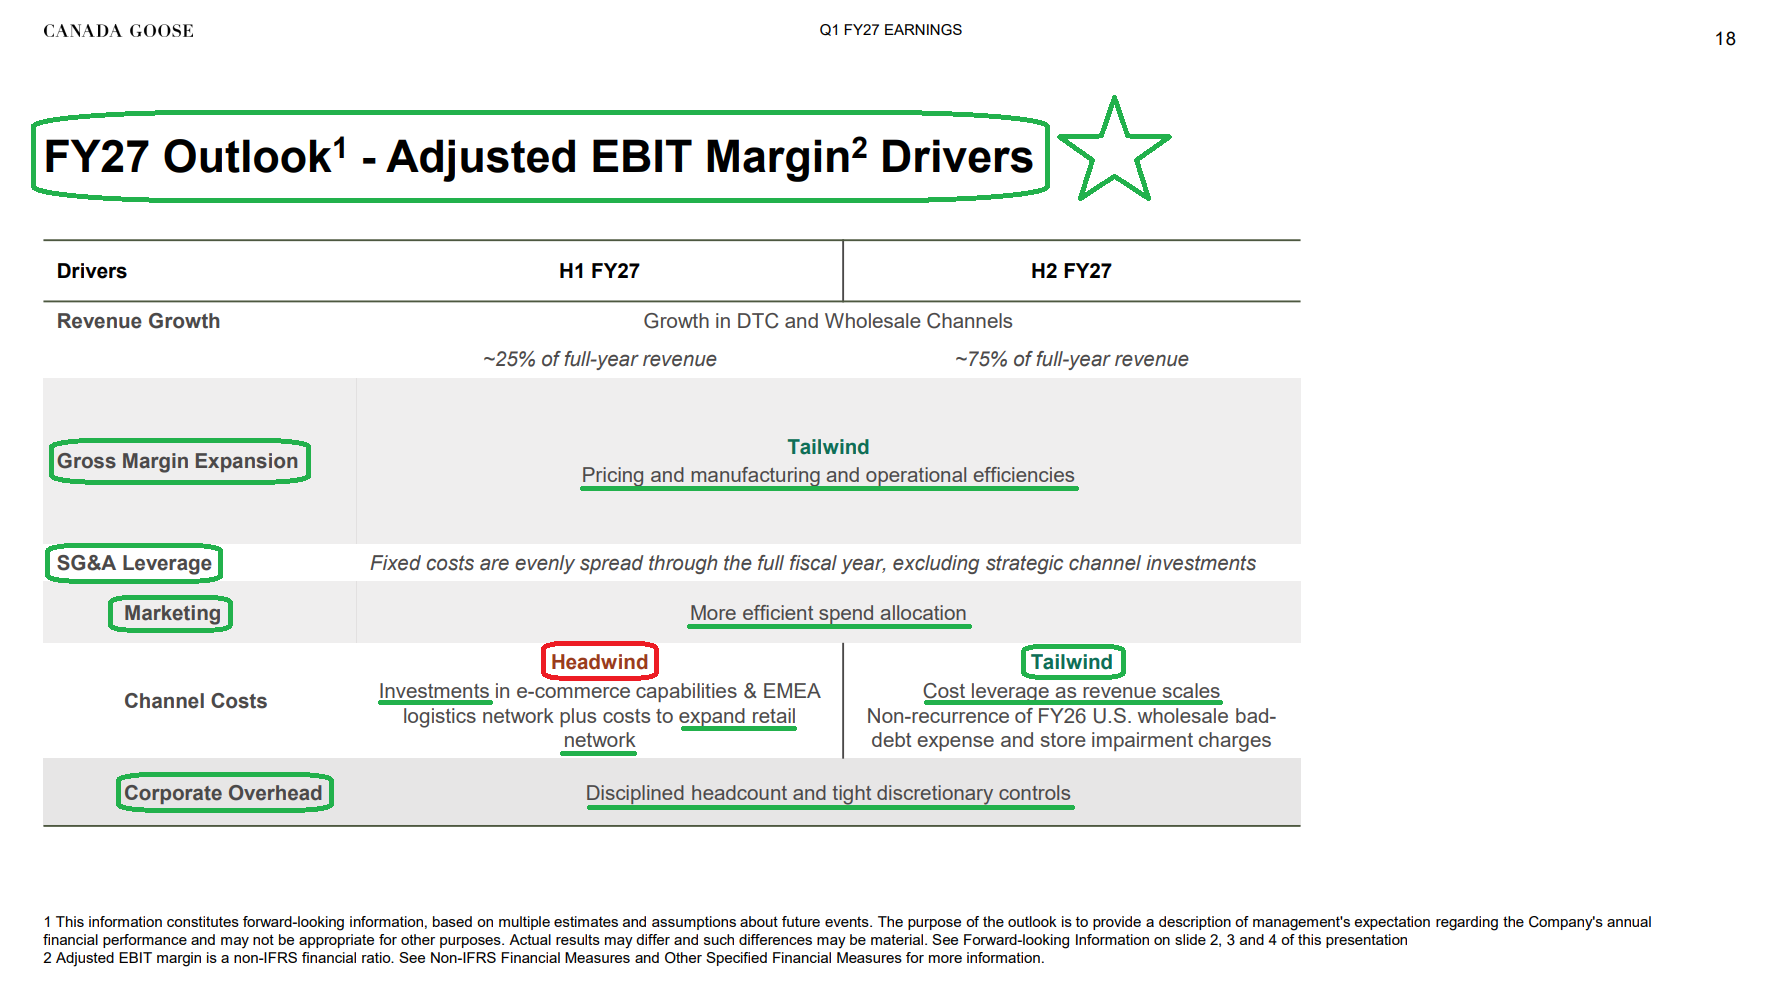
Margin drivers: gross margin expansion, more efficient marketing, tight corporate cost control, and the non-recurrence of FY26’s bad debt provision and store impairment. ~75% of revenue and all of the profit lands in the back half. Reiterated at Q1 FY27.
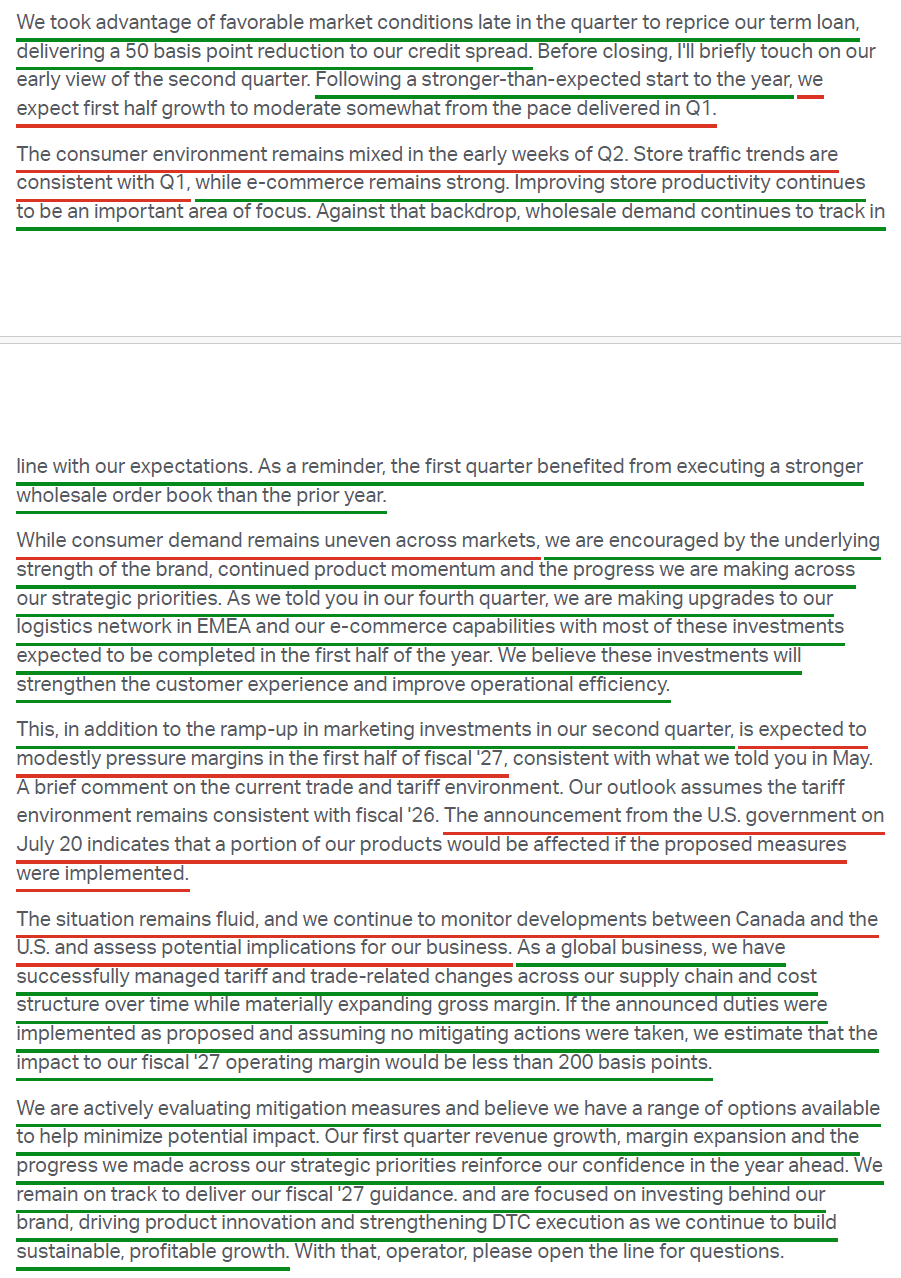
Tariff watch: US announced 50% duties on a broad range of Canadian goods including apparel on July 20, 2026, set to take effect around August 19. If implemented as proposed with no mitigation, management estimates the FY27 operating margin impact at less than 200 bps. Guide assumes no material impact; management has mitigation options and says it remains on track.
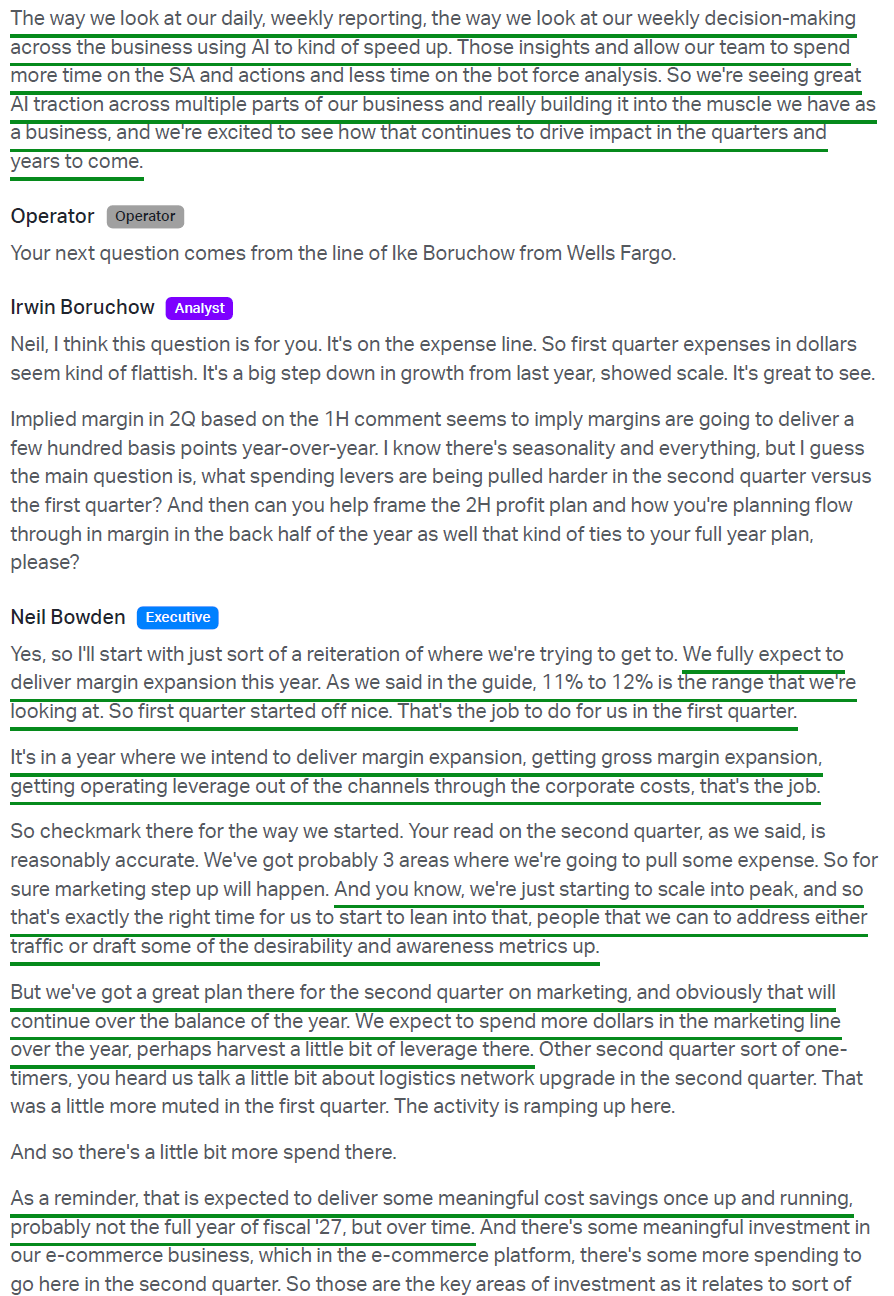
Marketing efficiency focus: plan to keep reducing marketing as a % of revenue in FY27 without sacrificing comp growth. In Q1 FY27, marketing as a percent of revenue declined 490 bps Y/Y.
Cost actions: ~17% corporate workforce reduction (March 2024) following ~10% cut (August 2023). ~$25M in annualized savings.
Key Financials + Valuation
Net debt ~$627.8M at Q1 FY27 (vs. ~$542M a year ago and ~$383M at FY26 year-end), with net debt leverage of 2.1x adjusted EBITDA (vs. 1.8x a year ago).
Cash ~$206.9M (vs. ~$408M at FY26 year-end).
Repriced the term loan late in Q1 for a 50 bps reduction in credit spread.
Inventory $489.9M at Q1 FY27 (+11% Y/Y), turns improving to 1.0x (+11% Y/Y, +25% vs. two years ago), built for an expanded assortment, a larger wholesale order book, and Fall/Winter ’26 production. (FY26 year-end: $386.3M, flat Y/Y, turns 1.2x.)
Share count reduced ~11.6% over the past five years.
Forward P/E: ~9.3x vs 5 year average closer to ~19x
Q1 Commentary
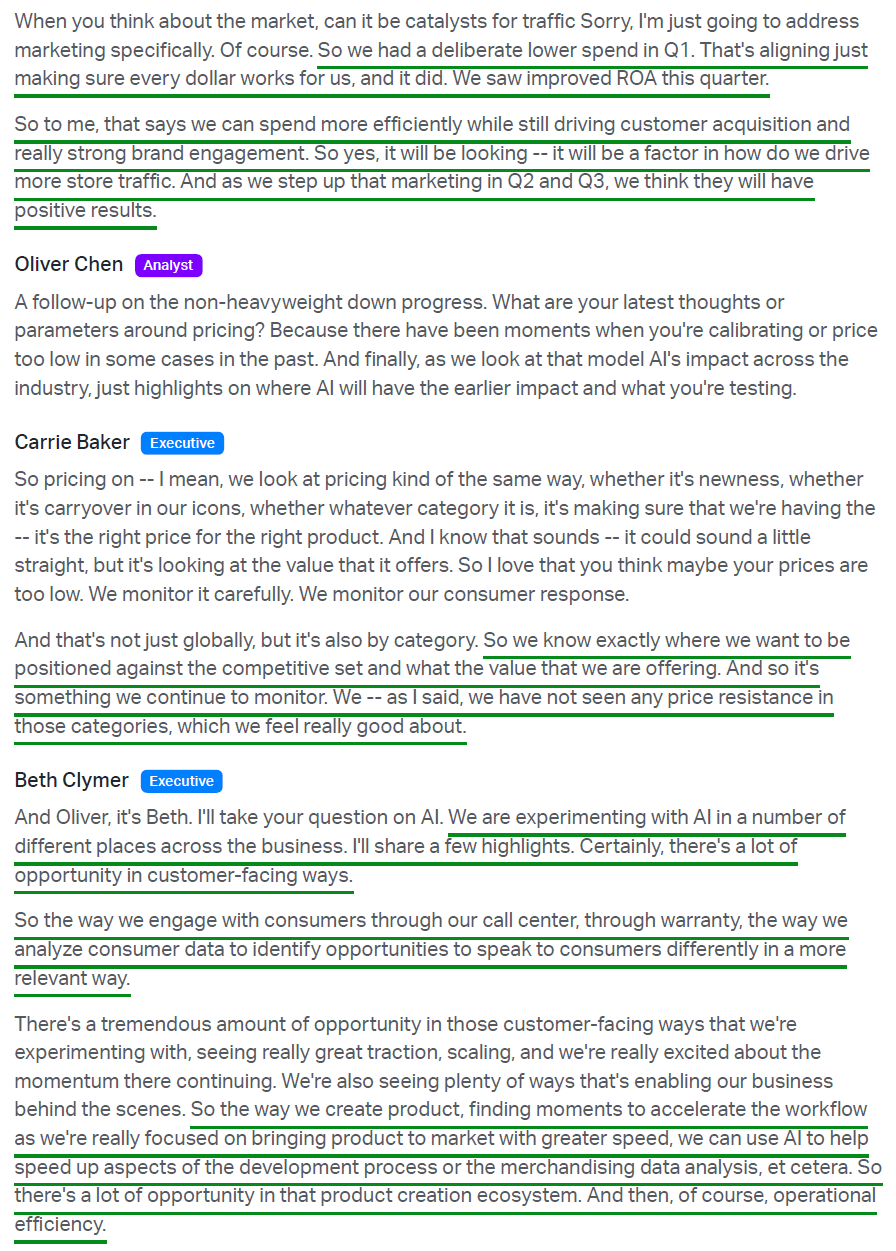
Canada Goose kicked off fiscal 2027 by putting points on the board in what has historically been its lowest-stakes quarter of the year. Despite generating only ~7% of full-year revenue last year, Q1 still served as a solid display of execution, with revenue growing +10.3% Y/Y (+8.6% C$) to $118.9M, ahead of the ~$108.8M the Street expected. Both DTC and wholesale contributed to the top-line beat, while adjusted EBIT margin expanded 11.4 points to its strongest first-quarter level since FY2020. The lone soft spot was DTC comp sales, which fell 3.2% as softer store traffic outweighed double-digit e-commerce growth. Even so, management’s expectation for positive DTC comps over the full year remains intact, with the peak holiday season carrying far more weight than the first quarter.
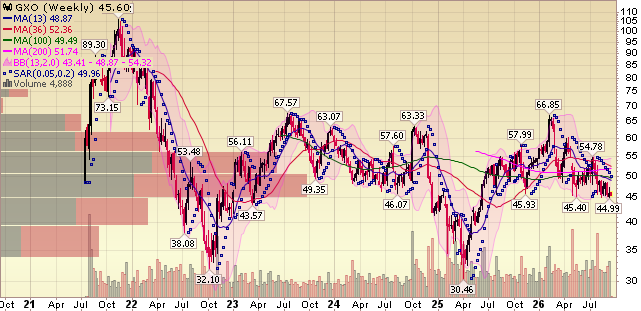
The market, however, has been in no mood to give GOOS the benefit of the doubt. The stock sits nearly 90% below its all-time highs, trading at levels seen only briefly around the Liberation Day lows, as the negative comp landed on top of a tariff overhang that has dominated the conversation since July. That is when the U.S. announced 50% duties on a broad range of Canadian goods, including apparel, which went into effect in August and brought in products that had long been shielded under USMCA.
As the face of Canadian-made luxury apparel, Canada Goose quickly became the poster child for the tariff trade in a shoot-first, ask-questions-later market. The company is certainly exposed, with ~two-thirds of its products made in Canada, including nearly all of its down-filled outerwear. Yet that exposure is far more contained than the headlines suggest, as down-filled outerwear now makes up only ~half of the overall mix, while the U.S. accounts for just ~25% of total sales.
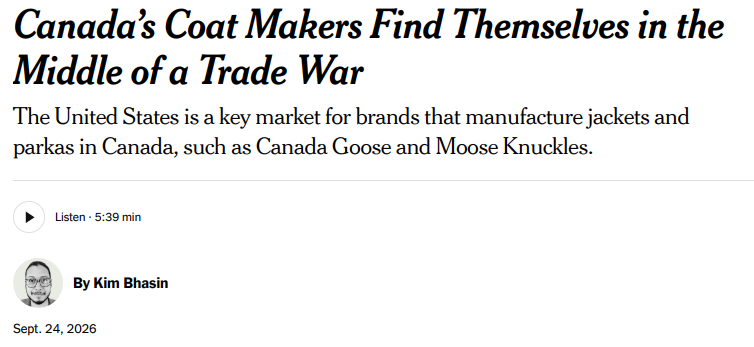
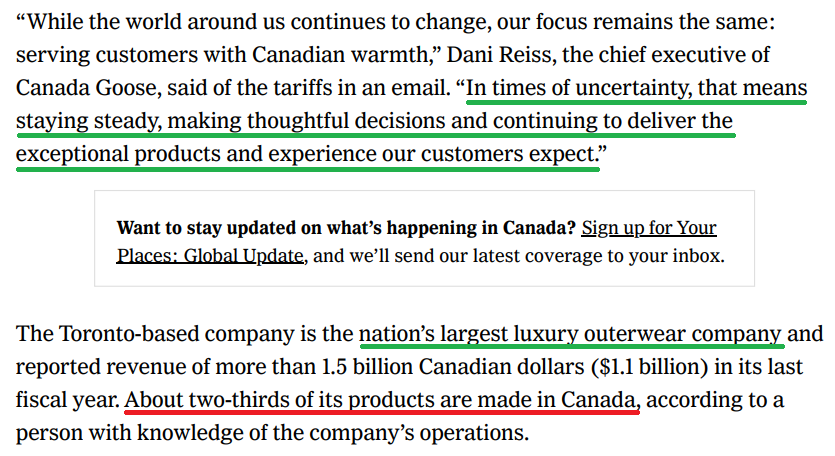
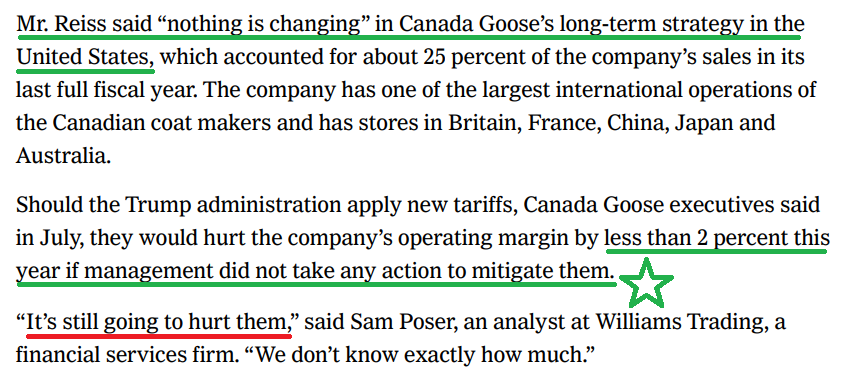
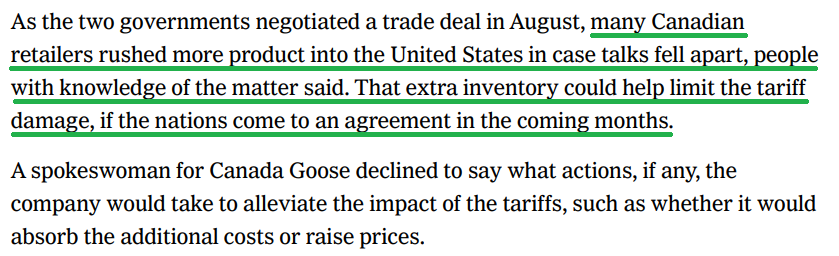
Management estimates the duties will weigh on FY27 operating margin by less than 200 bps, a figure that assumes no mitigation whatsoever. The company has plenty of levers at its disposal to chip away at that number, from improved retail economics and cost savings to pricing, which management is deliberately holding in reserve rather than reaching for as a knee-jerk reaction. Does it add complexity and another layer of noise to management’s plate? Certainly. Is it the thesis-breaker the stock price implies? Absolutely not.
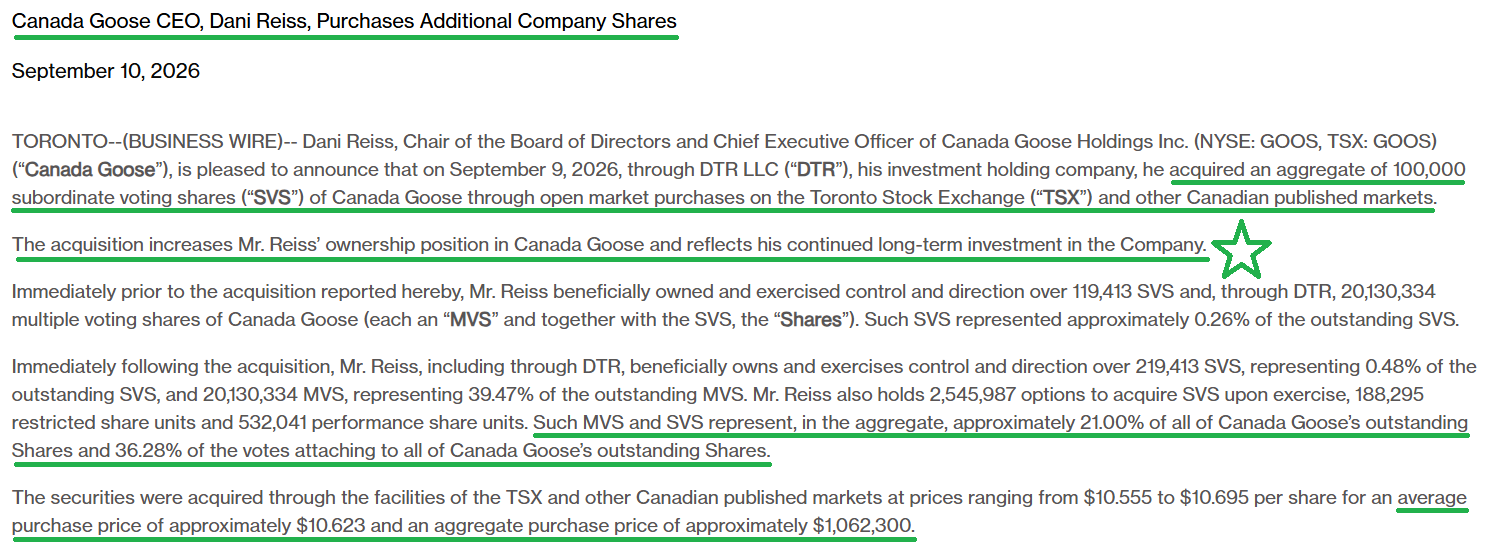
CEO Dani Reiss clearly feels the same way, using the selloff to buy another 100,000 shares on the open market at ~$10.62, a ~$1.06M purchase that brings his stake to ~21.0% of shares outstanding and ~36.3% of voting rights. This is a vote of confidence from a third-generation owner who has grown the family business from ~$2.2M in sales when he took over in 2001 to more than $1.5B today, not a trade built around a tariff headline. When the person with the most information and the most skin in the game is buying in the face of peak pessimism, that is the side we want to be on.
What Reiss is ultimately betting on is the final phase of a turnaround that has been years in the making. The GOOS story has been built in three phases: the DTC transformation that began in FY17, the evolution from a winter-only parka brand into a 365-day luxury lifestyle brand, and finally, converting that progress into EBIT margin expansion. The first two are largely proven at this point, leaving margins as the piece where we believe the stock’s next leg will come from.
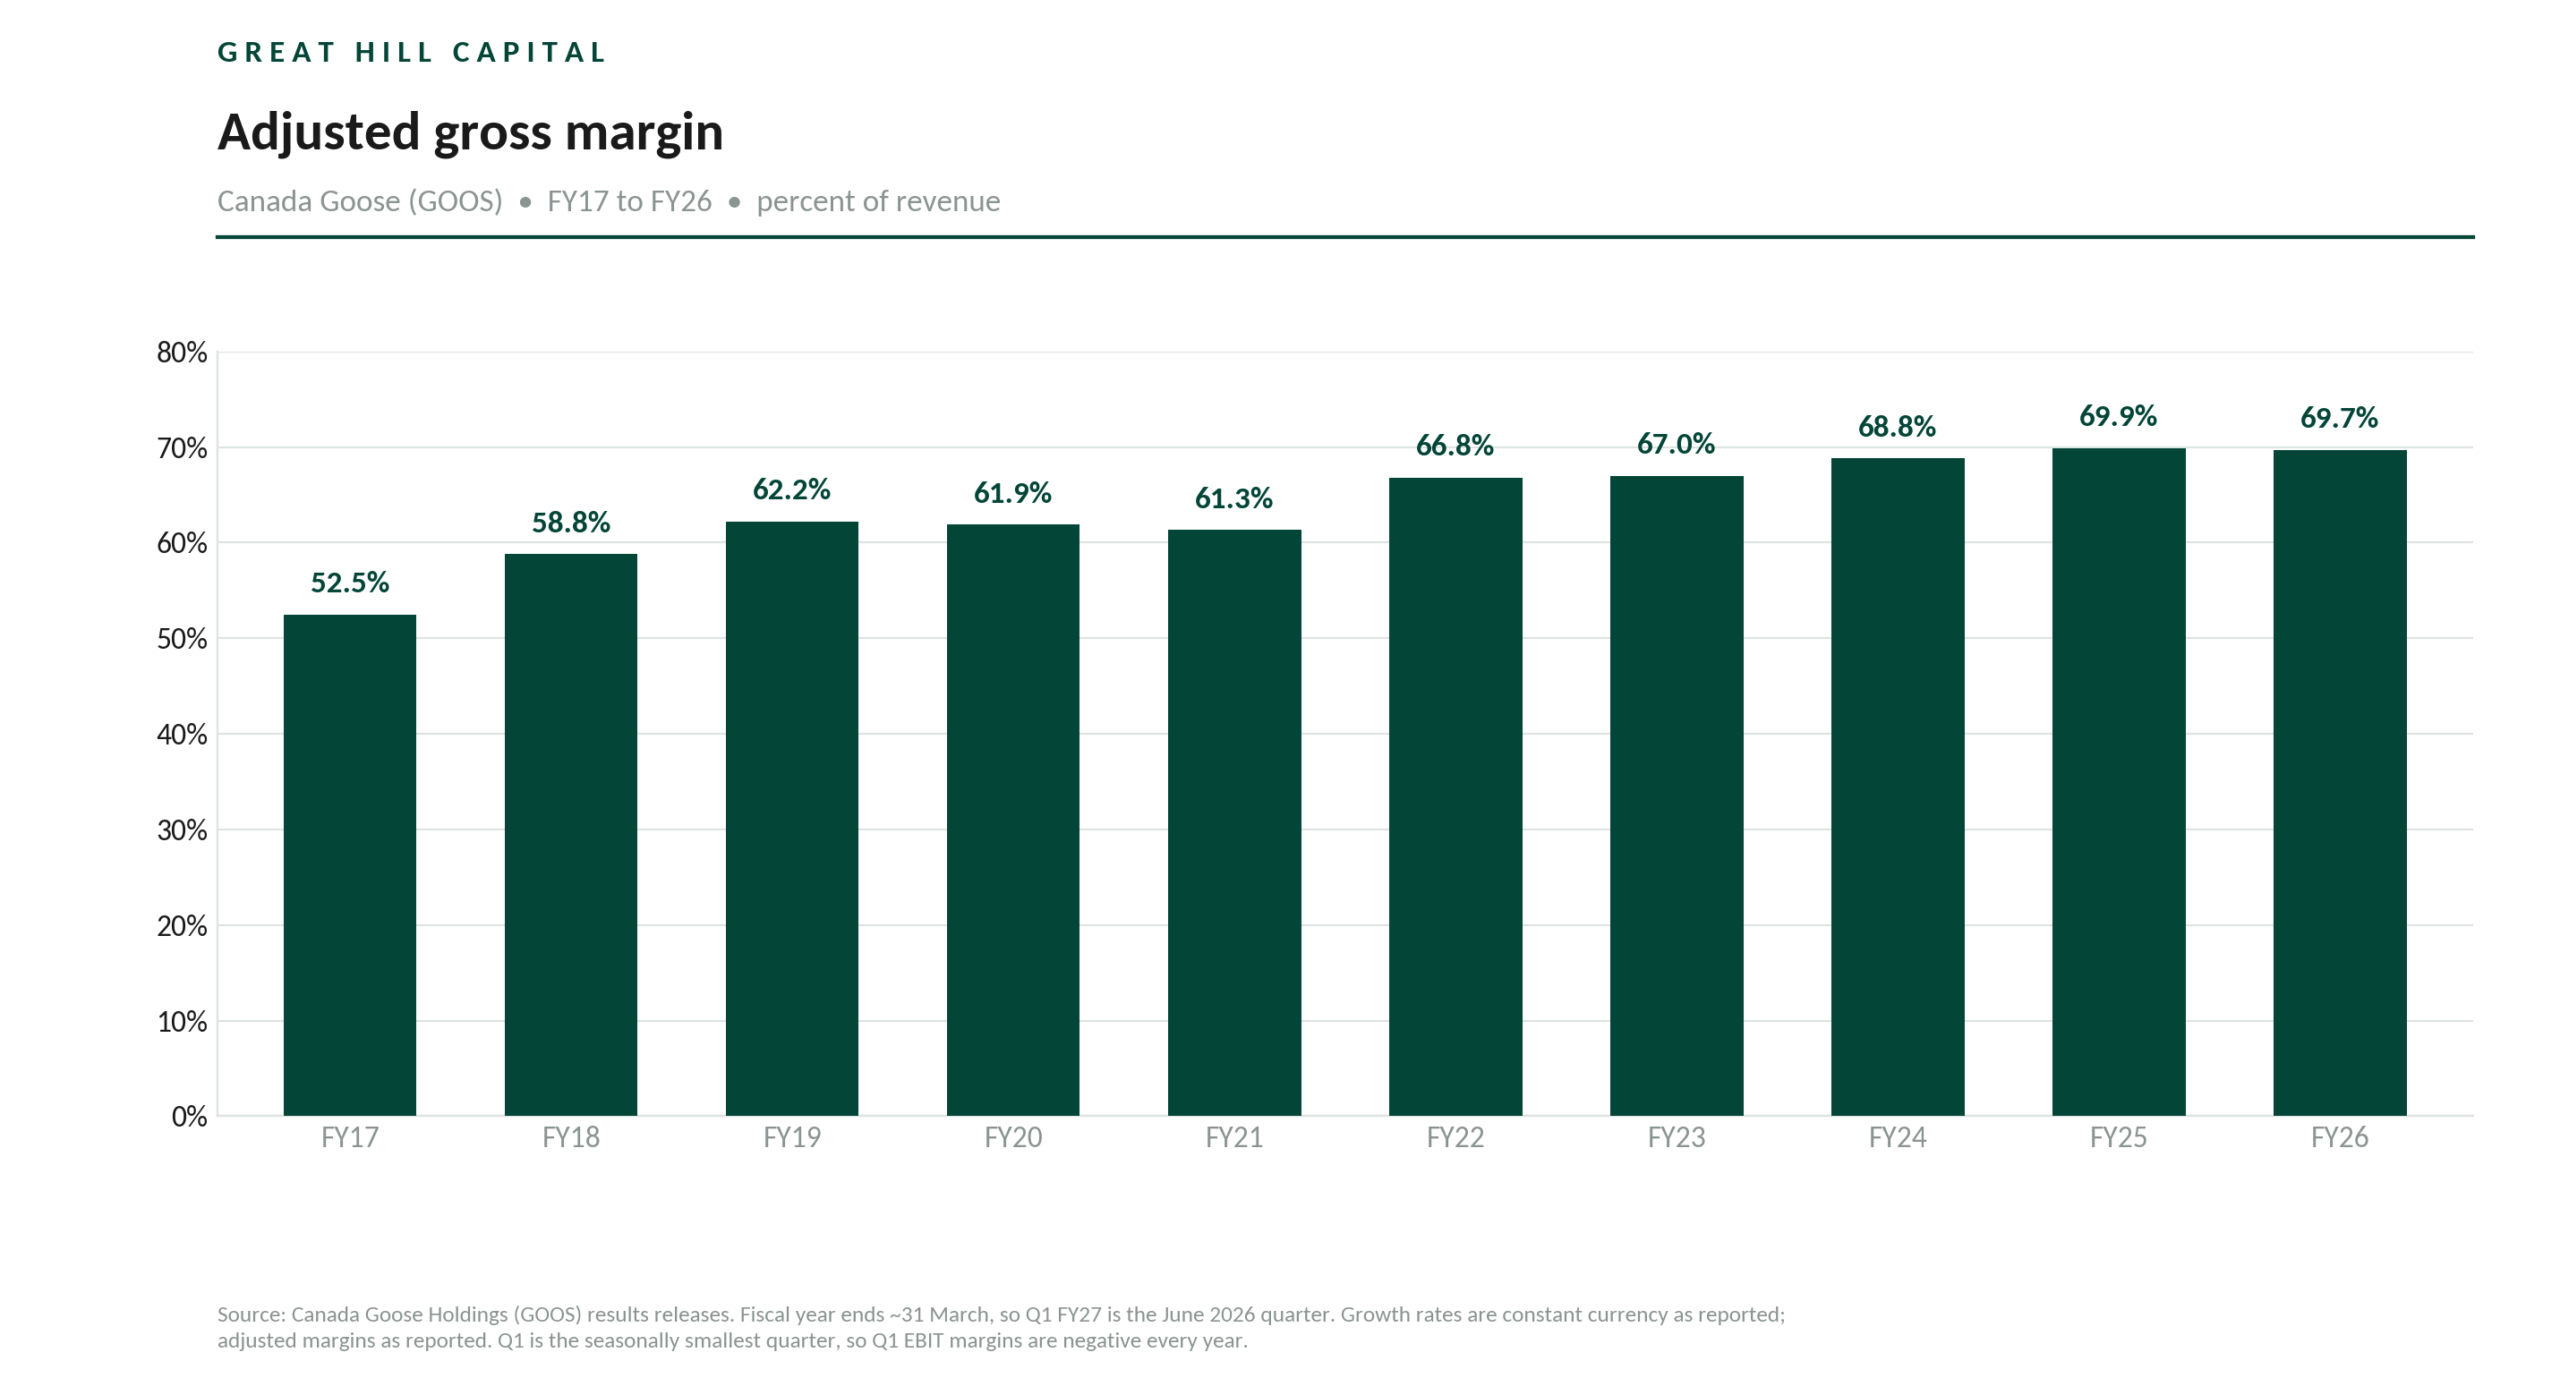
The DTC pivot has already delivered exactly what management set out to achieve. Since FY17, the channel has grown from ~29% of revenue to ~75.7% in FY26, with the permanent store fleet expanding from just two locations to 92 today. That shift brought the intended gross margin expansion along with it, lifting gross margin to 69.7% in FY26, just shy of record highs and ~17 points above FY17 levels.
The trade-off, however, was pressure on operating margins as GOOS invested heavily to build out the DTC fleet. Rent, labor, and upper-funnel marketing added to the cost base during the investment and expansion phase, a hit that was compounded when top-line growth slowed from 40%-plus rates to just 1.1% in FY25, leaving a much heavier fixed-cost base spread across stalled revenue. As a result, adjusted EBIT margin slid from a peak of 24.9% in FY19 to a trough of 9.7% in FY26, the lowest in the company’s public history.
That is why SG&A leverage, rather than further gross margin expansion, is the name of the game and the bigger margin opportunity from here. With the heavy lifting on the store buildout now behind the company, the focus shifts to driving more profit from the existing fleet, with new openings becoming more selective and each location held to a 40% four-wall EBIT margin threshold. Store productivity is already improving, with sales per square foot climbing back above management’s C$4,000 benchmark in FY26 for the first time in several years, with plenty of room to work higher as newer stores mature.
Q1 offered the first real evidence of that leverage at work. Normalized for one-time items in both periods, SG&A grew just 6% Y/Y against 10.3% revenue growth, led by a 490 bps decline in marketing as a percentage of revenue. The result was an 11.4-point improvement in adjusted EBIT margin, an encouraging start to a year in which management is guiding to ~130 to 230 bps of expansion, taking margins to 11% to 12%.
The Street, however, has just 11.0% penciled in for FY27 and only 11.3% for FY28, effectively taking the under on any margin recovery beyond this year. Meanwhile, management sees no structural reason margins cannot work back toward historical levels. More likely than not, the two sides will meet somewhere in the middle.
Revenue growth makes that margin recovery a lot easier to achieve, which brings us back to the 3.2% decline in DTC comp sales.
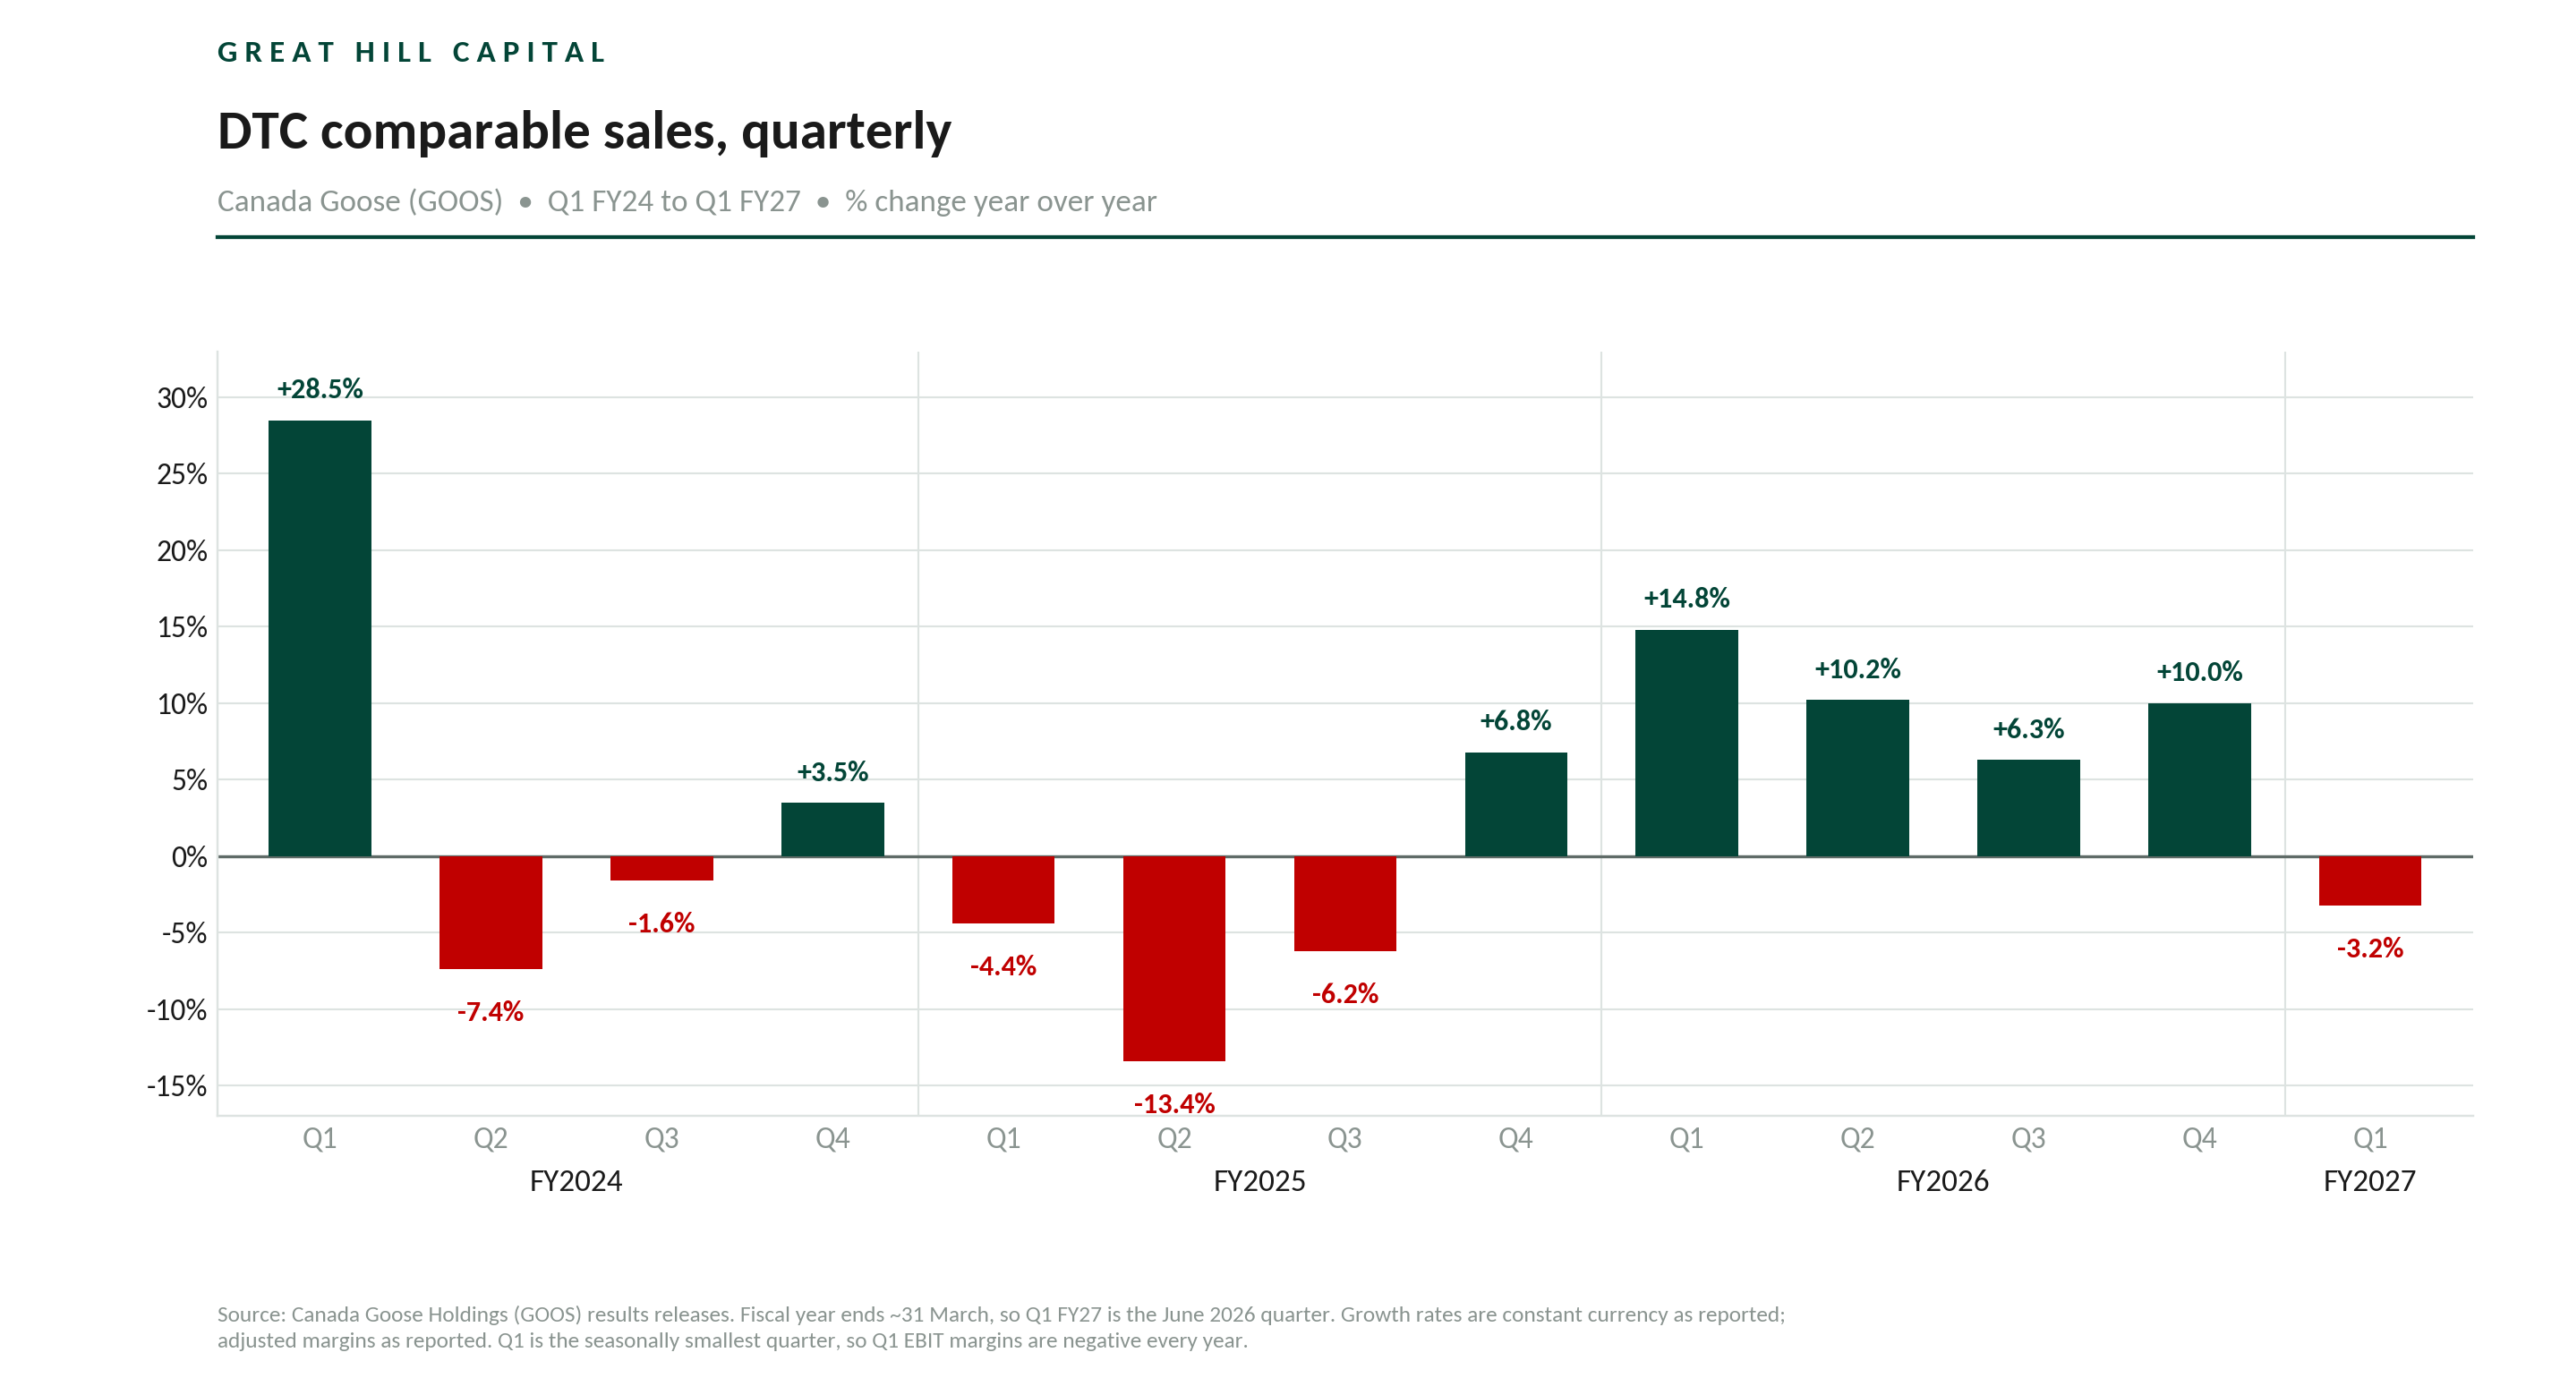
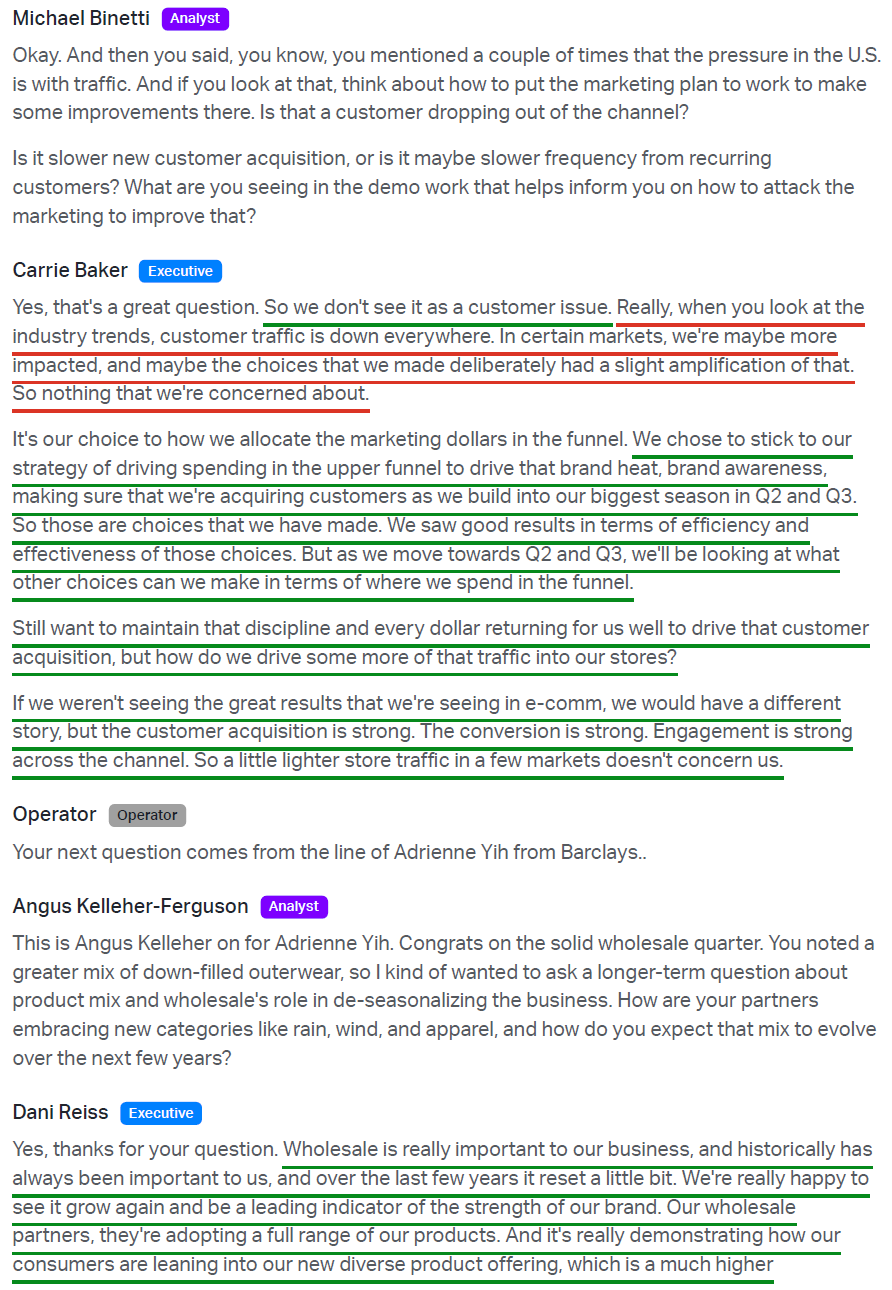
Management was clear that the softness came from lower store traffic rather than weaker demand. The rest of the quarter supports that view, with e-commerce growing double digits across every region while store conversion, basket sizes, and new customer acquisition all improved. Wholesale revenue also jumped 66.5% to $29.8M as partners increased their orders. This pressure on store traffic was certainly not unique to Canada Goose, with luxury retailers across the industry feeling the same pain. Management is responding by stepping up marketing investment heading into peak season to bring more customers back into its stores.
Beyond store traffic, the bigger top-line story is what customers are buying when they are in the stores. Apparel, rainwear, and windwear reached nearly 40% of Q1 revenue, generating as much in a single quarter as the entire company did in the first quarter eight years ago. Non-down products like knitwear, T-shirts, and polos now account for ~50% of unit sales, with down-filled outerwear still growing alongside them, making the expansion additive rather than a drag on the core.
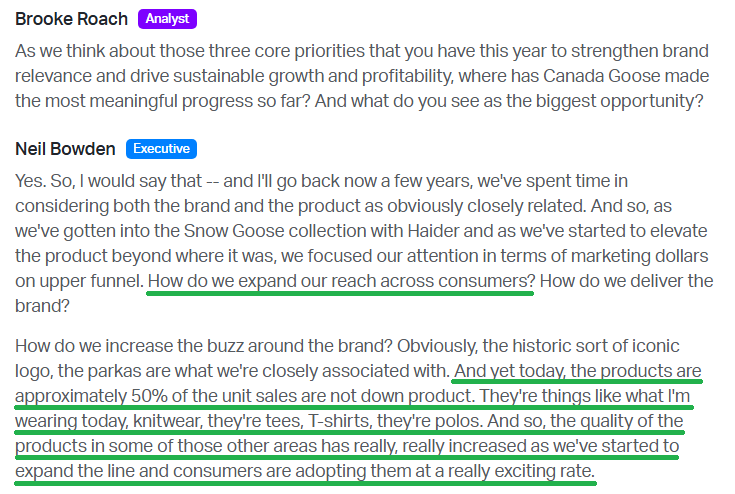
Source: Goldman Sachs (GS) Global Consumer and Retail Conference
In our view, this remains the most overlooked growth opportunity for Canada Goose, as each new category gives existing customers a reason to come back outside of winter while drawing in new customers who may never have considered a $1,000+ parka. Over time, that creates a more stable, four-season brand that drives sales year-round and gives the business a larger revenue base to leverage its fixed cost structure.
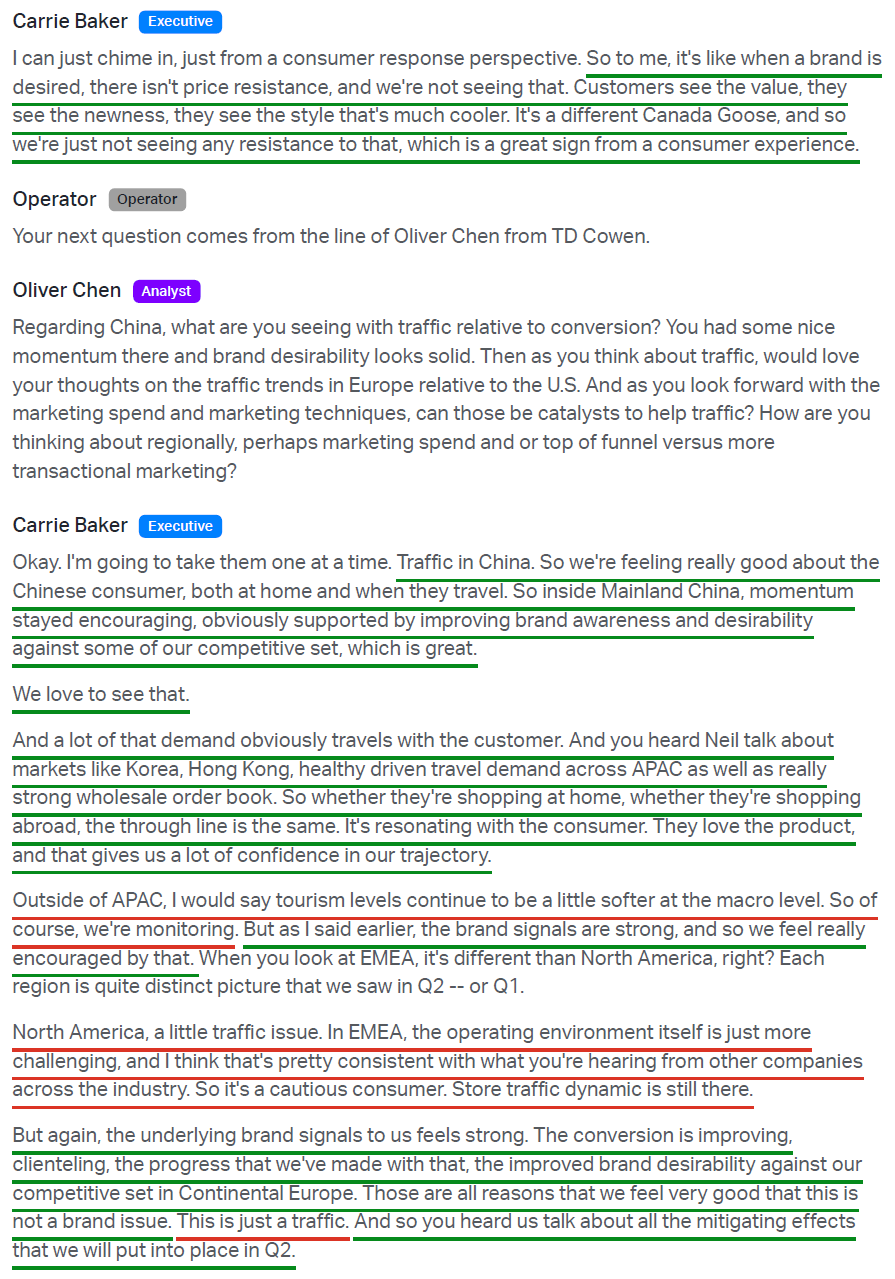
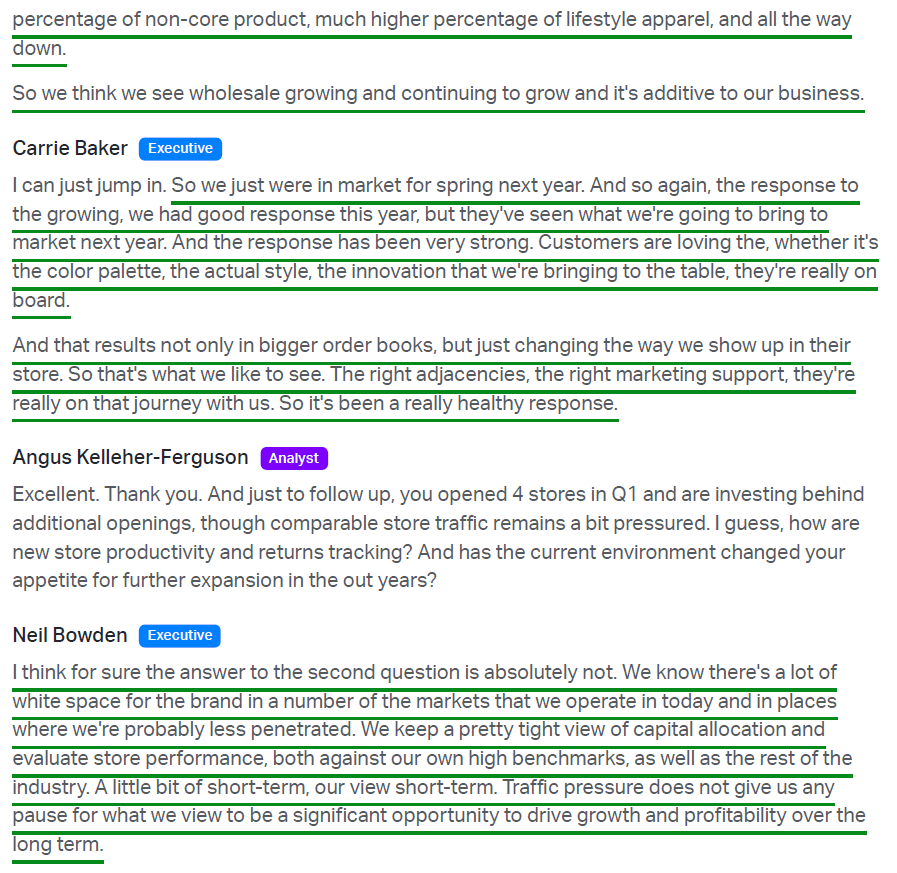
Then there is the China recovery, which is starting to show up in a big way. Greater China, Canada Goose’s #1 market at 31.6% of sales, grew 44.2% in the quarter, helping drive APAC to its sixth straight quarter of double-digit growth. Strength also extended to wholesale partners on Hainan Island and in Korea, pointing to the same rebound in travel retail that Estée Lauder (EL)’s results also spoke to.
You would never know any of this from the stock, which trades at just over 9x NTM earnings, compared to a ~26x median since going public and ~17x over the past five years, a period that already reflected a slower growth profile. We don’t expect that disconnect to last much longer, with even a partial recovery from the FY26 margin trough unlocking significant earnings power that has yet to be priced in.
Mr. Market may be bracing for a long, cold winter at Canada Goose, but between the margin inflection now underway and a CEO writing seven-figure checks, we’re betting on a change of seasons.
Q1 Earnings Breakdown
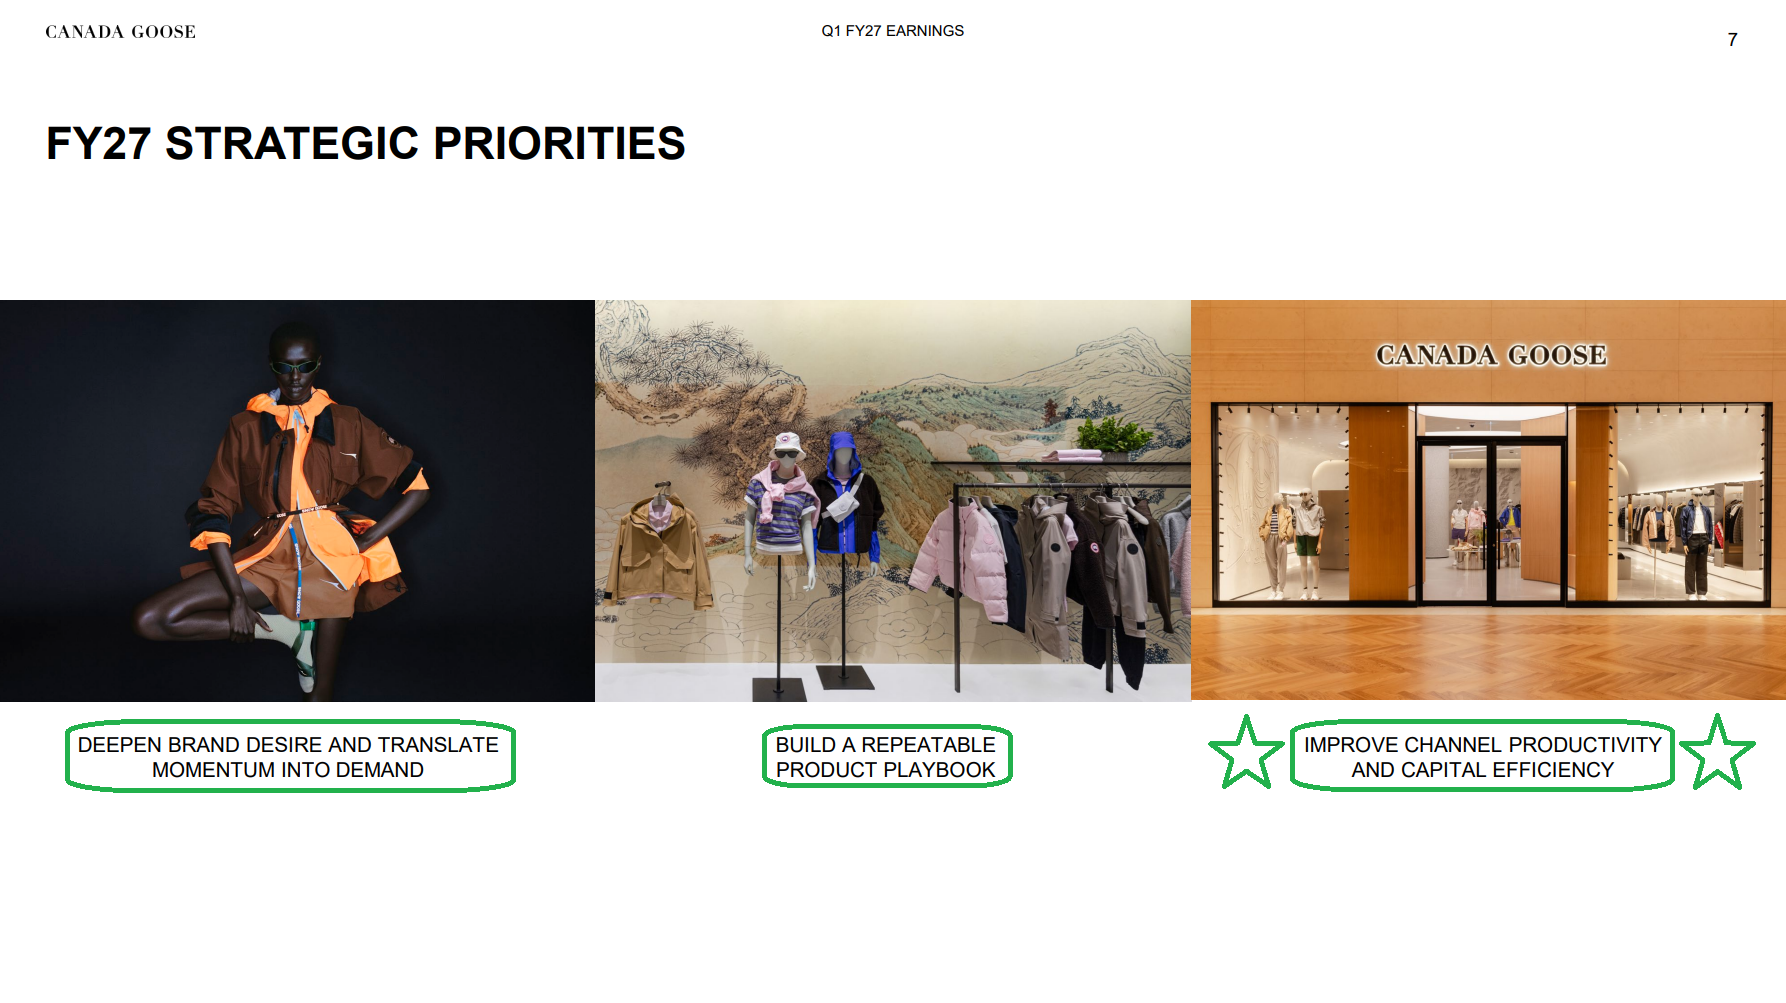
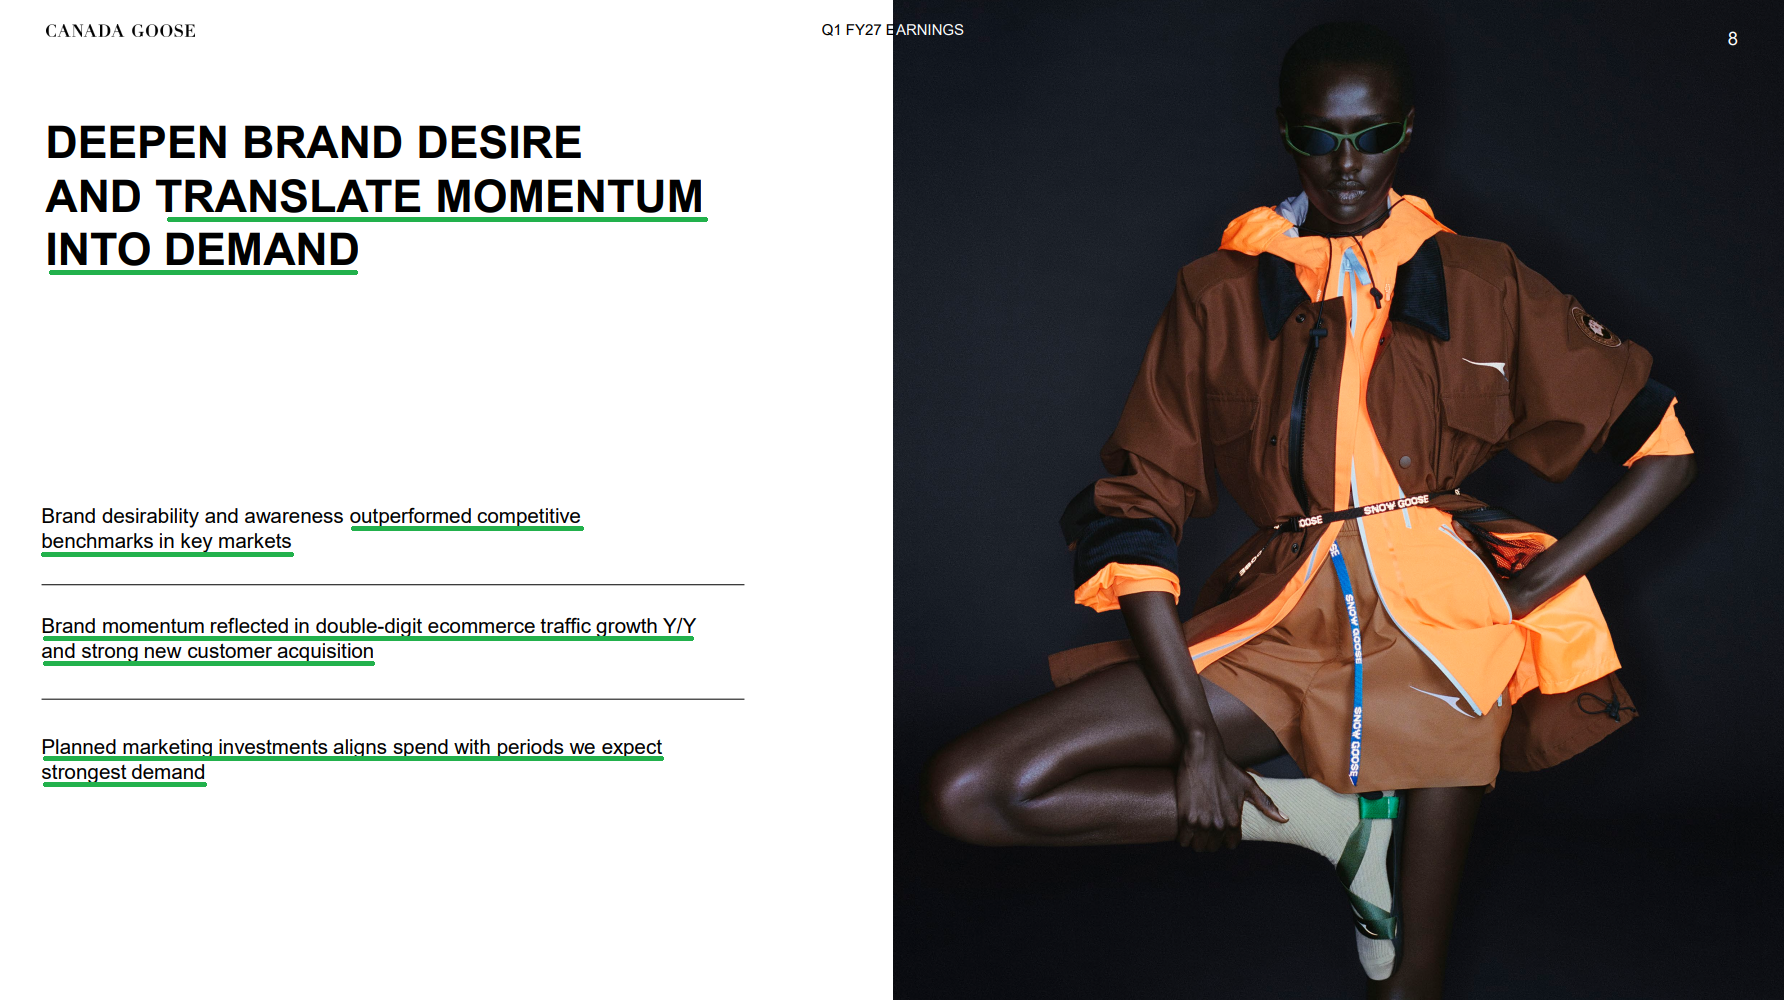
10 Key Points
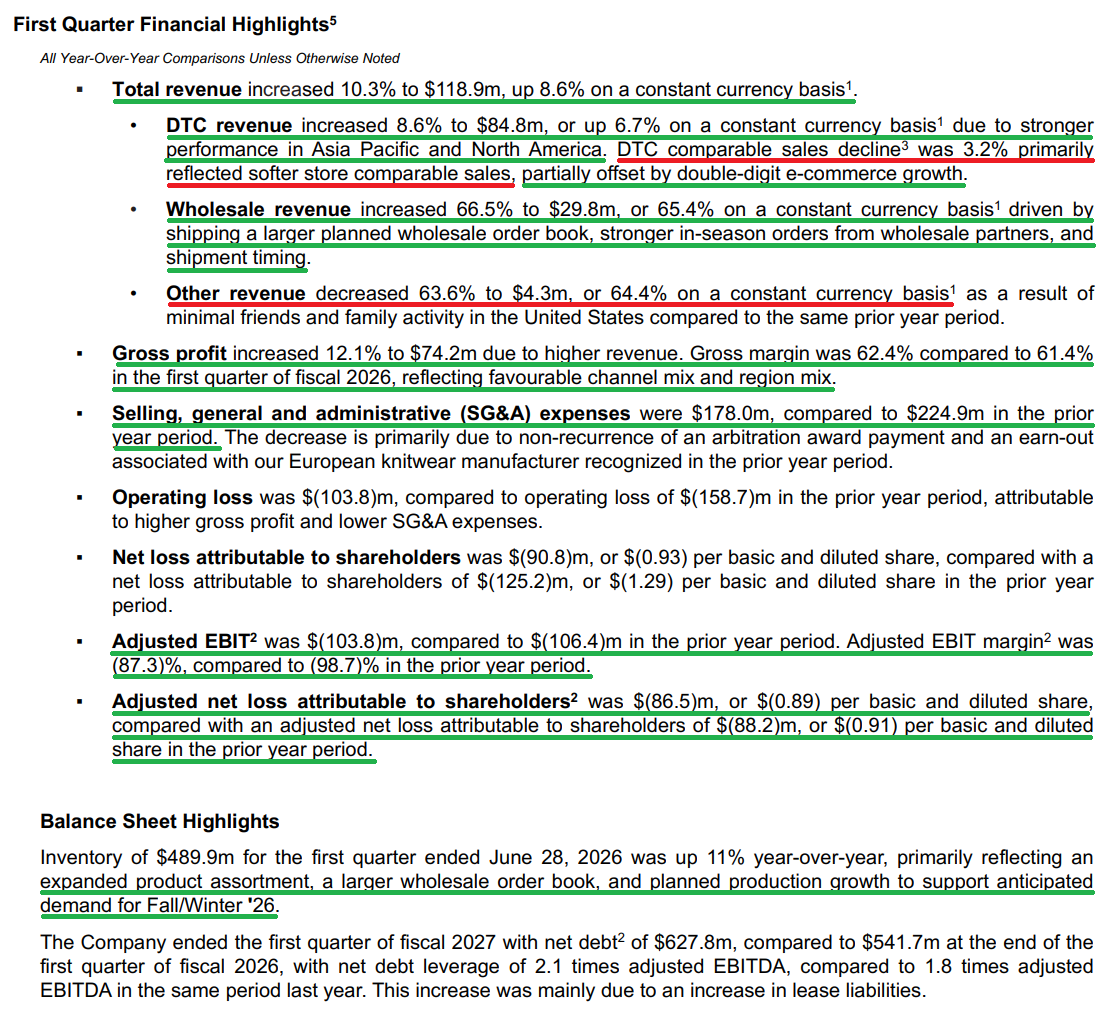
1) Canada Goose reported Q1 revenue growth of +10.3% Y/Y (+8.6% C$) to $118.9M, ahead of consensus of $108.8M. Growth was driven by DTC and wholesale, partially offset by a 63.6% decline in other revenue to $4.3M on minimal Friends & Family activity, with total revenue up 16% Y/Y excluding other revenue. Asia Pacific led at +37.4% (+34.6% C$) to $53.6M, with Greater China up +44.2% (+39.6% C$) to $37.5M, while Canada grew +10.7% to $27.0M. The U.S. declined 19.0% (-20.4% C$) to $21.8M on the Friends & Family pullback and softer store traffic, with EMEA down 5.7% (-7.4% C$) to $16.5M as a tougher macro backdrop weighed on store sales.
2) Adjusted net loss narrowed to $(86.5)M, or $(0.89) per share, from $(88.2)M, or $(0.91) per share, in the prior-year period, ahead of consensus for a $(0.96) loss. Q1 is seasonally a loss quarter for Canada Goose given its winter-weighted revenue base.
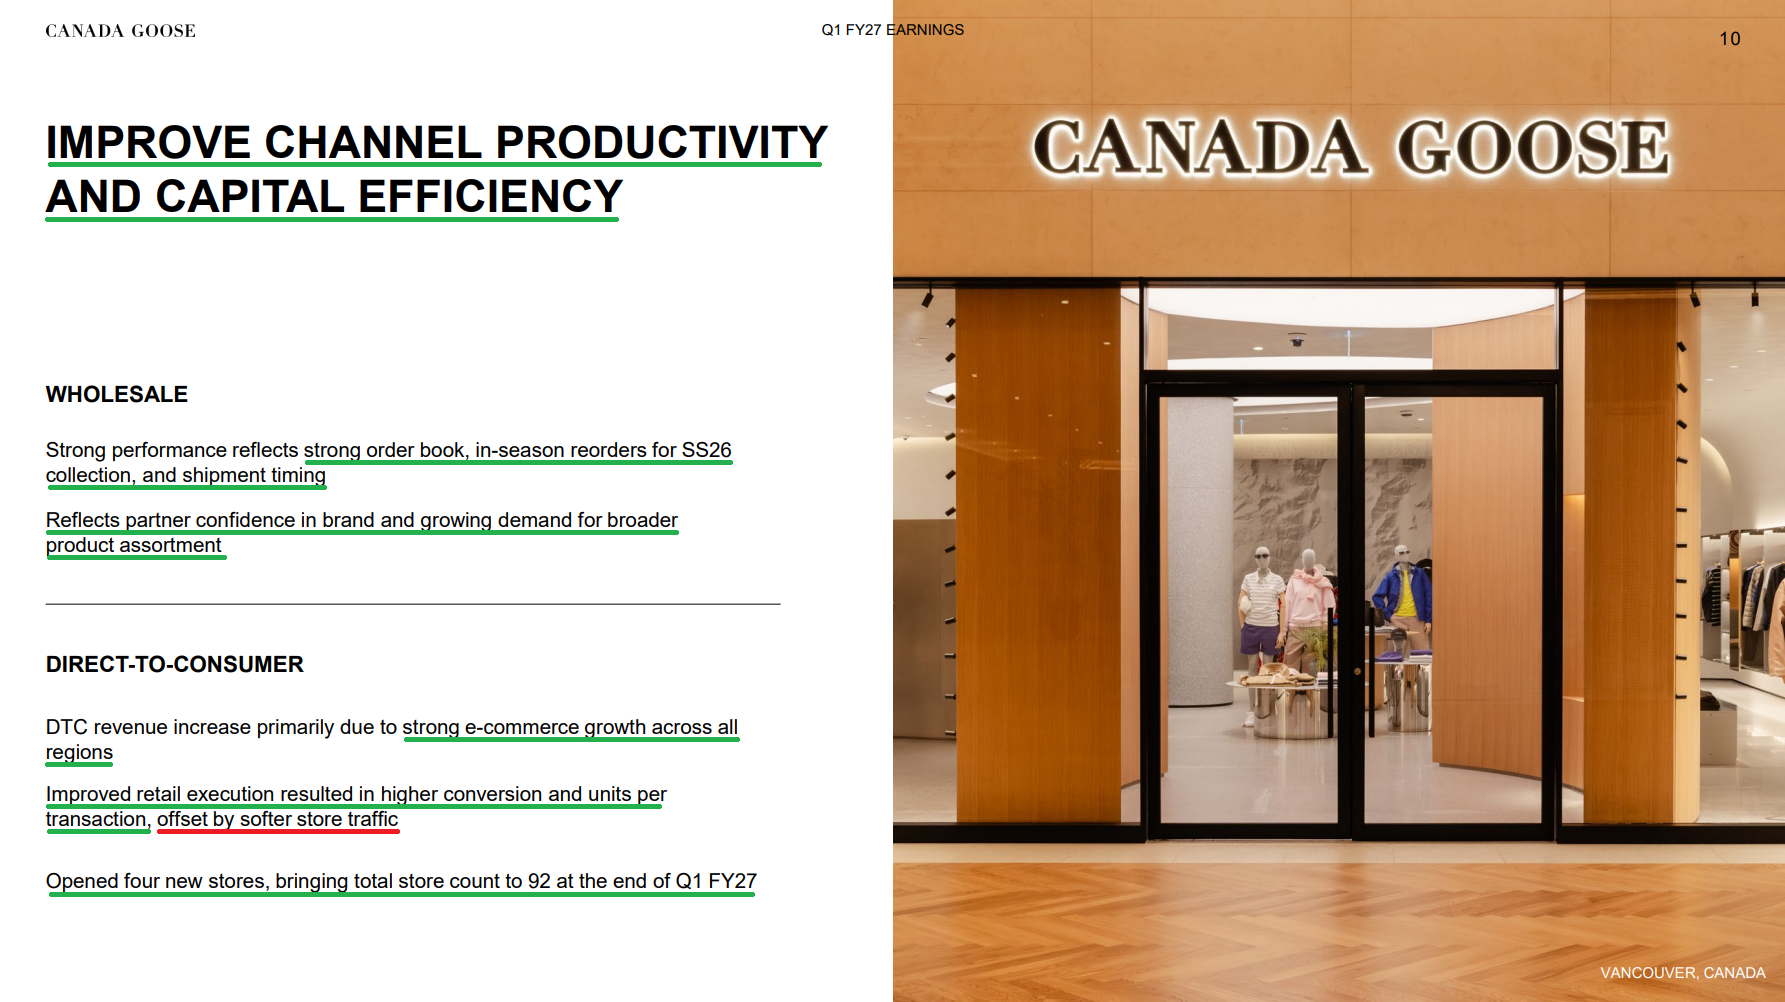
3) DTC revenue grew +8.6% (+6.7% C$) to $84.8M, accounting for ~71% of quarterly sales, led by APAC and North America. DTC comparable sales declined 3.2%, decelerating from +10% in Q4 and lapping a +14.8% comp last year, as softer store traffic offset double-digit e-commerce growth across all regions. Retail execution improved, with higher conversion, average order value, and units per transaction alongside strong new customer acquisition. By region, North America comps declined 1% as improved conversion was offset by softer traffic, with EMEA posting the steepest decline on challenging macro conditions. Canada Goose opened four net new stores during the quarter, bringing the permanent store count to 92, with management planning to step up marketing investment through Q2 and Q3 to drive store traffic heading into peak season.
4) Wholesale revenue increased +66.5% (+65.4% C$) to $29.8M from $17.9M, accounting for ~25% of quarterly sales, driven by a larger planned order book, stronger in-season reorders for the Spring/Summer ’26 collection, and shipment timing. Growth was broad-based, with double-digit wholesale gains in North America and strength in EMEA, as partners adopted the full range of the expanded assortment beyond core outerwear. Wholesale channel margin also expanded, with early Q2 demand tracking in line with expectations and a strong partner response to the Spring/Summer ’27 order book supporting another year of wholesale growth in FY27.
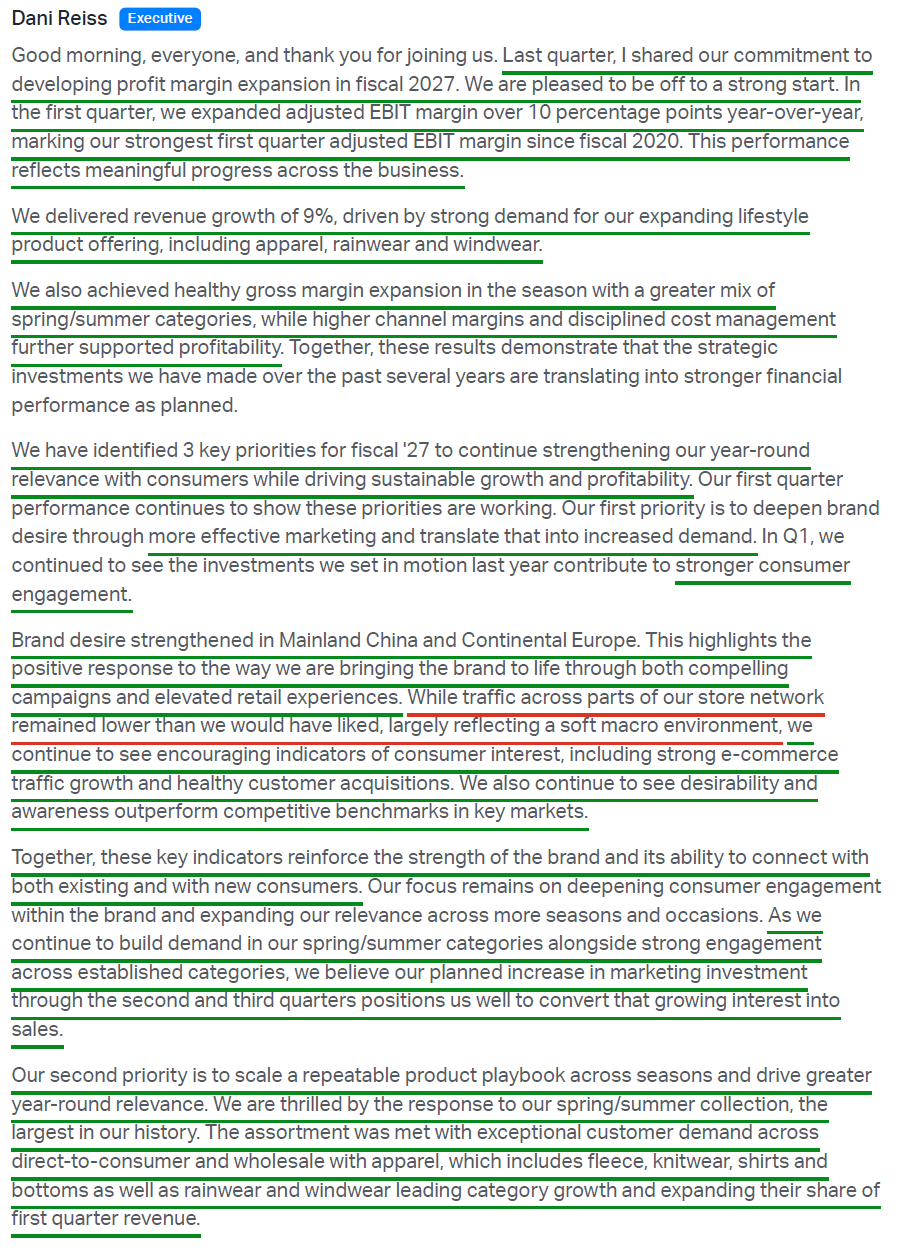
5) Canada Goose’s push to become an all-season, 365-day relevant brand continued to gain traction with its largest-ever Spring/Summer collection, which saw strong demand across both DTC and wholesale. Apparel (fleece, knitwear, shirts, and bottoms), rainwear, and windwear led category growth, expanding to nearly 40% of Q1 revenue and generating as much revenue in the quarter as the entire company did in Q1 FY19. On a full-year basis, these categories have grown from just 5% of revenue in FY22 to 15% in FY26. The growth was additive rather than cannibalizing the core, with down-filled outerwear also growing in the quarter.
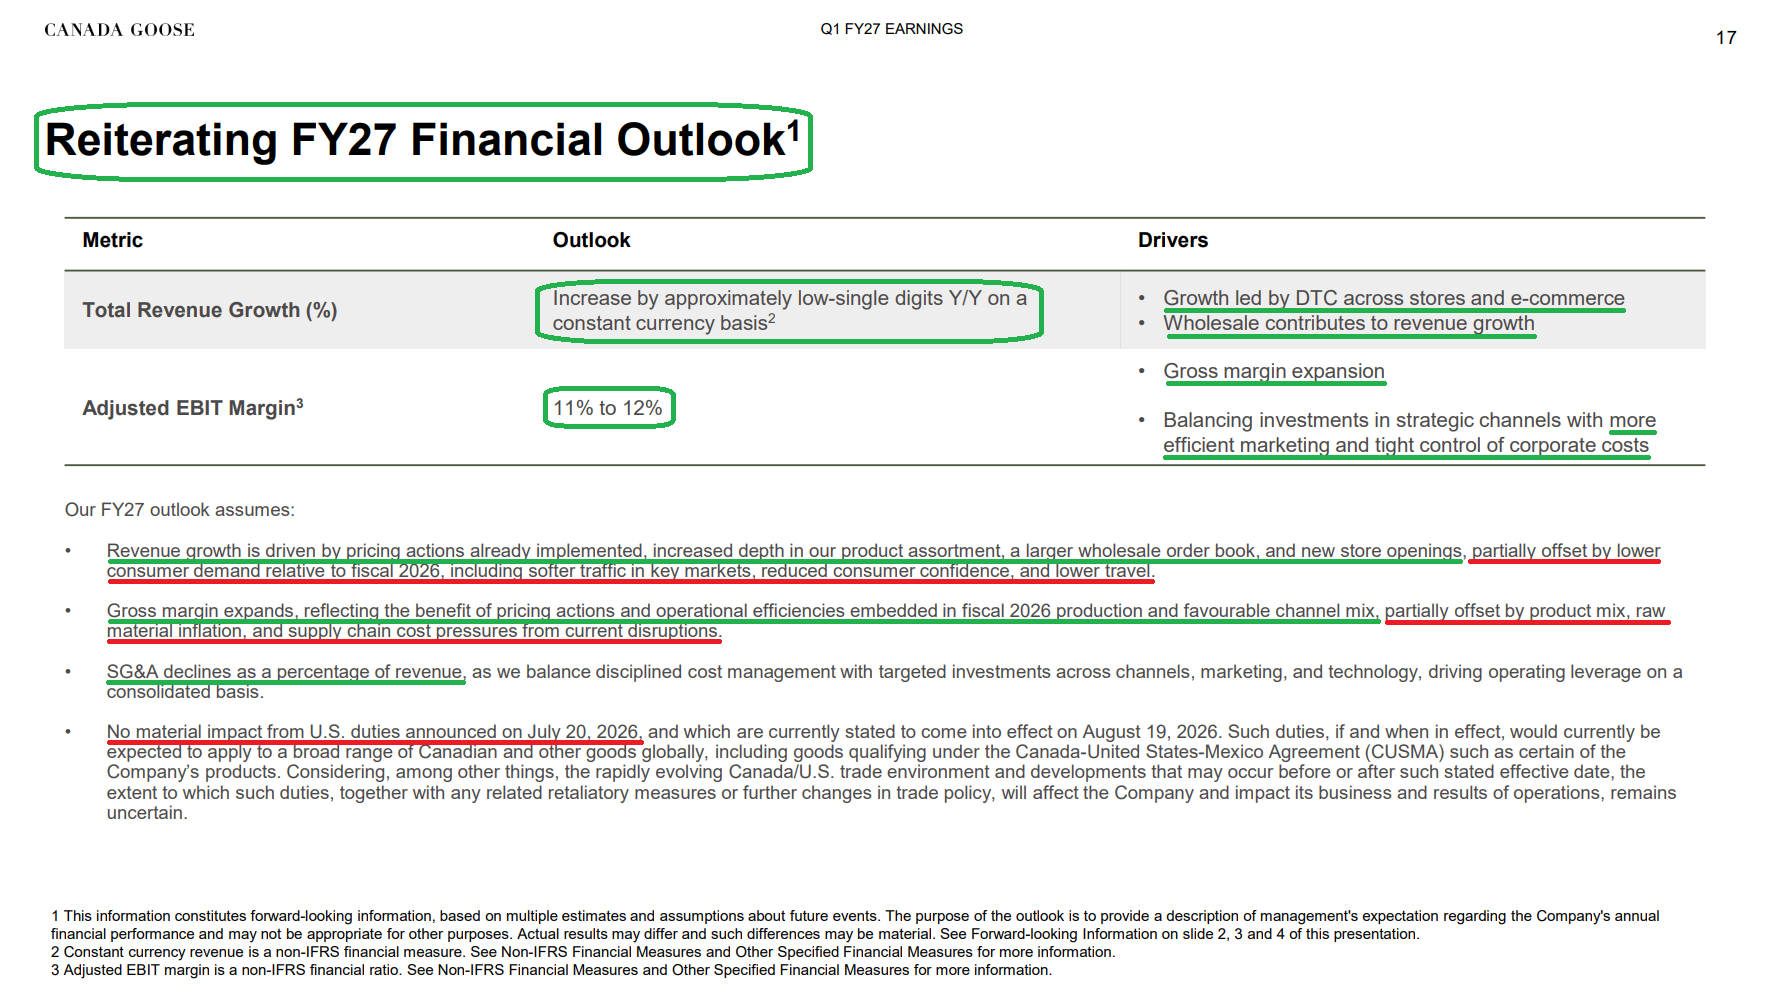
6) Gross profit increased +12.1% to $74.2M, with gross margin expanding 100 bps Y/Y to 62.4% on favorable channel and regional mix. The mid-single-digit price increase implemented at the start of the year offset modest cost inflation, with management seeing no price resistance from consumers. For FY27, management expects gross margin expansion from pricing, operational efficiencies, and favorable channel mix, partially offset by product mix, raw material inflation, and supply chain cost pressures.
7) Adjusted EBIT loss narrowed to $(103.8)M from $(106.4)M, with adjusted EBIT margin improving 11.4 percentage points to (87.3)% from (98.7)%, the strongest first-quarter margin since FY2020. Normalized for one-time items in both periods, SG&A grew 6% Y/Y, well below revenue growth, driven by a 490 bps decline in marketing as a percentage of revenue, operating leverage across DTC and wholesale, and well-managed corporate expenses. Both DTC and wholesale channel margins expanded despite continued investment in upcoming store openings and the EMEA logistics network.
8) Management estimates the new 50% U.S. duties on Canadian goods, which cover a portion of Canada Goose’s products, would reduce FY27 operating margin by less than 200 bps before mitigation. The company is actively evaluating a range of mitigation measures, citing its track record of managing tariff and trade changes while still materially expanding gross margin. The FY27 outlook assumes no material impact from the duties.
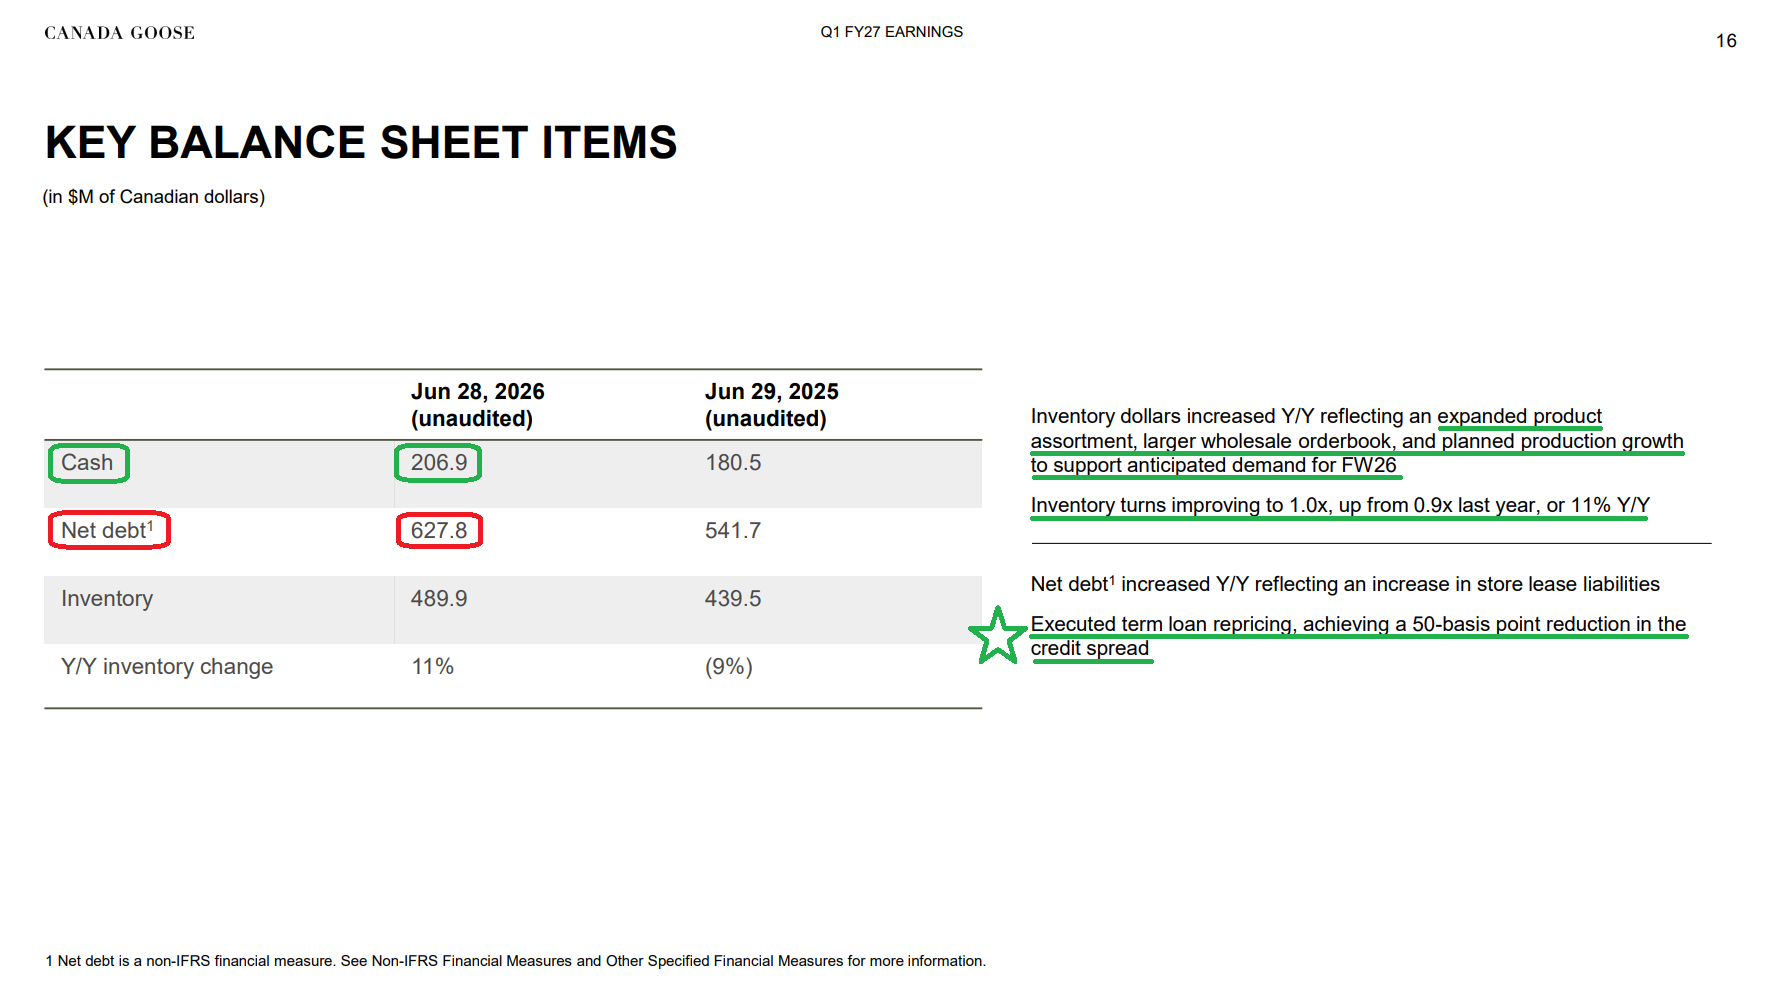
9) Inventory increased 11% Y/Y to $489.9M, driven by an expanded product assortment, a larger wholesale order book, and planned production growth ahead of Fall/Winter ’26. Inventory turns still improved to 1.0x from 0.9x, up 11% Y/Y and 25% versus two years ago. Cash rose to $206.9M from $180.5M, while net debt increased to $627.8M from $541.7M, lifting net debt leverage to 2.1x adjusted EBITDA from 1.8x, primarily on higher store lease liabilities. Management also repriced its term loan late in the quarter, securing a 50 bps reduction in the credit spread.
10) Management reiterated its FY27 outlook for low-single-digit revenue growth on a constant-currency basis and adjusted EBIT margin of 11% to 12%, representing ~130 to 230 bps of expansion from the FY26 base of 9.7%. Following a stronger-than-expected start, first-half growth is expected to moderate from Q1’s pace, with early Q2 store traffic consistent with Q1, e-commerce remaining strong, and wholesale demand tracking in line. Stepped-up marketing in Q2 and Q3, alongside EMEA logistics and e-commerce investments, should modestly pressure H1 margins, with H2 expansion driven by cost leverage and the non-recurrence of FY26’s U.S. wholesale bad debt and store impairment charges. As is typical, ~75% of annual revenue and effectively all of the company’s profit are generated in the back half.
Earnings Call Highlights
Estée Lauder Update
For newer readers, here’s a quick overview of the key drivers behind our thesis on Estée Lauder, a leader in global prestige beauty that is now inflecting back to growth following a cyclical slowdown, with meaningful operating leverage still to come:
Company Overview
Founded in 1946 by Estée and Joseph Lauder. Portfolio of 25+ premium brands including Estée Lauder, Clinique, La Mer, M·A·C, TOM FORD, Jo Malone, The Ordinary, and Le Labo.
Six $1B+ brands (Clinique, Estée Lauder, La Mer, M.A.C, plus Jo Malone London and TOM FORD, which joined in FY26).
The #2 player in the ~$160B global prestige beauty market, well-positioned for the premiumization trend.
~$15.0B in annual revenue (FY26).
Category mix: skin care 49% of sales (highest margins, >70% of operating income), makeup 29%, fragrance 17%, hair care 4%.
~70% of sales outside the Americas (key beneficiary from a weaker U.S. dollar). Mainland China >20% of sales (largest single country, highly skincare-exposed).
Management
CEO Stéphane de La Faverie (effective January 1, 2025). A 25+ year company veteran who led the Estée Lauder brand and the PRGP turnaround.
First time in company history with no Lauder family member in an executive position or daily operations. CEO search family drama now resolved. The Lauder family retains ~38% equity ownership and ~82% voting power, committed long-term as shareholders.
What Happened
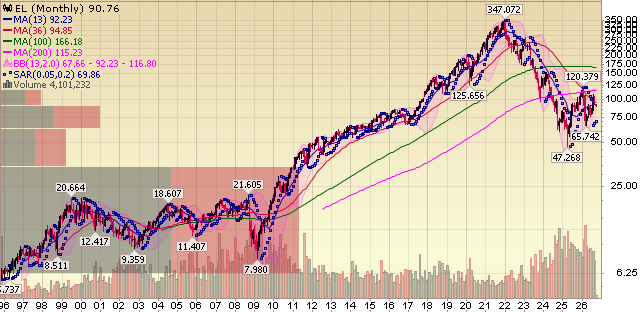
Multiyear challenges FY2022-2025: three consecutive sales declines, EPS down ~80% from FY2022 peak ($7.24 to $1.51 trough), stock fell >85% from ~$350 highs to <$50 lows.
Primarily driven by China/Asia macro weakness with over-indexed exposure. China revenue share rose from 13% in FY2018 to a 36% peak in FY2021. Travel retail climbed from 18% to a 28% peak over the same period.
Over-expansion and oversaturation drove inventory up 84% from FY2018-2023 to ~$3B. Heavy discounting and write-downs pressured gross margins (~500 bps peak-to-trough to 71.7% in FY2024).
China’s weakness was largely cyclical. EL maintained prestige market share throughout the downturn. Asia travel retail destocking was the single biggest earnings drag.
Now cleaned up: China ~20% of revenues (down from 36% peak), travel retail ~15% (down from 28% peak), and inventory at a healthy $2.0B (~-35% from peak).
Cost Cuts + Margin Expansion
PRGP (launched 2023) + Beauty Reimagined driving transformation: net workforce reduction of ~10,000 positions, with 70%+ of the reduction tied to point-of-sale roles in unproductive department stores and freestanding doors. Restructuring approvals concluded as of June 30, 2026, driving a 50% increase in productivity across corporate-function employees.
Restructuring charges slightly above the high end of $1.5-1.7B, mostly employee-related.
Annual gross savings of $1.0-1.2B by FY2027 via procurement, overhead cuts, and supply chain optimization. Non-consumer-facing expenses held flat for the full year (down in every quarter except Q4 on higher incentive costs), funding a +7% increase in consumer-facing investment for FY26 (+4% ex-FX).
The vast majority of PRGP run-rate benefits are still expected in FY27, with full annualization in FY28.
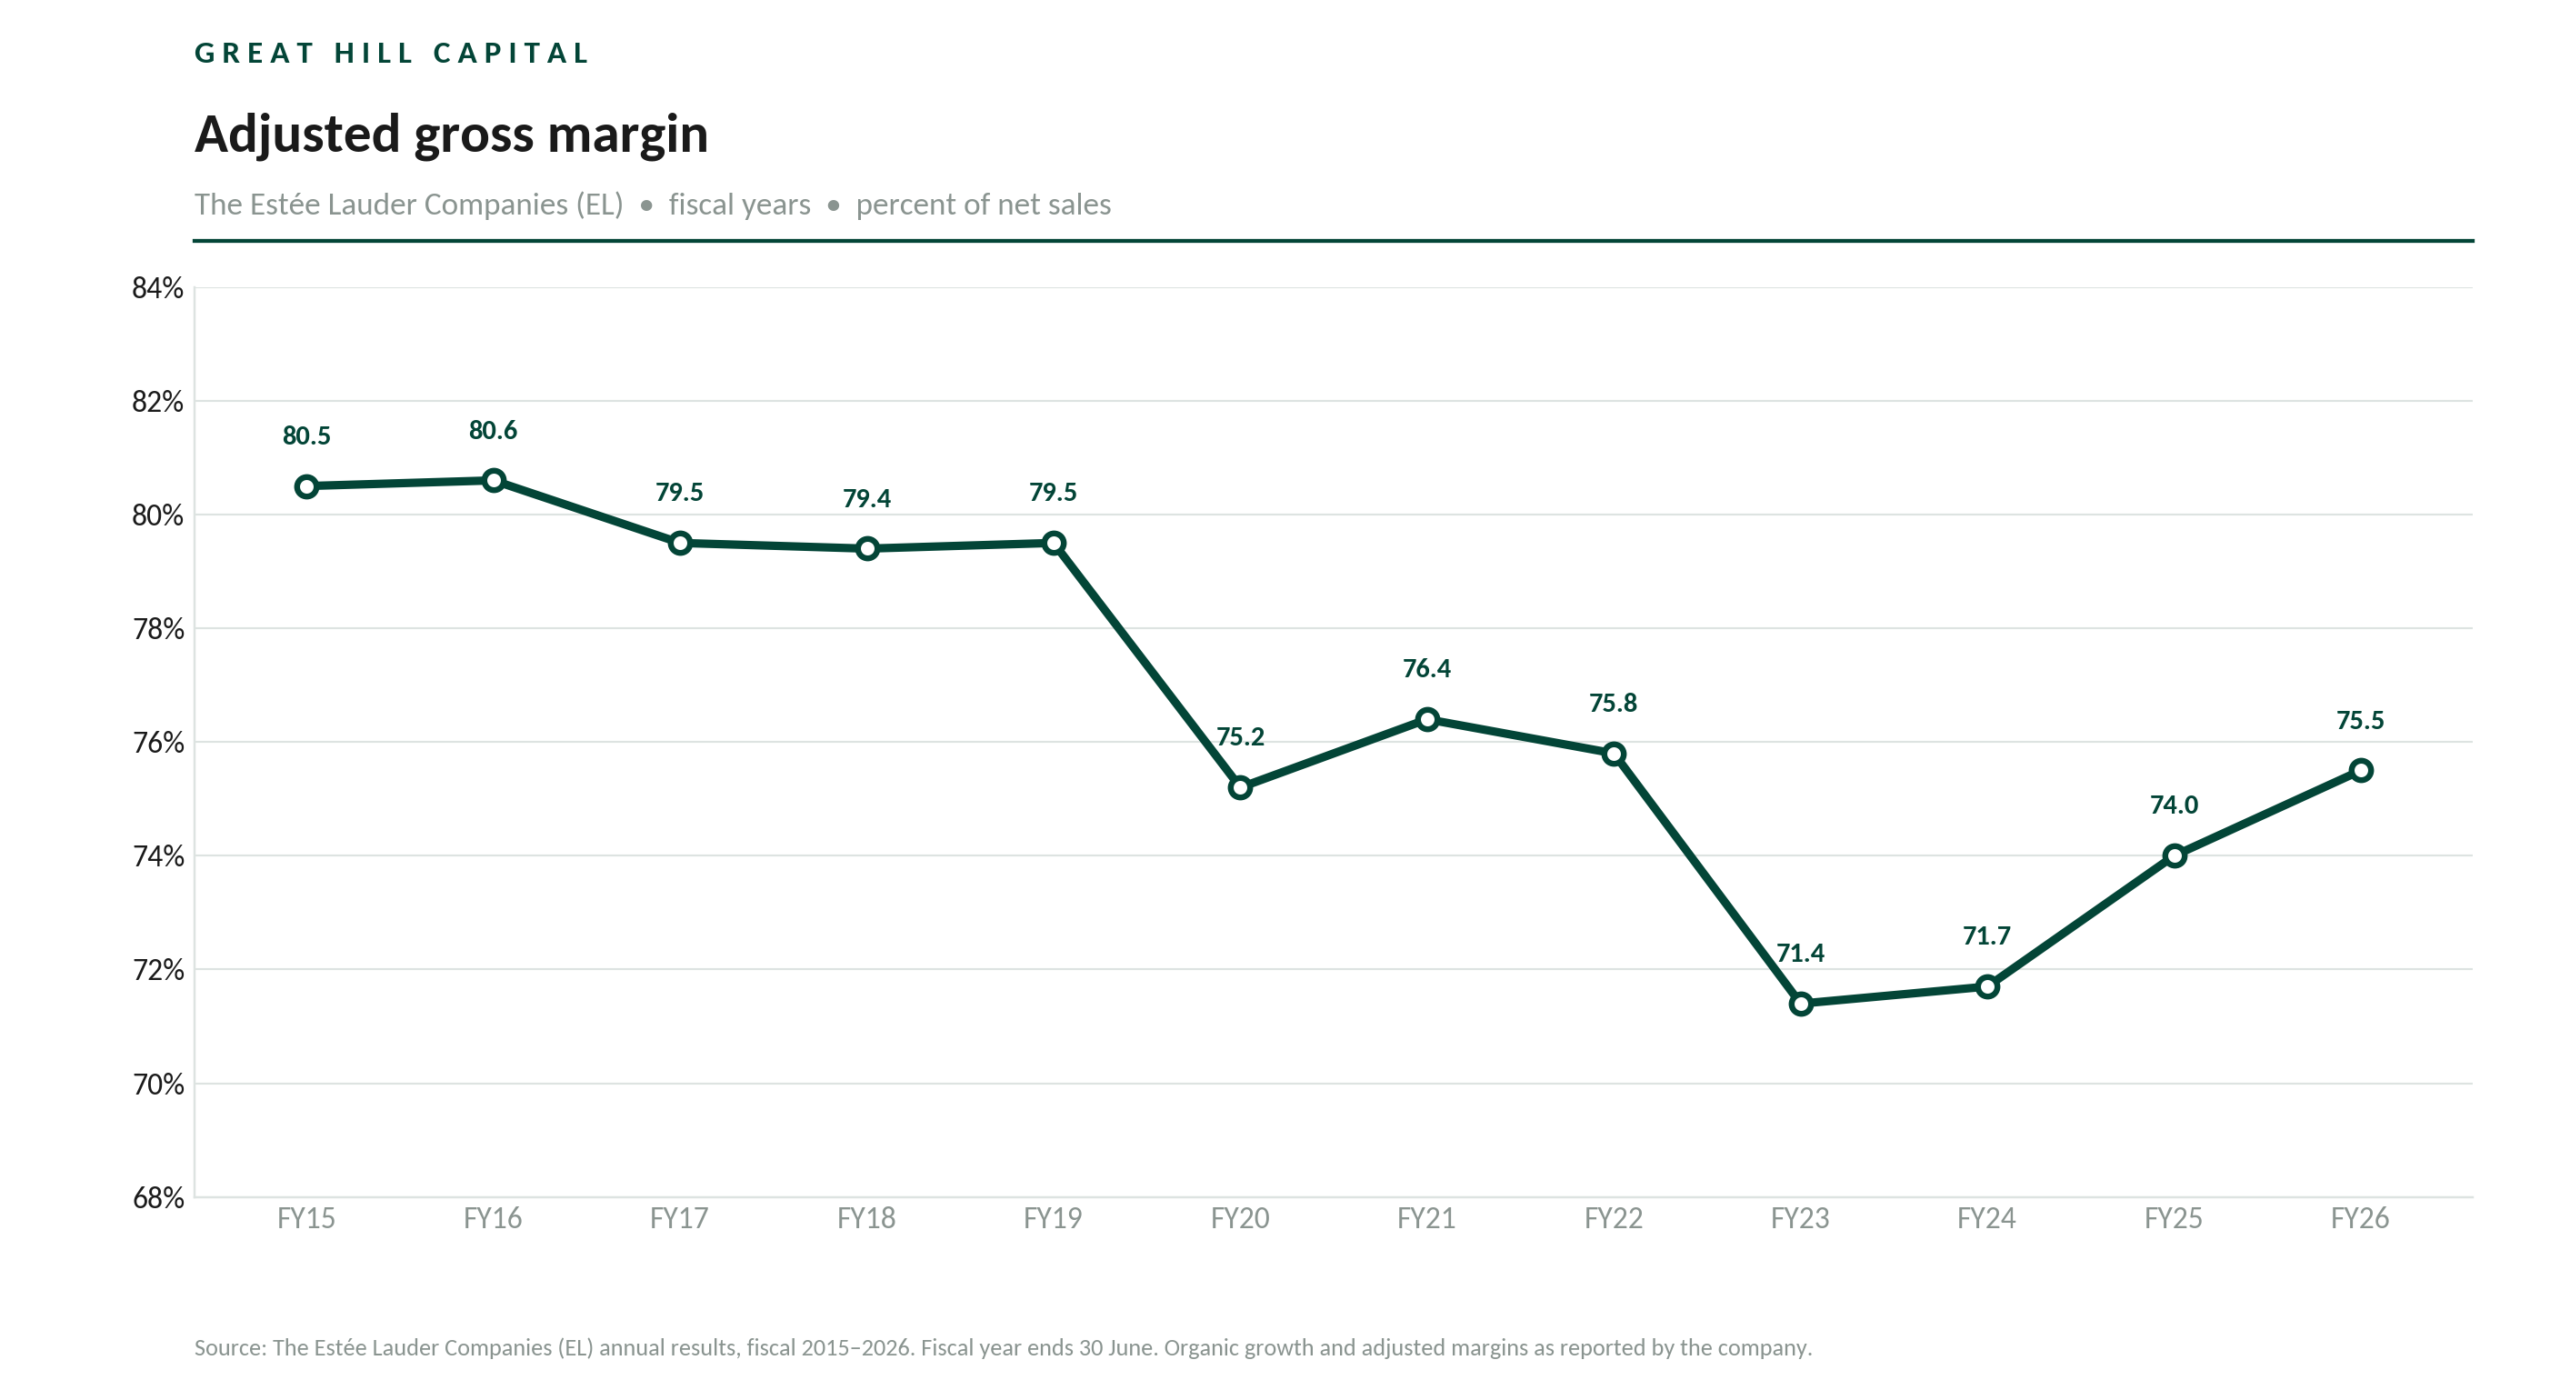
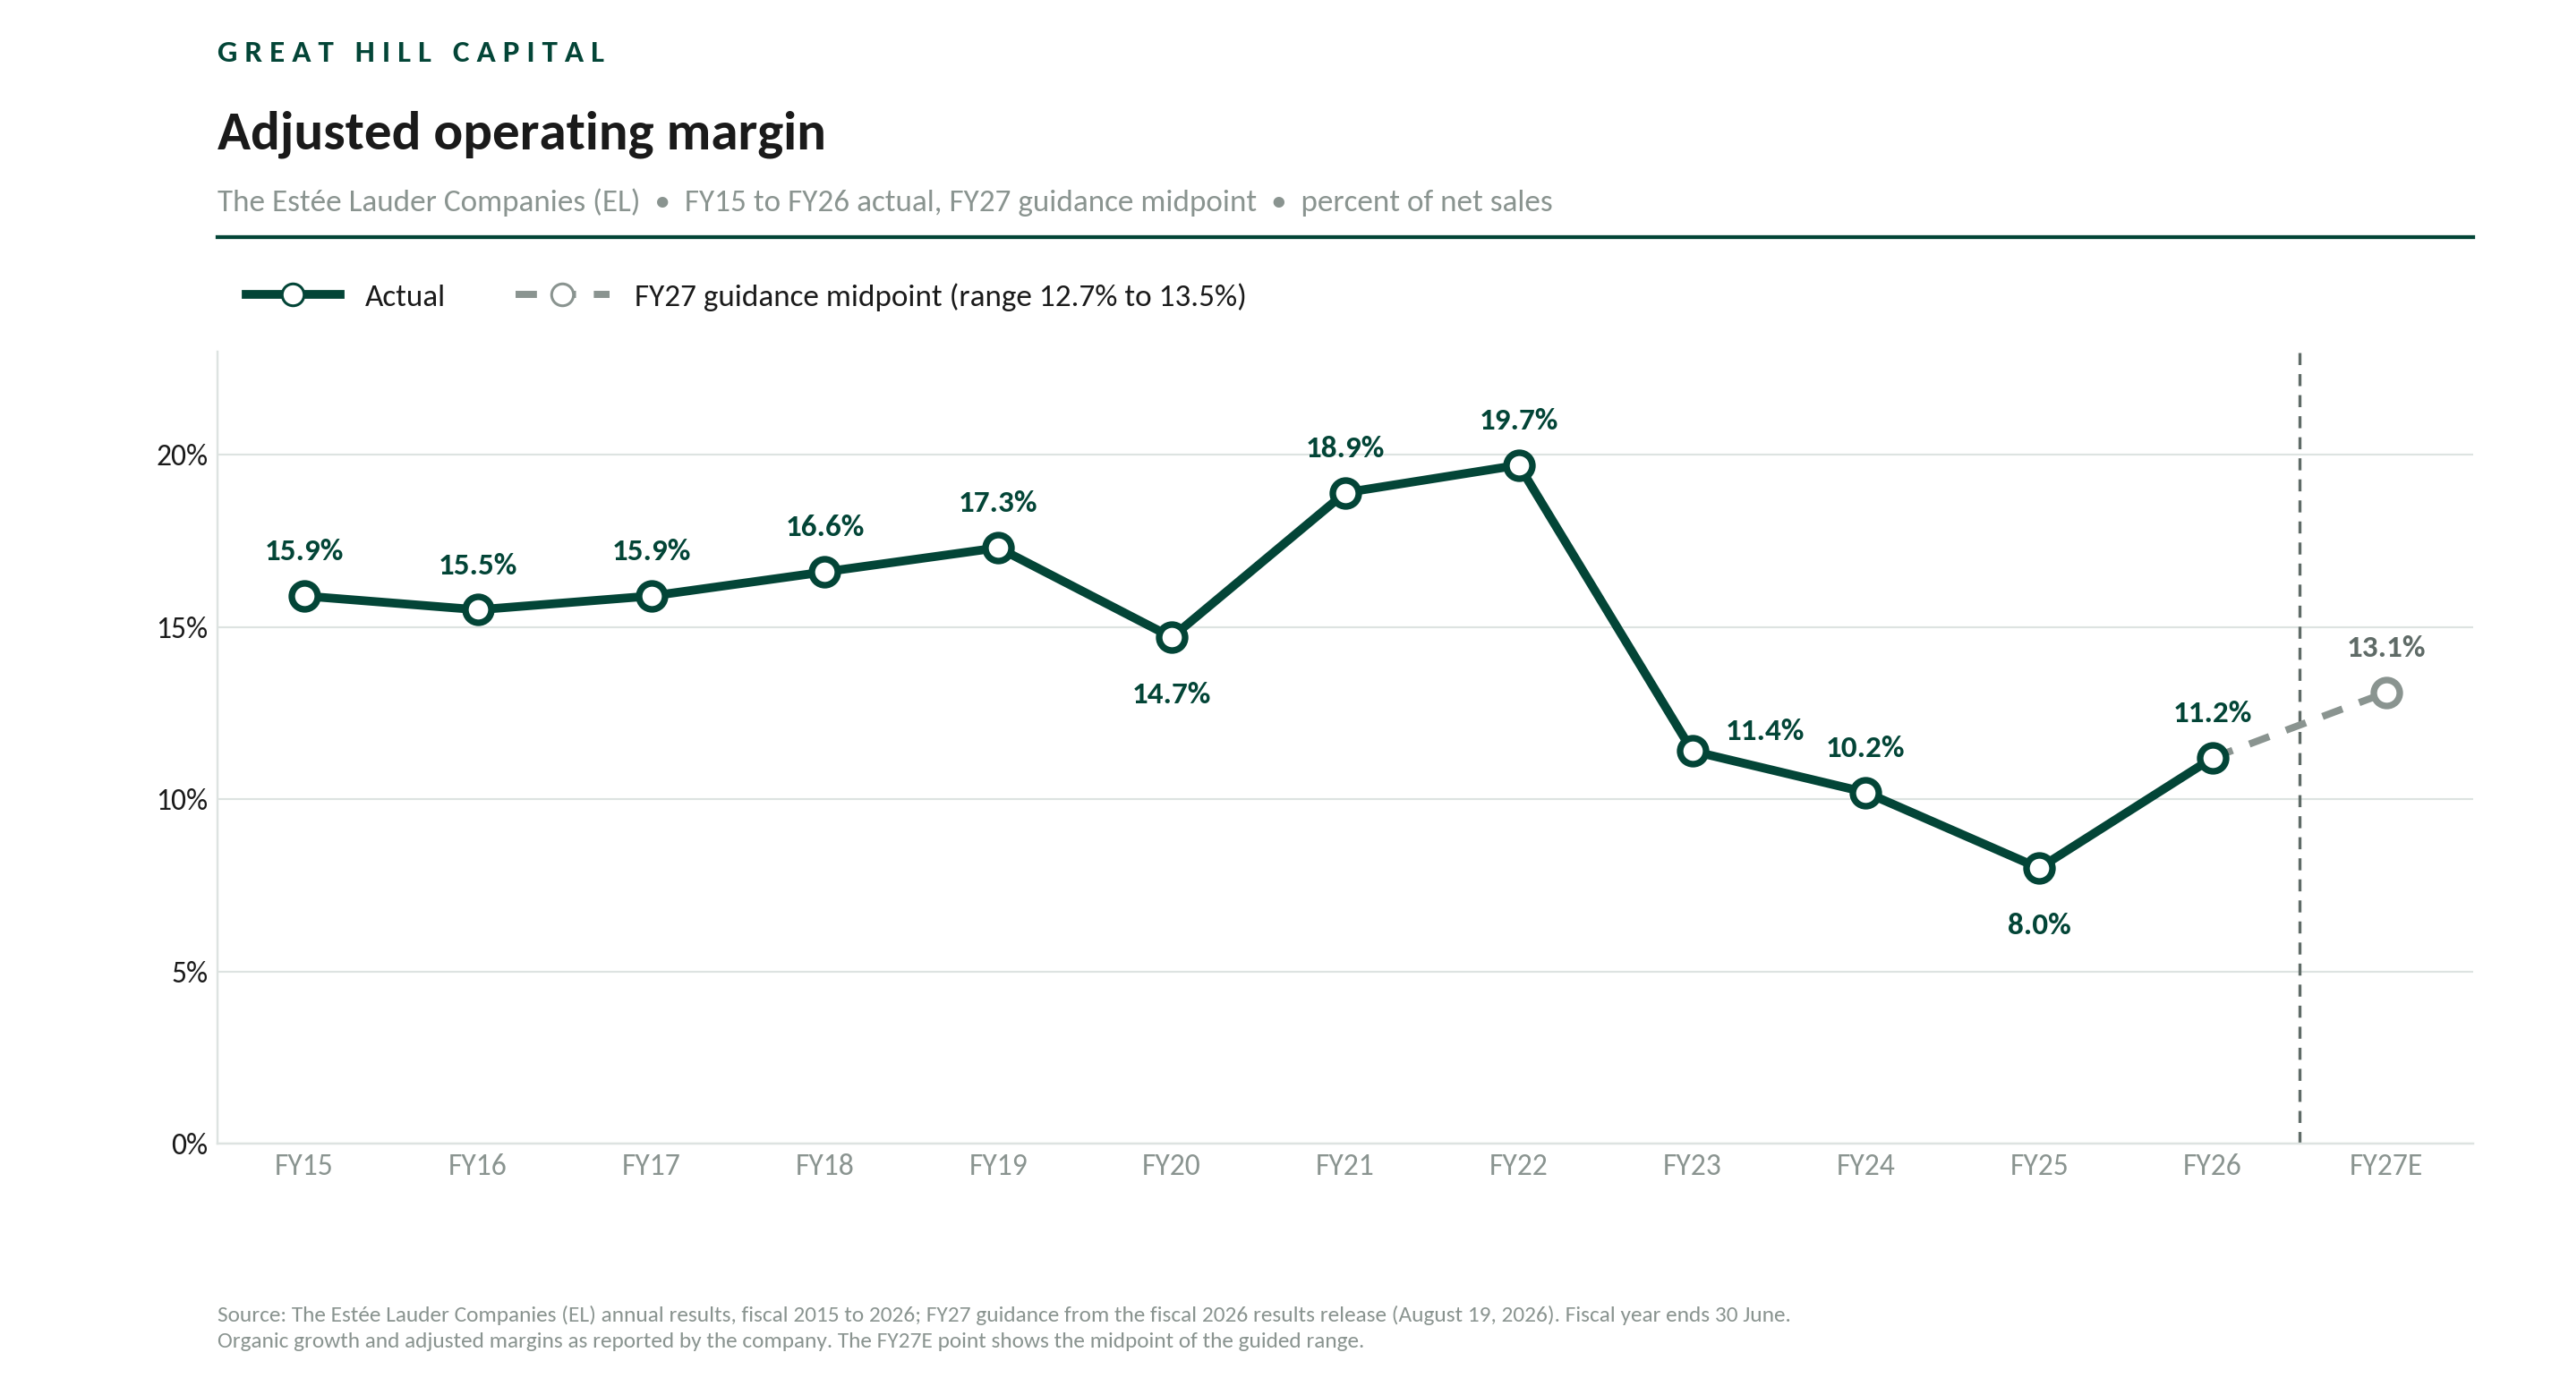
FY26 adjusted gross margin 75.5%, up 150 bps from 74.0% a year ago. (trough 71.4% in FY23)
Adjusted operating margin troughed at 8% in FY2025.
FY26 adjusted OM 11.2%, up 320 bps from 8.0% a year ago.
First full-year operating margin expansion in four years (+320 bps to 11.2%). FY27 adjusted OM guide raised to 12.7-13.5% would mark ~500 bps of margin expansion since the launch of Beauty Reimagined, with management flagging significant runway beyond (historical mid-teens).
Growth Inflecting
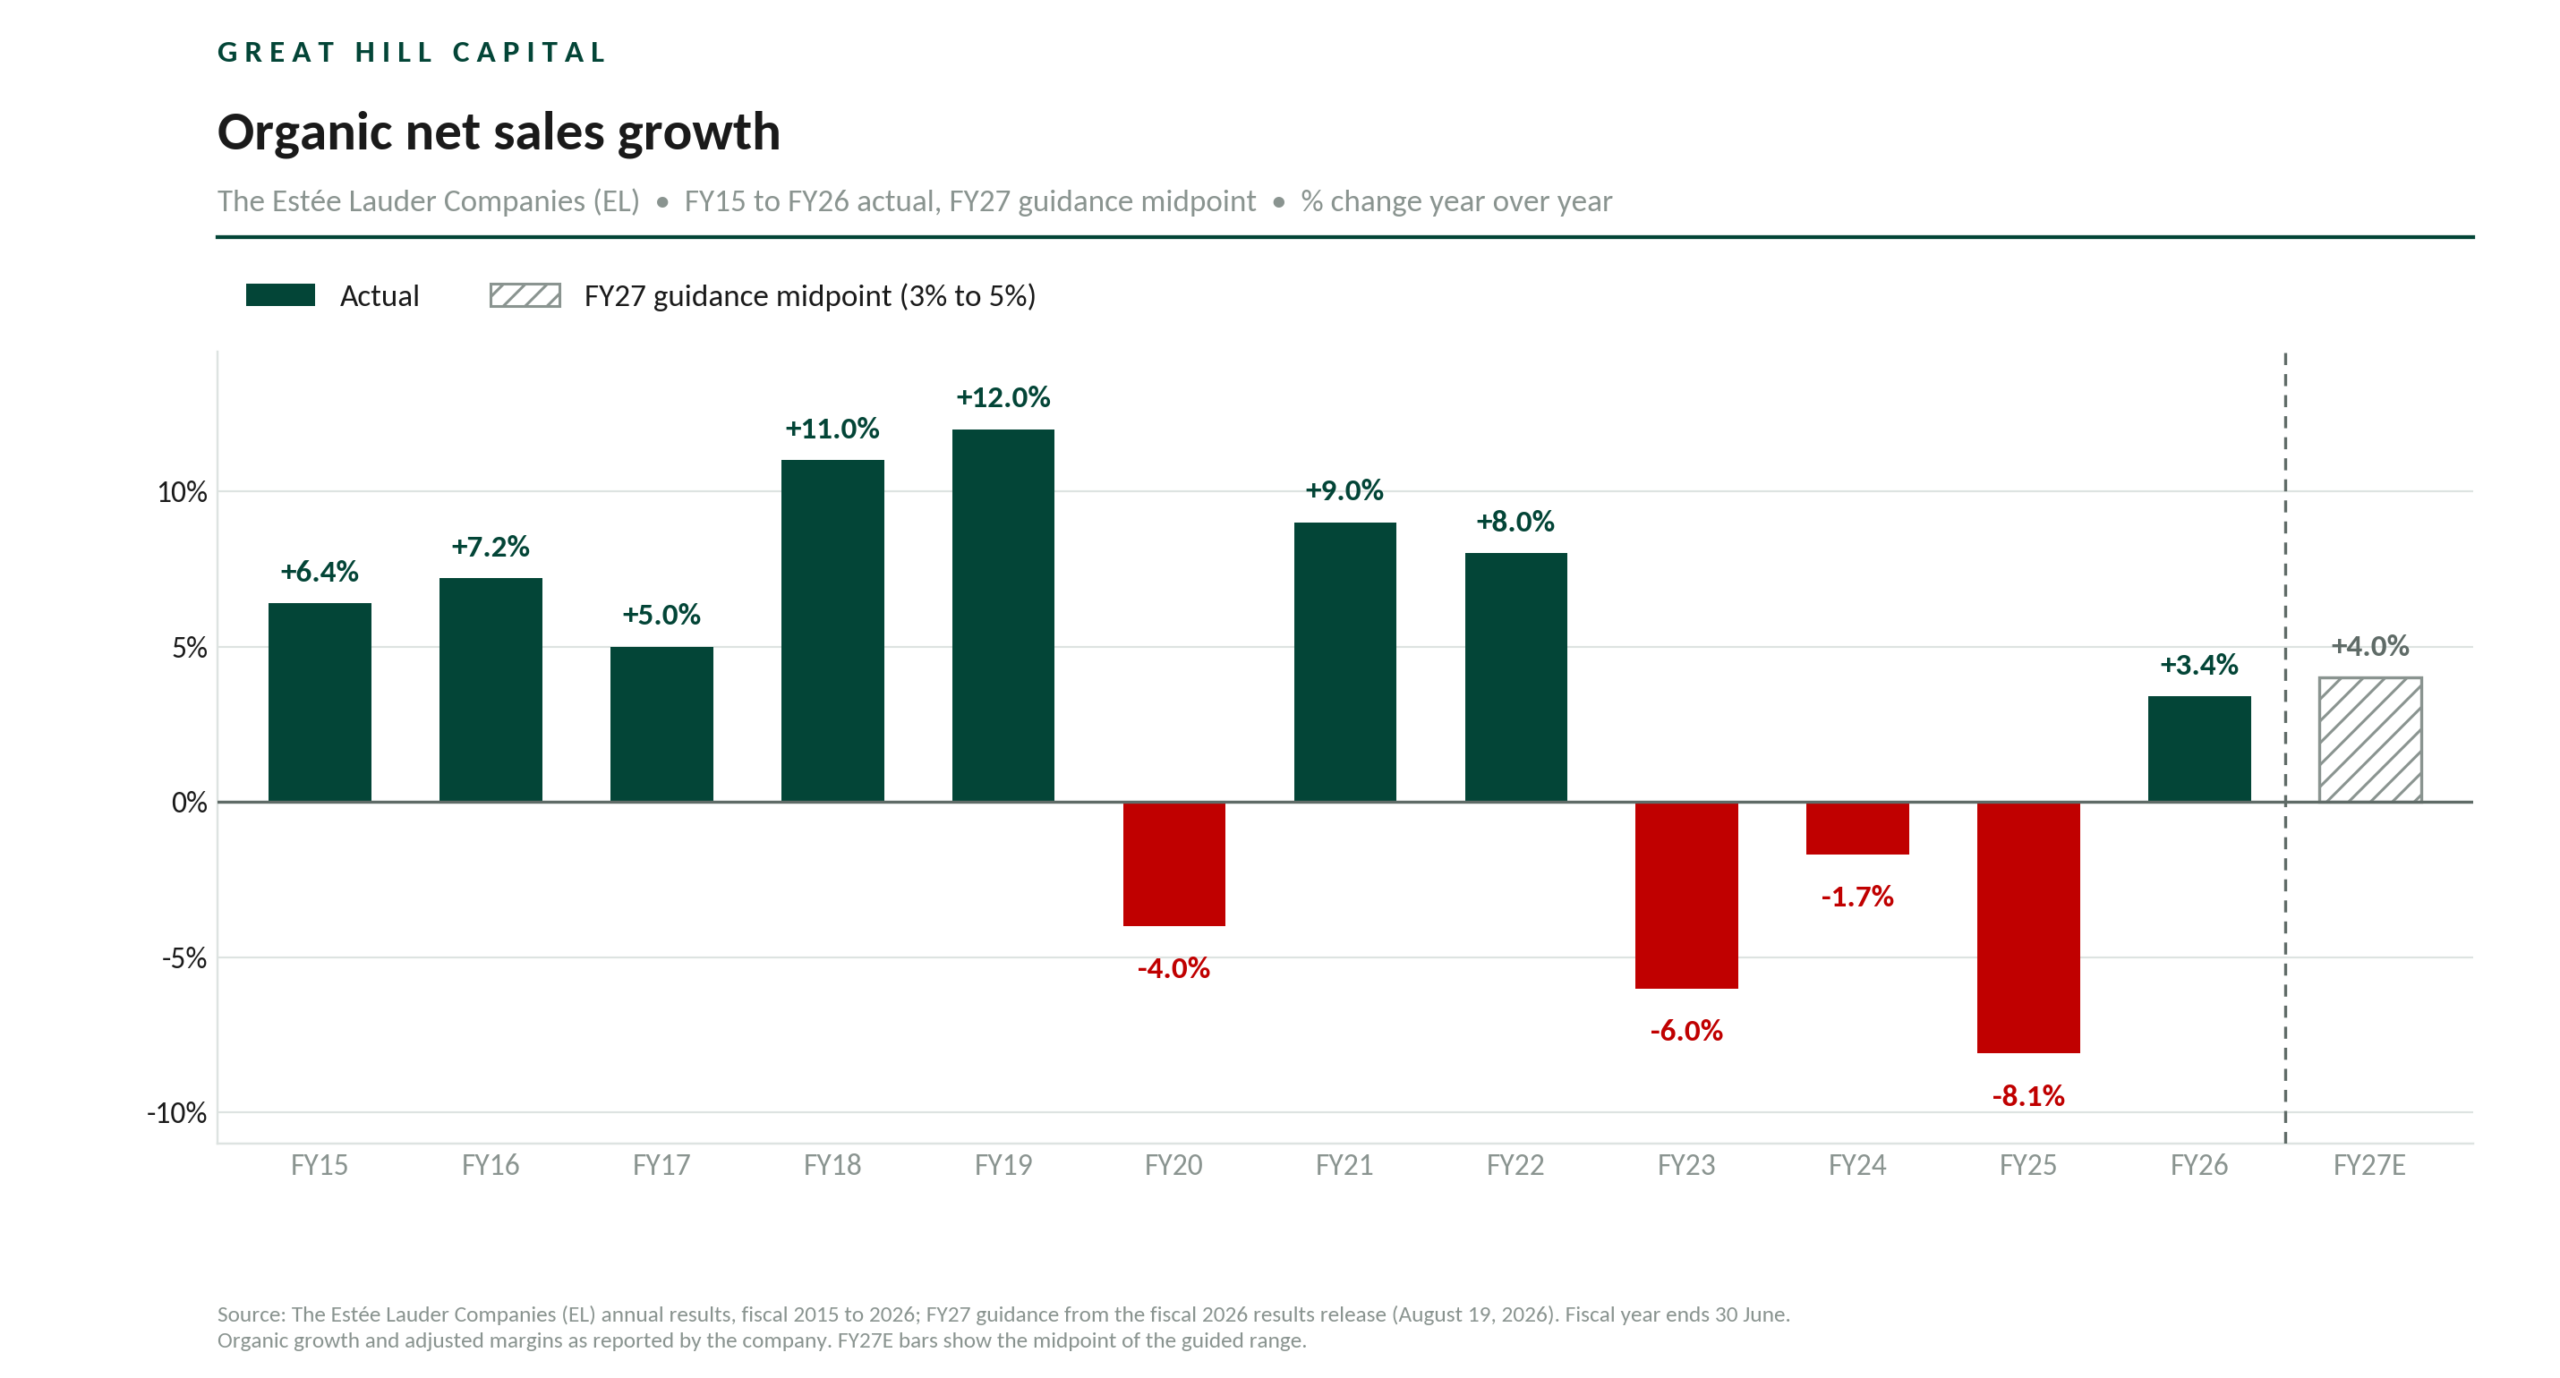
Delivered the first year of positive organic growth in four years (+3% in FY26) (prior: -8% FY2025, -1.7% FY2024, -6% FY2023).
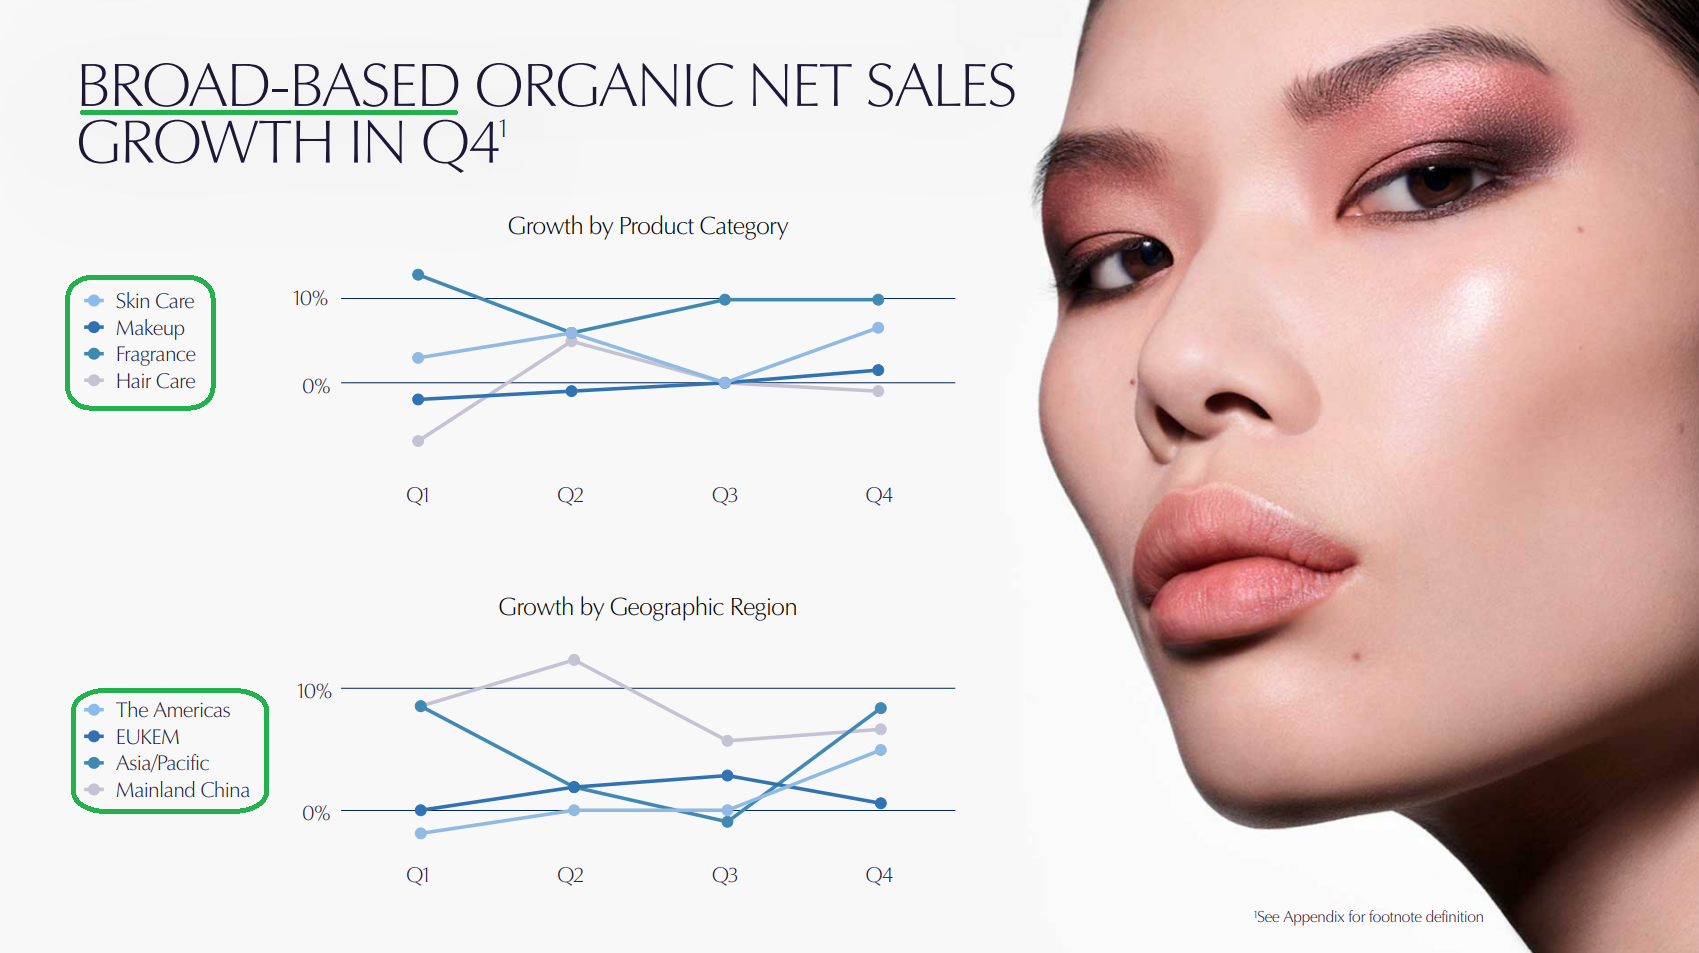
Q4 FY2026: +5% organic sales (strongest quarter of the year), a fourth consecutive quarter of organic growth. All four regions and every category except haircare grew (first time since 2022)
By category (Q4 organic): fragrance +10% on luxury strength (Le Labo, TOM FORD, KILIAN PARIS), skincare +7%, makeup +2%, haircare -1%.
Mainland China: +7% organic and +12% reported to $824M in Q4 (+9% organic for the full year), with EL gaining prestige beauty share for the sixth consecutive quarter. 11 brands in retail sales growth (6 double-digit) in Q4. Online now 50%+ of the China business.
Travel Retail back to positive territory globally in June and July for the first time in 3 years, led by Hainan.
U.S. returned to organic growth in Q4, stabilizing and stopping a decade-plus of share losses.
Push into Digital
Shift away from slower department stores and freestanding doors. Department stores down from ~60% of U.S. revenues to <30%. Freestanding locations down 10-15%.
Online organic sales +double digits, driving prestige beauty share gains across markets including China and the U.S. Online reached a record 34% of reported sales in FY26 (+3 pts Y/Y) and getting closer to 40% in the U.S.
U.S. online sales grew high single digits, a key driver of the country’s stabilization.
Amazon (AMZN) now spans 13 brands across 11 markets; TikTok Shop covers 12 brands across 9 markets. MAC’s March launch in U.S. Sephora drove the brand to #1 in makeup at launched doors.
Faster-growing channels translating to top-line growth and margin leverage.
Key Financials + FY2026 Guidance
Full-year 2026 revenue $15.05B (+5%), full-year adjusted EPS $2.51 (+66% Y/Y).
FY27 guidance: organic sales +3-5%. Adjusted OM raised to 12.7-13.5% (from a preliminary 12.5-13.0% in May), a ~13.1% midpoint vs. ~12.9% consensus. Adjusted EPS $3.10-$3.35 (+24-34% Y/Y) vs. consensus ~$3.18. Makeup returns to growth for the full year; North America accelerating; first half stronger than second.
FCF $1.32B in FY26 vs. $0.67B last year, nearly doubling on higher earnings and lower CapEx (down to $457M). Ended the year with $3.5B cash.
Cash ~$3.5B. Debt ~$7.3B. Dividend $1.40/share, ~1.5% yield.
Q4 Commentary
Estée Lauder’s multi-year makeover is starting to pay off.
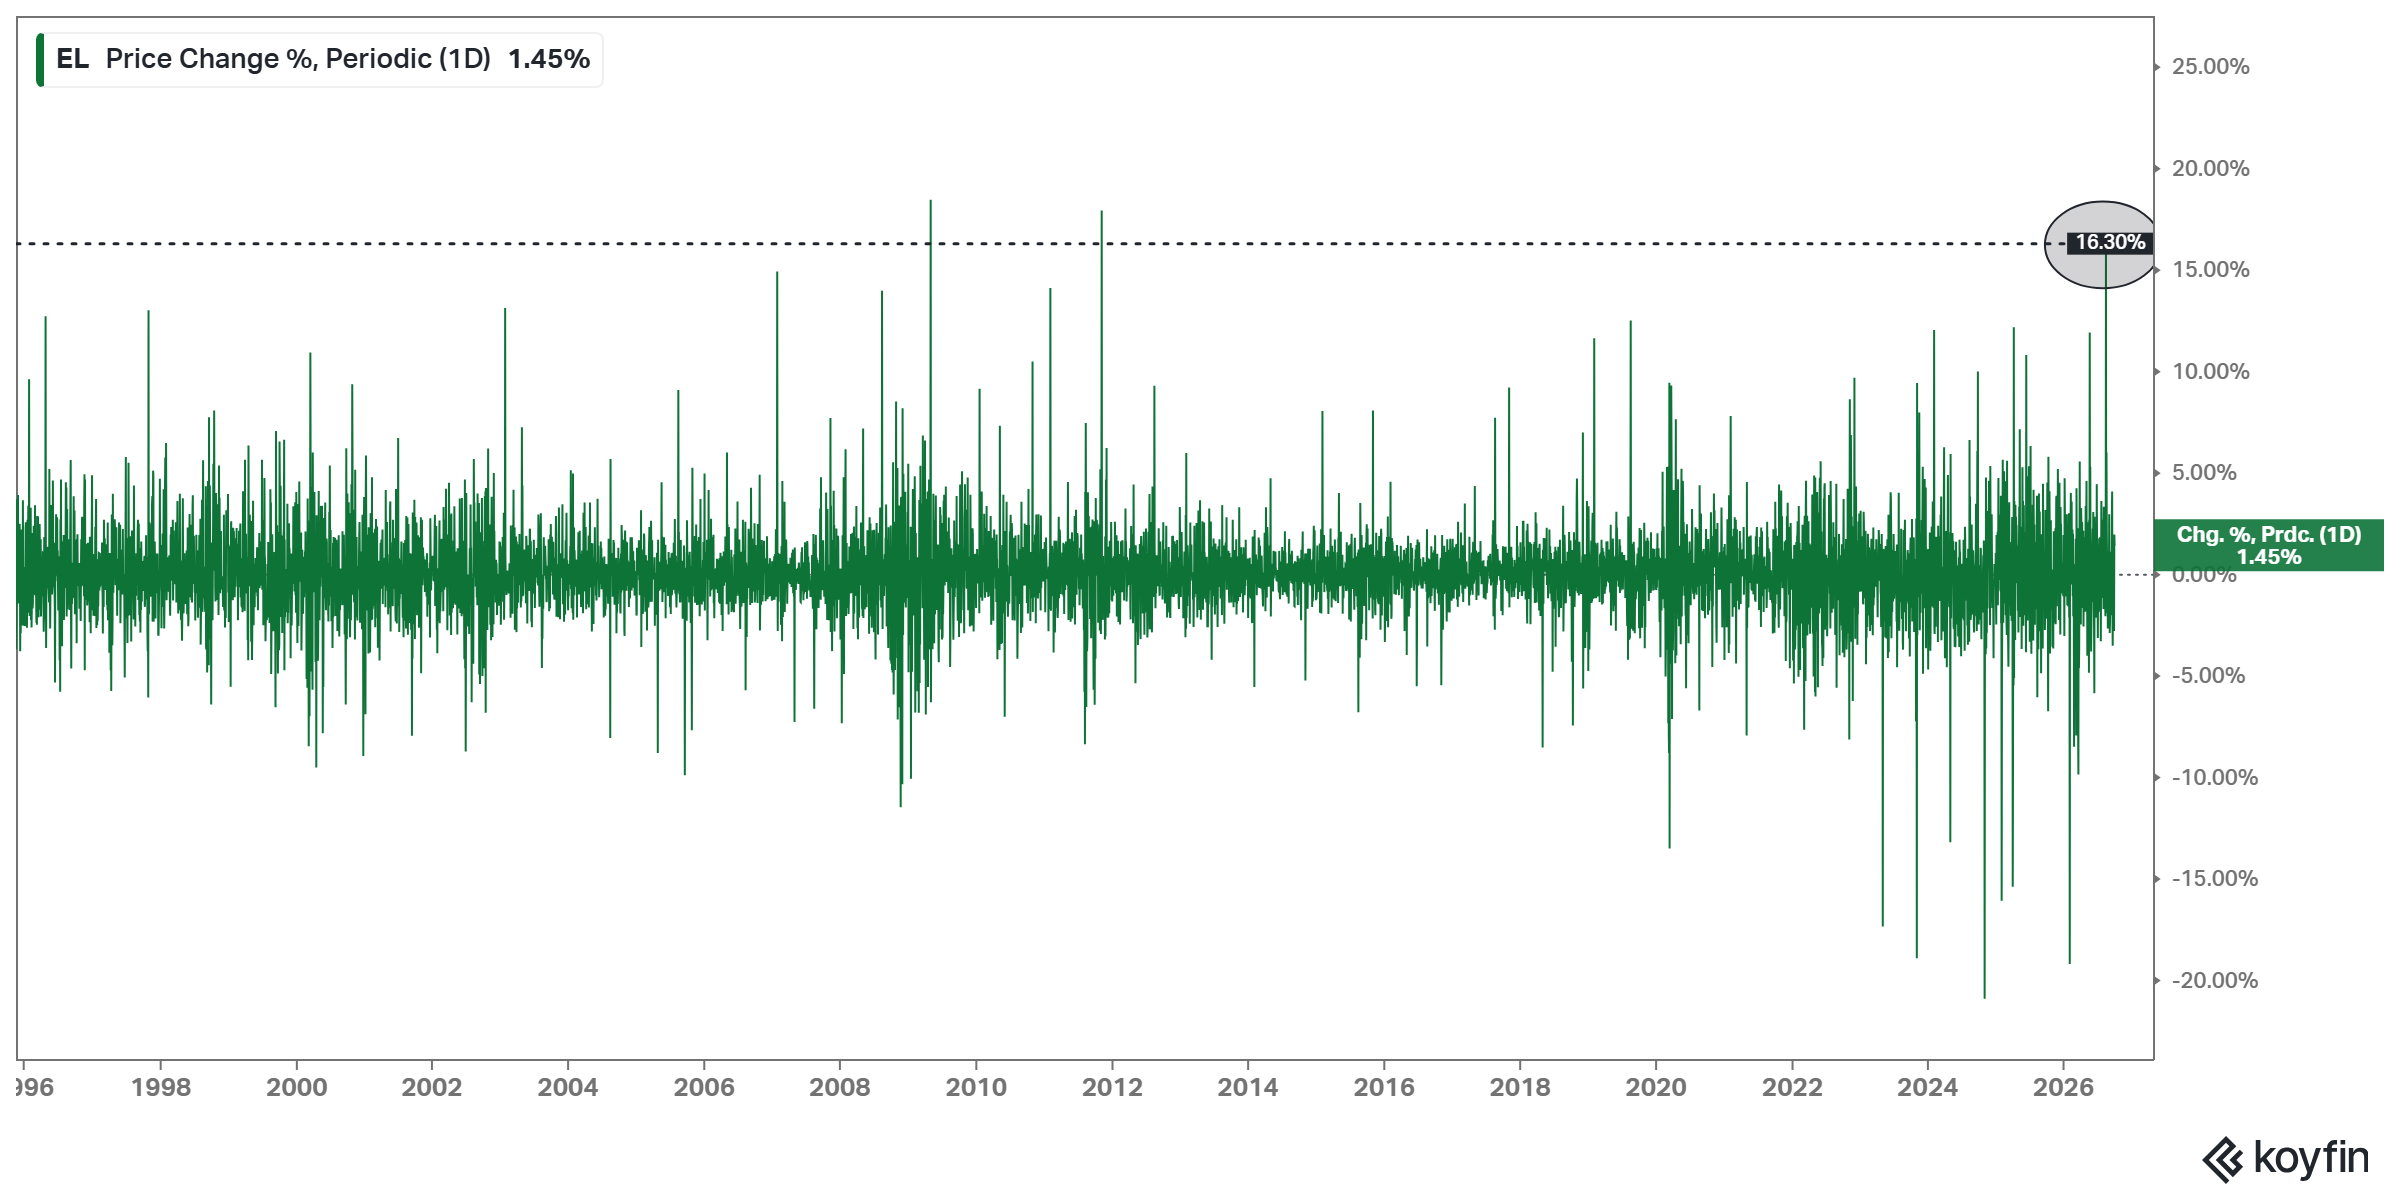
Fourth-quarter organic sales grew 5.3%, the strongest quarter of the year and a fourth consecutive quarter of growth, bringing full-year organic growth to 3.4% after three straight years of declines (-6.0% in FY23, -1.7% in FY24, -8.1% in FY25). Adjusted operating margin expanded 320 bps to 11.2%, with management guiding FY27 adjusted operating margin to 12.7-13.5%, up from its initial outlook of 12.5-13.0%, alongside 3-5% organic sales growth. The results confirmed what we have been pounding the table on: the turnaround has reached its inflection point, with the story shifting from cost cuts and restructuring to growth and operating leverage. The market got the message, sending shares up 16.3% on the day in the stock’s best single session since 2011.
Following Q4 earnings, CEO Stéphane de La Faverie did a great interview covering organic growth, M&A, the China recovery, travel retail, innovation, and more:
Up until this point, the Estée Lauder story has been one of self-help. Under the Profit Recovery and Growth Plan, management rebuilt the cost base from the ground up, rightsizing the organization, improving procurement, optimizing the supply chain, outsourcing back-office functions, and overhauling a go-to-market model that leaned too heavily on unproductive department store and freestanding doors. The plan was designed to deliver $1.2B in annual gross savings through a net reduction of ~10,000 positions, with both targets landing at the high end of management’s original expectations. With approvals now complete and full run-rate savings flowing through by FY28, the self-help box is largely checked. The payoff from that heavy lifting can already be seen in gross margins, which have rebounded to 75.5% from a trough of 71.4% in FY23.
More importantly, FY26 marked the first year those self-help efforts translated into operating leverage, with the return to growth helping drive the first full-year expansion in operating margin in four years.
The growth is broad-based across the portfolio, adding credibility to the recovery, with the fourth quarter marking the first since 2022 in which every region and product category grew organically, with the exception of hair care.
In fact, Jo Malone London and TOM FORD both joined the billion-dollar club in FY26, giving Estée six $1B+ brands alongside Clinique, Estée Lauder, La Mer, and M·A·C, while The Ordinary grew double digits for the year and is knocking on the door of $1B after ~doubling sales since FY22.
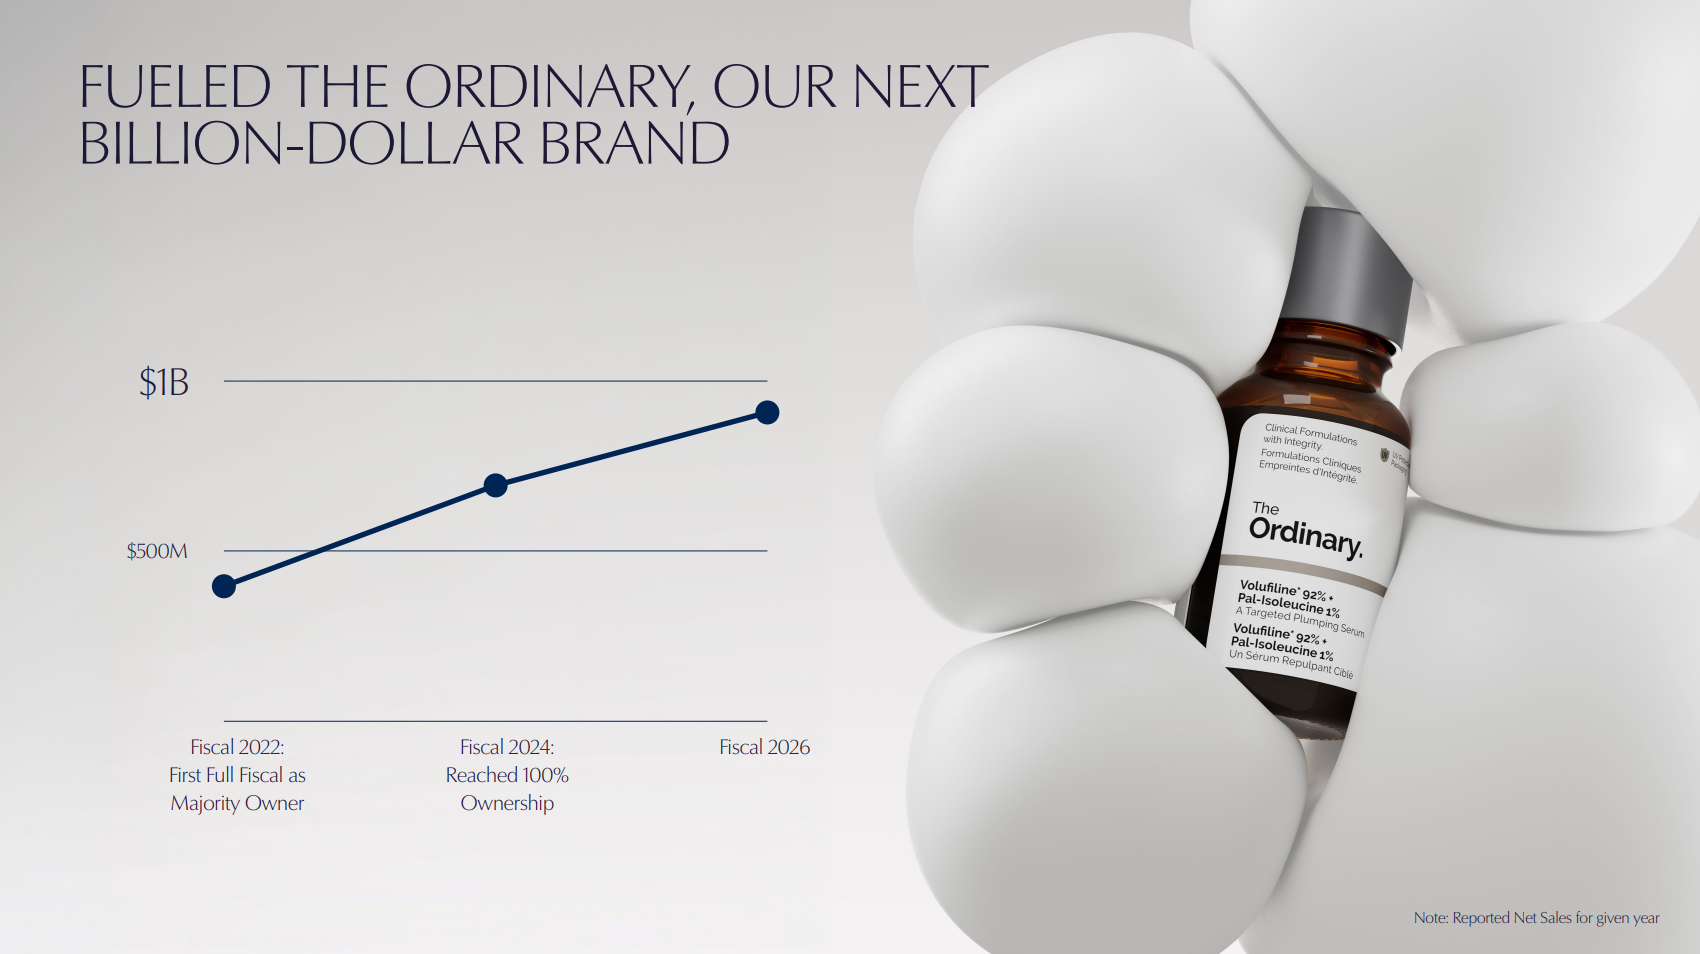
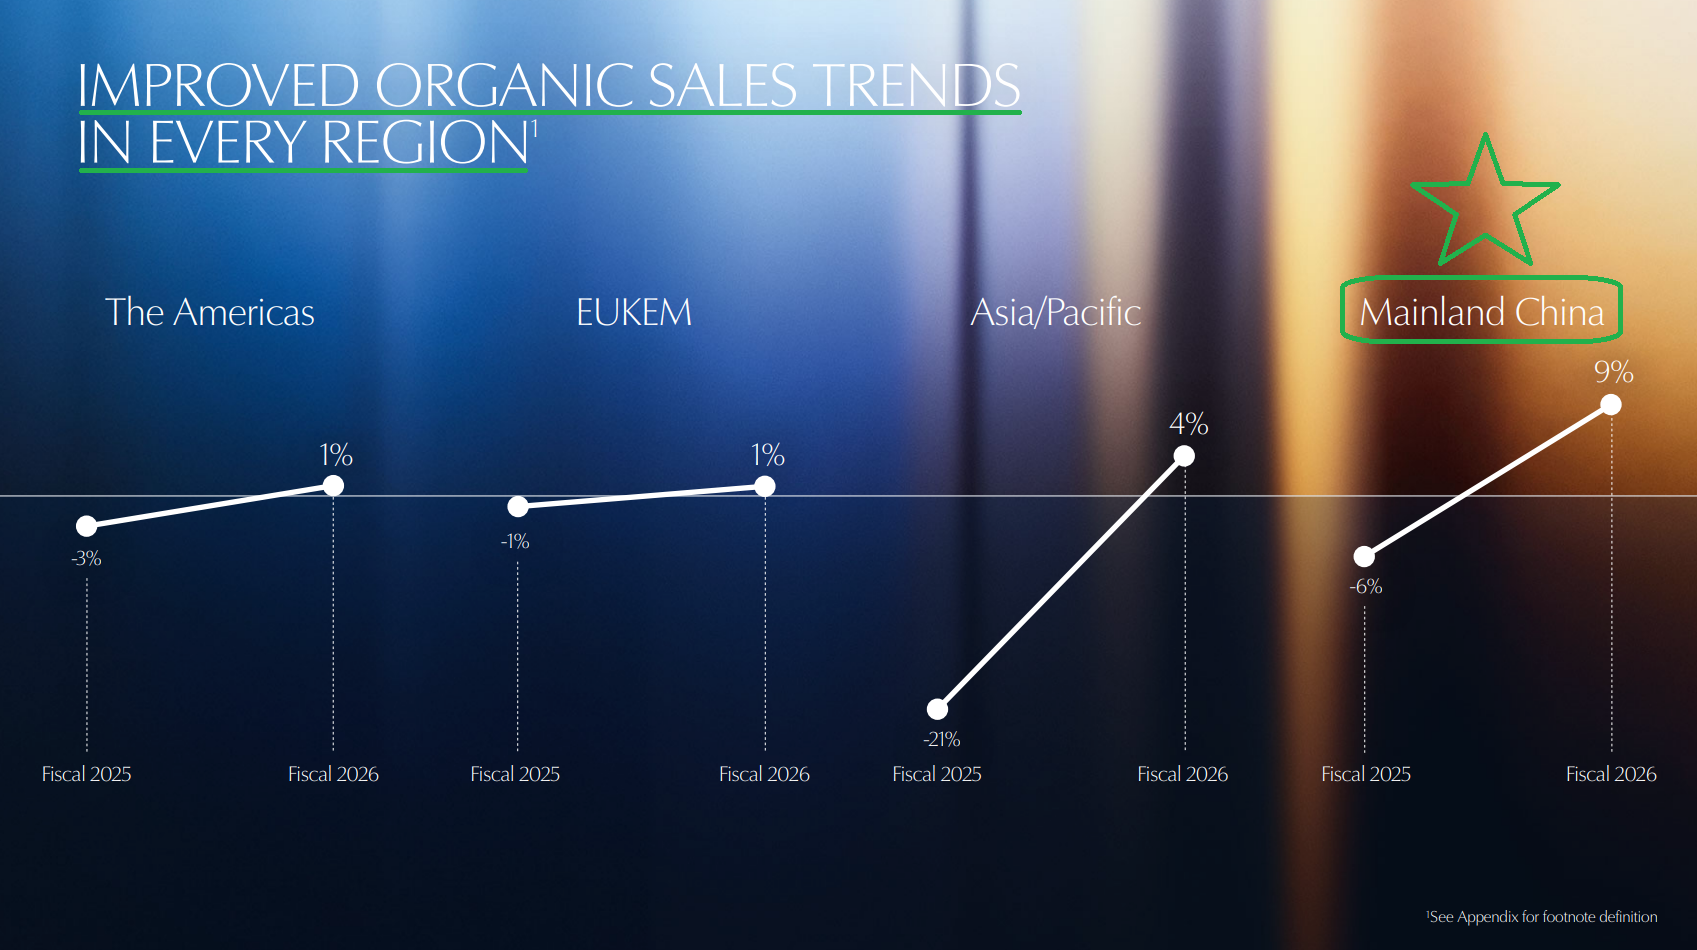
Mainland China, accounting for ~20% of sales, continues to lead the growth recovery. After falling ~6% in FY25, organic sales grew 9% in FY26 as Estée gained prestige beauty share for a sixth consecutive quarter in one of the most competitive markets in the world. The recovery is no longer just a La Mer and skin care story either, with 11 brands growing at retail in the fourth quarter, six at a double-digit pace, while fragrance grew double digits and makeup mid-single digits for the year, alongside high single-digit growth in skin care.

Travel retail remains a key driver of both the Mainland China turn and Asia/Pacific, where organic sales grew 4% in FY26. Estée got caught offsides in travel retail in 2023 and has spent the past several years rightsizing the channel, reducing it to ~15% of sales from a 28% peak and putting a new team in place to manage inventory and shipping based on retail demand. The progress is starting to show, with global travel retail turning positive in June and July for the first time in three years, led by double-digit growth in Hainan.
In the Americas, Estée’s largest region at ~30% of sales, the story is moving from stabilization to acceleration. Organic sales grew 1% in FY26 after years of declines in North America weighed on the region. The fourth quarter saw an acceleration to 5% organic growth, alongside U.S. volume share gains in prestige beauty after more than a decade of share losses. Accelerating North America is a top priority for FY27, with the plan built around three pieces: a bigger innovation pipeline led by prestige fragrance launches like Estée Lauder Glimmer (its first major launch in >10 years), wider distribution into the channels where consumers actually shop, and sharper execution across the brick-and-mortar doors it keeps.
That channel shift is a big reason behind both China’s turn and the Americas’ recovery. Online sales grew double digits in FY26 to a record 34% of reported sales, up 3 percentage points from a year ago, with online now accounting for more than half of the business in China.


Estée has expanded to 13 brands across 11 markets on Amazon and 12 brands across nine markets on TikTok Shop, while steadily reducing its reliance on department stores and their labor-heavy beauty counters. M·A·C is a strong example of the pivot working, going from a high-single-digit decline in FY25 to mid-single-digit growth in FY26 and reclaiming the #1 makeup position in the U.S. in the fourth quarter on the back of its push into Sephora and TikTok Shop.
That return to growth is now setting the stage for operating leverage. Adjusted operating margin ran between 15.5% and 17.3% from FY15 through FY19 and peaked at 19.7% in FY22 before bottoming at 8.0% in FY25, with FY27 guidance now calling for ~13.1% at the midpoint. Consensus has margins reaching 13.2% in FY27, 14.5% in FY28, and 15.3% in FY29, implying EBIT growth of ~22%, 15%, and 11% over the next three years on sales growth of only ~4-5% annually. That implies significant operating leverage, yet it essentially pencils in a return to the historical mid-teens norm.
But the company coming out of this downturn is not the same one that went into it. Estée is a structurally higher-margin business today, with ~$1.2B of costs removed, a P&L shifted from fixed toward variable costs, and a channel mix tilting away from labor-intensive counters. Estée also finds itself an AI beneficiary today, an opportunity the company didn’t have before and is already leaning into to speed up R&D and optimize media spend.

The company is set to deliver ~500 bps of margin expansion across FY26 and FY27, without the full annualization of PRGP savings or the efficiency gains in consumer-facing spend that management still sees as largely untapped. We think the combination of the operational improvements already made and the operating leverage still to come as sales accelerate makes a return to the high teens well within reach. Keep in mind, those margins in FY22 produced $7.24 of EPS, more than double the $3.10-$3.35 guided for FY27, a reminder of how much earnings power remains ahead.
As management continues to execute, we expect the operating leverage and normalized earnings power of the business to become increasingly difficult for the market to ignore.
General Market
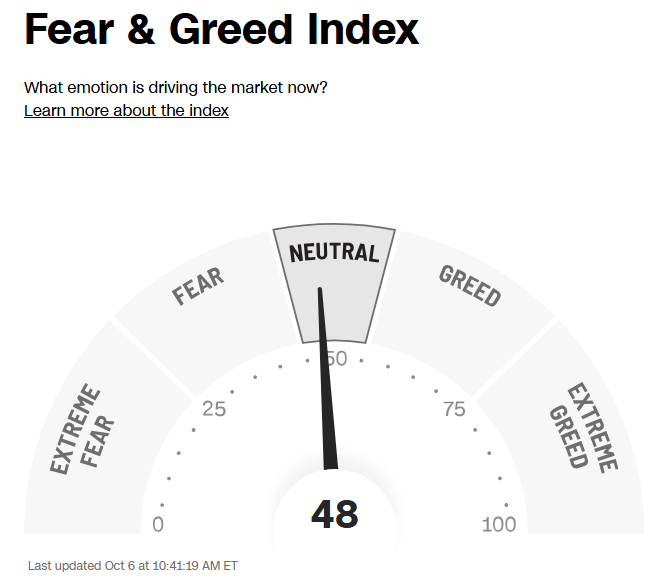
The CNN “Fear and Greed Index” ticked up to 48 this week from 32 last week. You can learn how this indicator is calculated and how it works here: (Video Explanation)
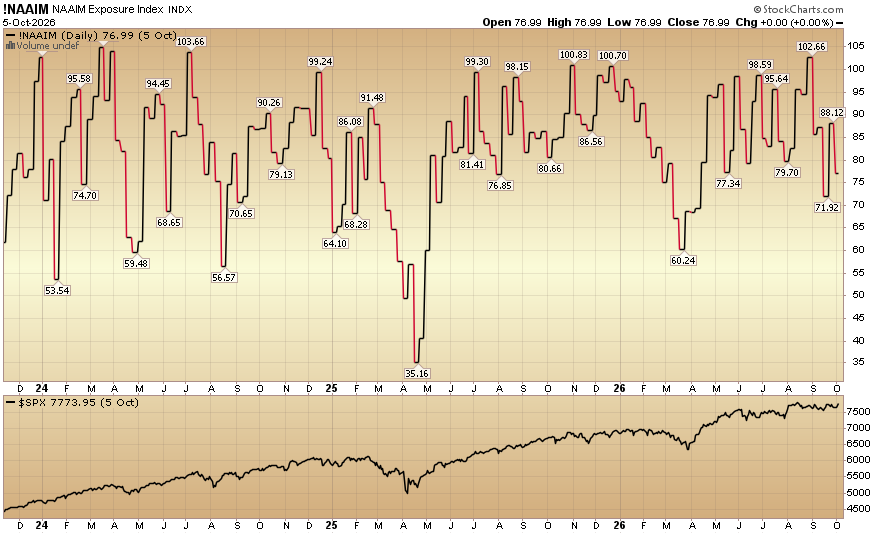
The NAAIM (National Association of Active Investment Managers Index) (Video Explanation) ticked down to 76.99% equity exposure this week from 88.12% last week.

Comments
Log in or sign up to join the conversation.