

Bank of America (BAC) Fund Manager Survey Update
On Tuesday, we put out a summary of the monthly Bank of America Global Fund Manager Survey. This month, they surveyed 180 institutional managers with ~$525B in AUM.
Here were the 5 key points:
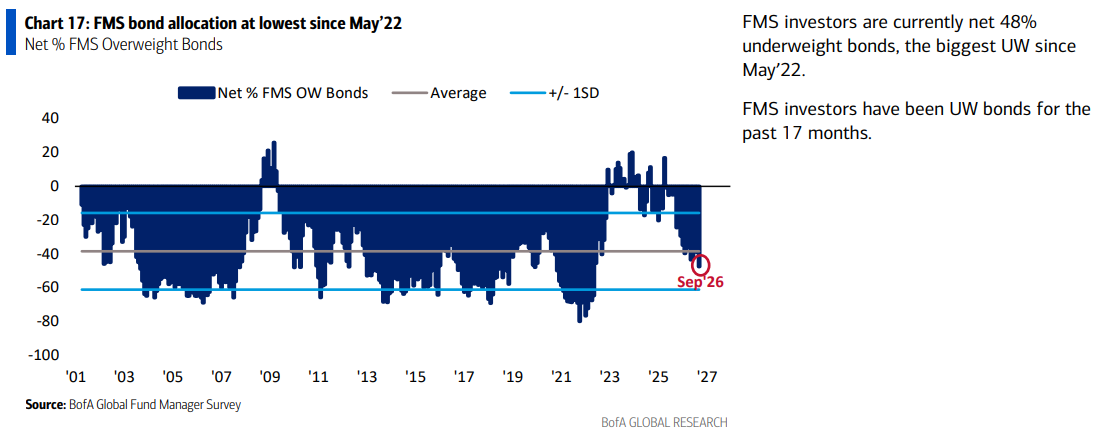
1) Fund managers are now net 48% underweight bonds, the biggest underweight since May 2022 and the 17th straight month of underweight positioning. We are happy to take the other side. Rolling 10-year annualized real total returns on bonds have turned negative, a setup seen only three times in the past century (1920, the early 1950s, and 1981), each one a generational entry point. Investors are extrapolating today’s conditions (inflation expectations, elevated energy prices, war, etc.) out in perpetuity, while institutional money is already moving to lock in yield (the latest 10-year auction had a 2.71 bid-to-cover ratio, well above average).
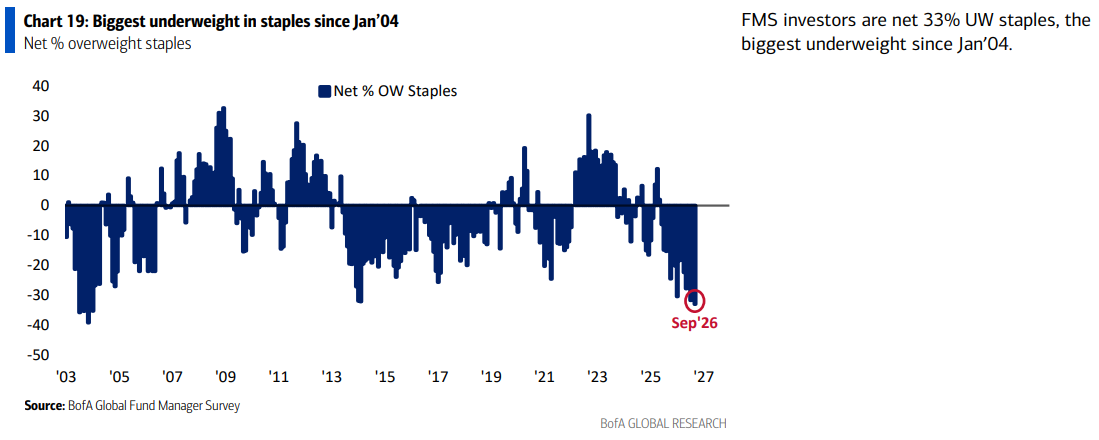
2) Fund managers are now net 33% underweight staples, up from a net 19% underweight last month and the biggest underweight since January 2004 (2.0 standard deviations below its long-term average). The sector has been left for dead, with its weight in the S&P 500 falling to a record-low 4.5% and relative performance back at levels last seen at the March 2000 dot-com peak. This comes despite defensives outperforming cyclicals in seven of the past eight midterm cycles by an average of ~7 percentage points, the basis for our overweight SHUT thesis (staples, healthcare, utilities, telecom). At the same time, as rates come down, we expect dividend payers within staples to get a bid as investors are forced to lock in yield elsewhere.
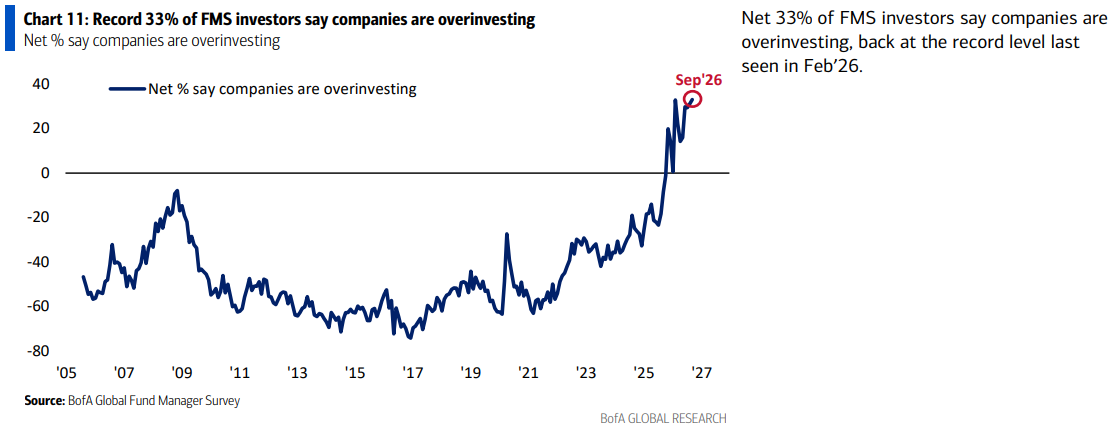
3) A record net 33% of fund managers say companies are overinvesting, back at the record level last seen in February 2026. The asset-light model that once defined big tech’s dominance has given way to a capital-intensive arms race, with investors increasingly asking where the R is in ROIC. Yet a rising 79% do not expect any of the hyperscalers to announce a capex cut this year (vs 71% last month). Managers are calling the spending excessive while simultaneously betting it continues unchecked.
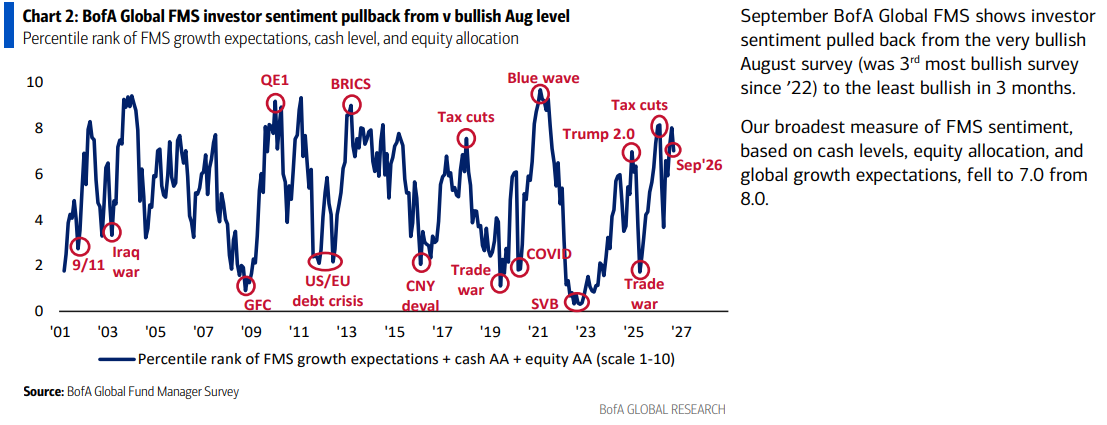
4) BofA's broadest sentiment gauge, built off cash levels, equity allocation, and global growth expectations, fell to 7.0 from 8.0 in September, the least bullish reading in three months after August ranked as the third most bullish survey since 2022. Sentiment has come off the boil, though at 7.0 managers remain overwhelmingly bullish and well above neutral.
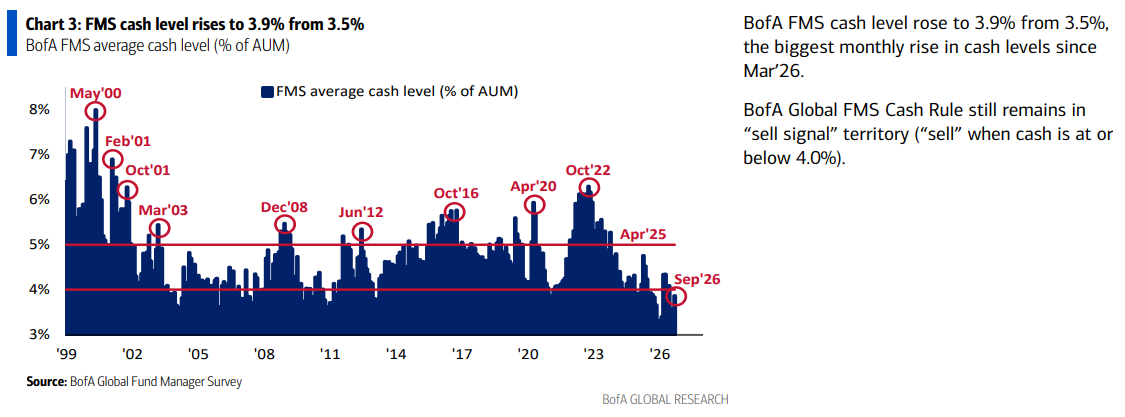
5) Fund managers' average cash level rose to 3.9% from 3.5%, the biggest monthly increase since March 2026. Even after the jump, cash remains low enough to keep the BofA Global FMS Cash Rule in sell signal territory, which flashes at or below 4.0%.
Comstock Resources Update
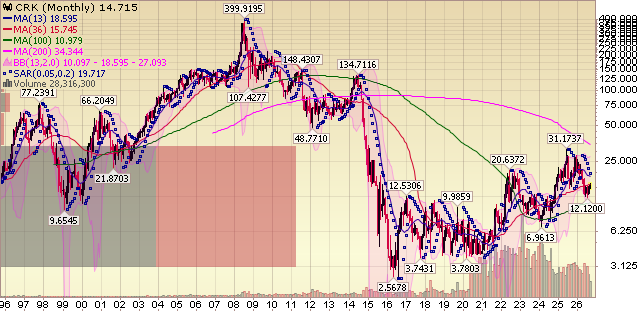
For newer readers, here’s a quick overview of the key drivers behind our thesis on Comstock Resources (CRK), a natural gas producer that we believe offers one of the most attractive backdoor ways to play the AI and data center buildout at a reasonable valuation:
CRK | NYSE | Market Cap: ~$3.9B
Lowest-cost nat gas producer at the epicenter of LNG and data center demand
Company Overview
Leading pure-play Haynesville shale natural gas producer focused on North Louisiana and East Texas. Independent E&P company headquartered in Frisco, TX, with corporate lineage back to 1919.
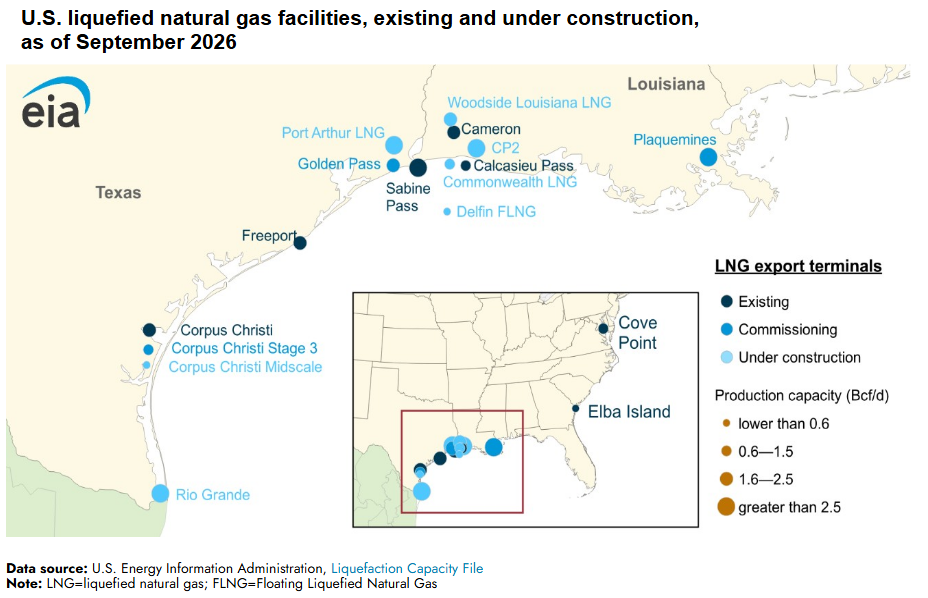
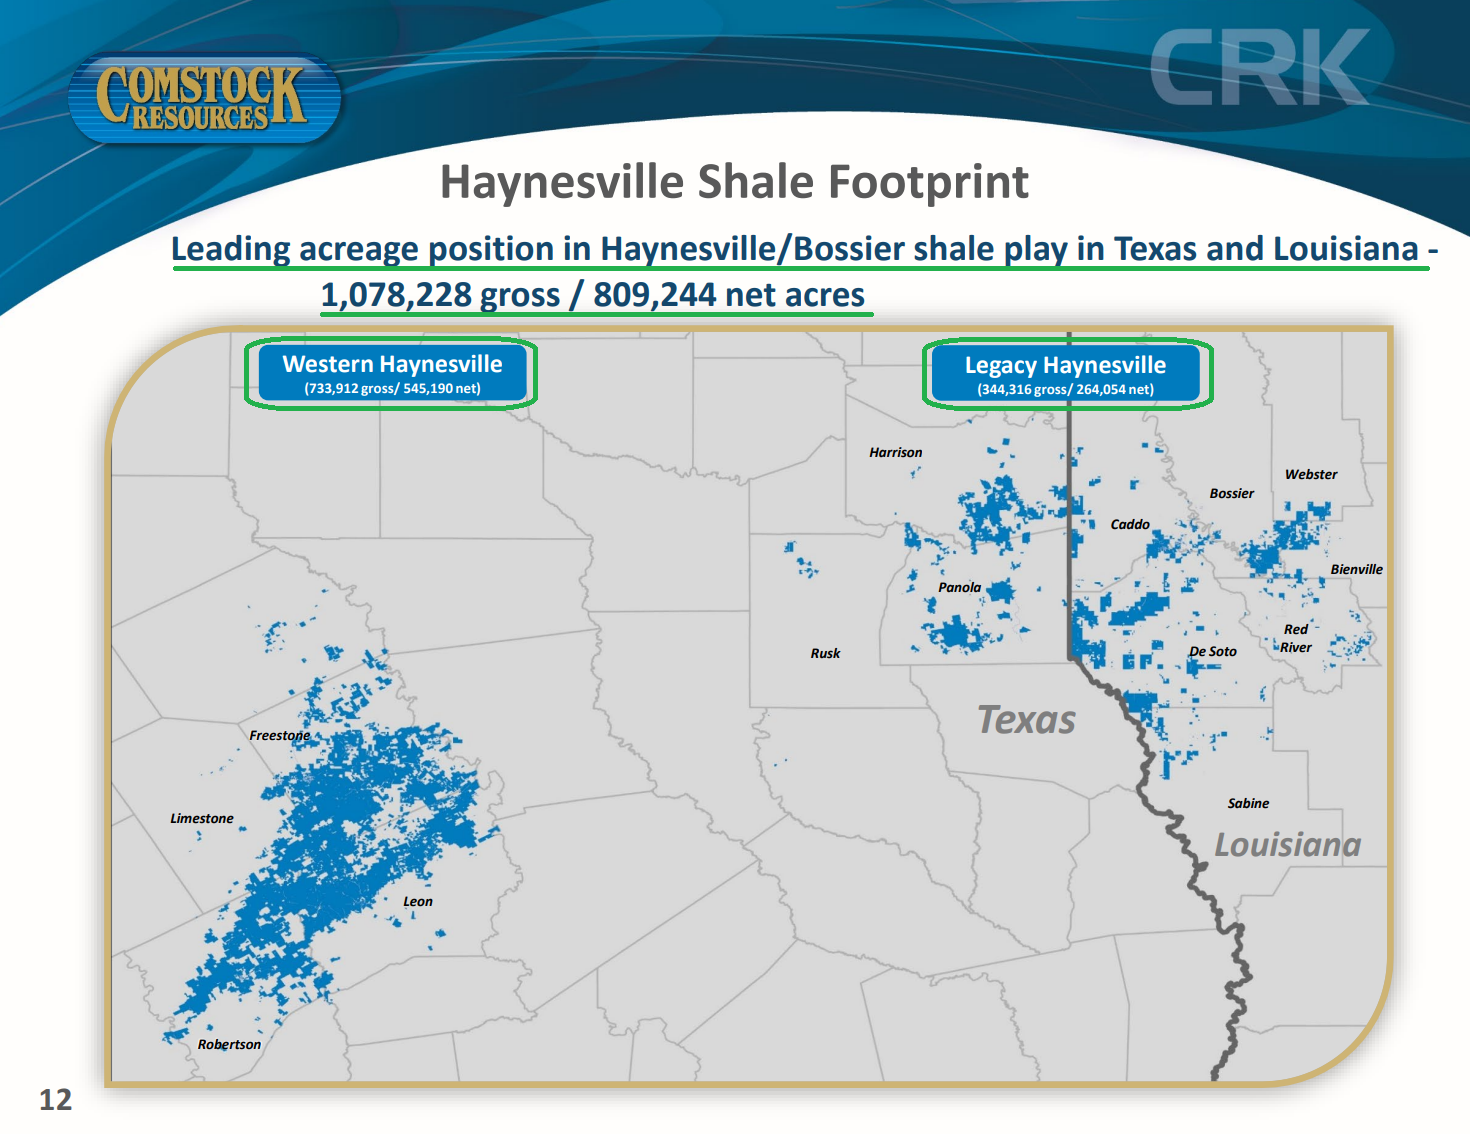
Largest acreage position in the basin at 1,078,228 gross / 809,244 net acres. Premier footprint ~100 miles from Dallas/Houston and ~250 miles from the Gulf Coast LNG corridor, with 7 of the 9 existing U.S. export terminals within a couple hundred miles and 4 more under construction.
A vehicle for leveraged exposure to the U.S. natural gas secular bull market.
Jerry Jones Investment
Dallas Cowboys owner Jerry Jones controls ~71% of CRK. Invested >$1.1B at a ~$7/share average basis.
Veteran wildcatter who built his initial fortune in oil and gas. Has repeatedly called Comstock his best investment ever, saying his gas holdings “put the Cowboys in the shade financially.”
Zigged when others zagged during low-price periods, funding aggressive acreage build and development when competitors pulled back.
Now funding development directly through a $450M drilling venture alongside the company.
Industry-Leading Cost Structure + Footprint
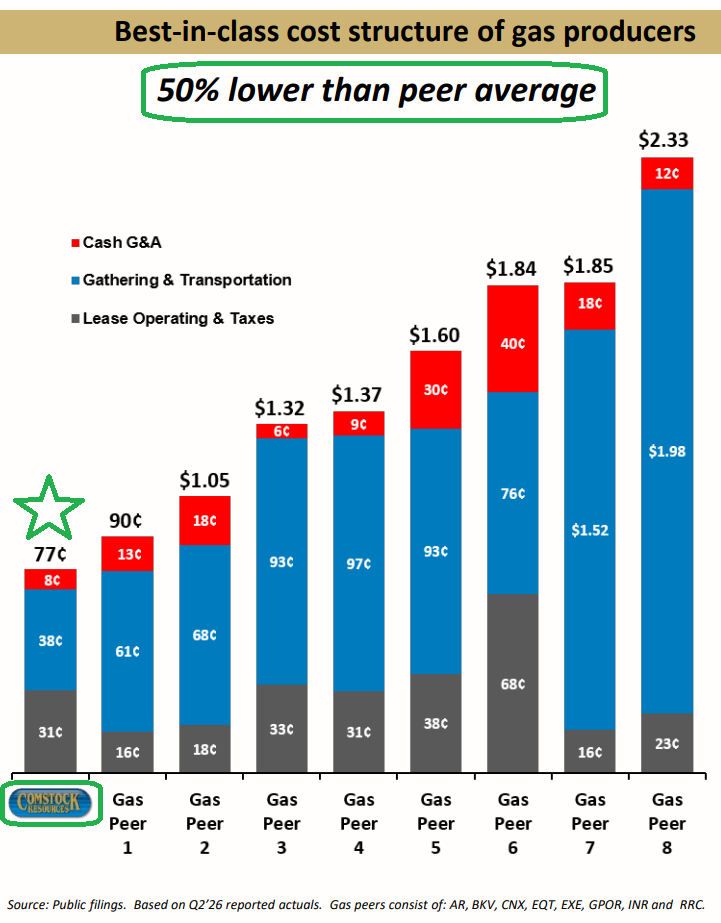
Industry’s lowest operating cost profile: ~50% below the peer average (AR, BKV, CNX, EQT, EXE, GPOR, INR, RRC on Q2’26 actuals).
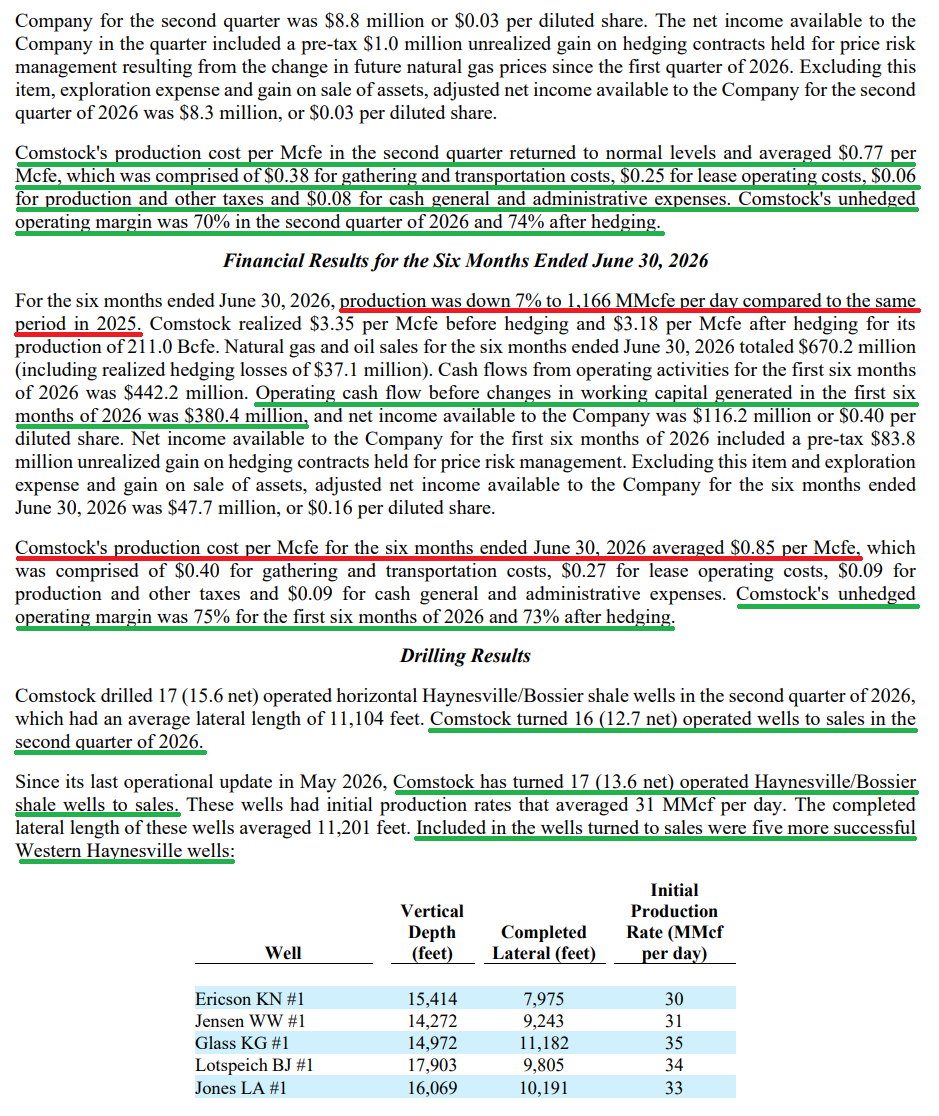
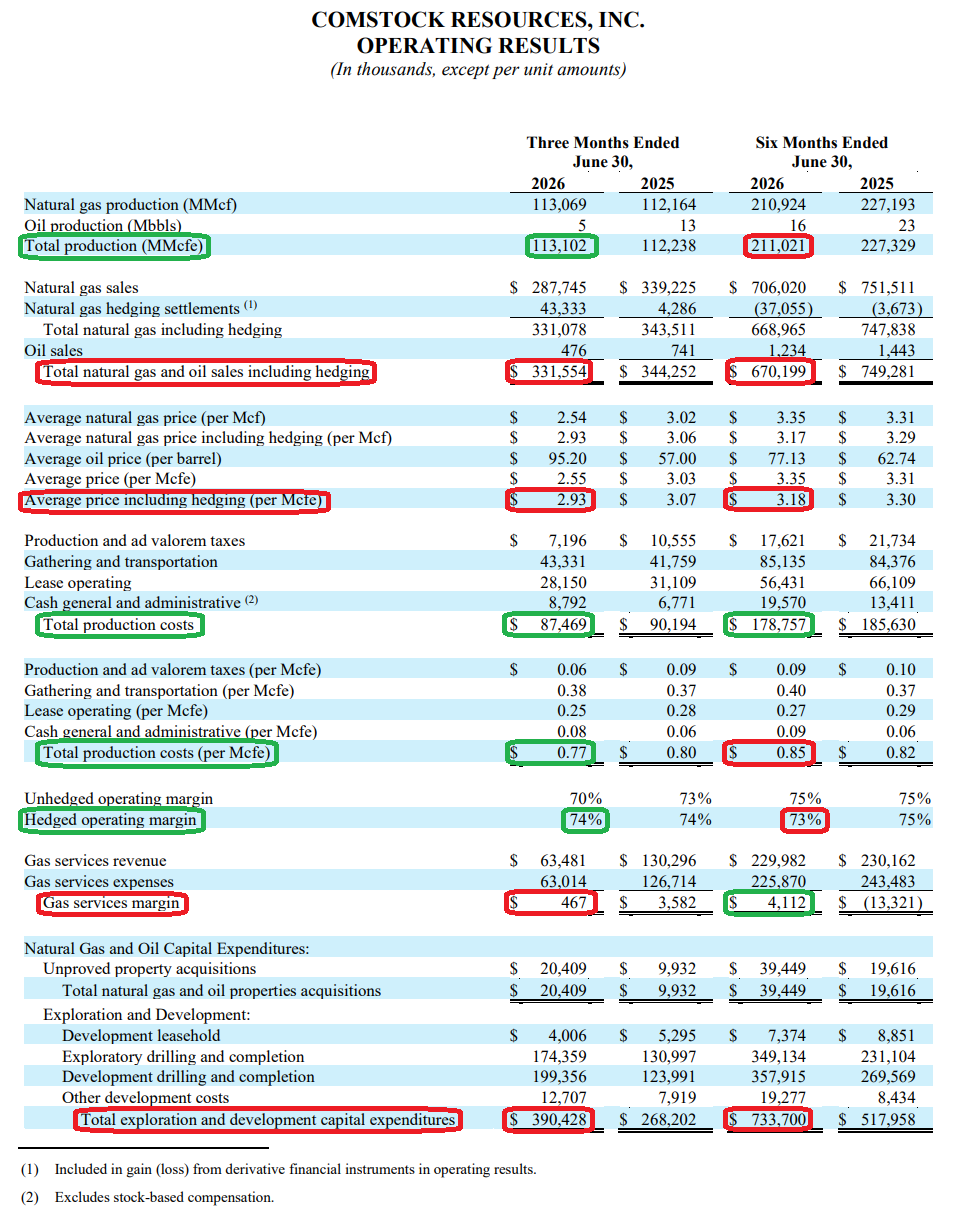
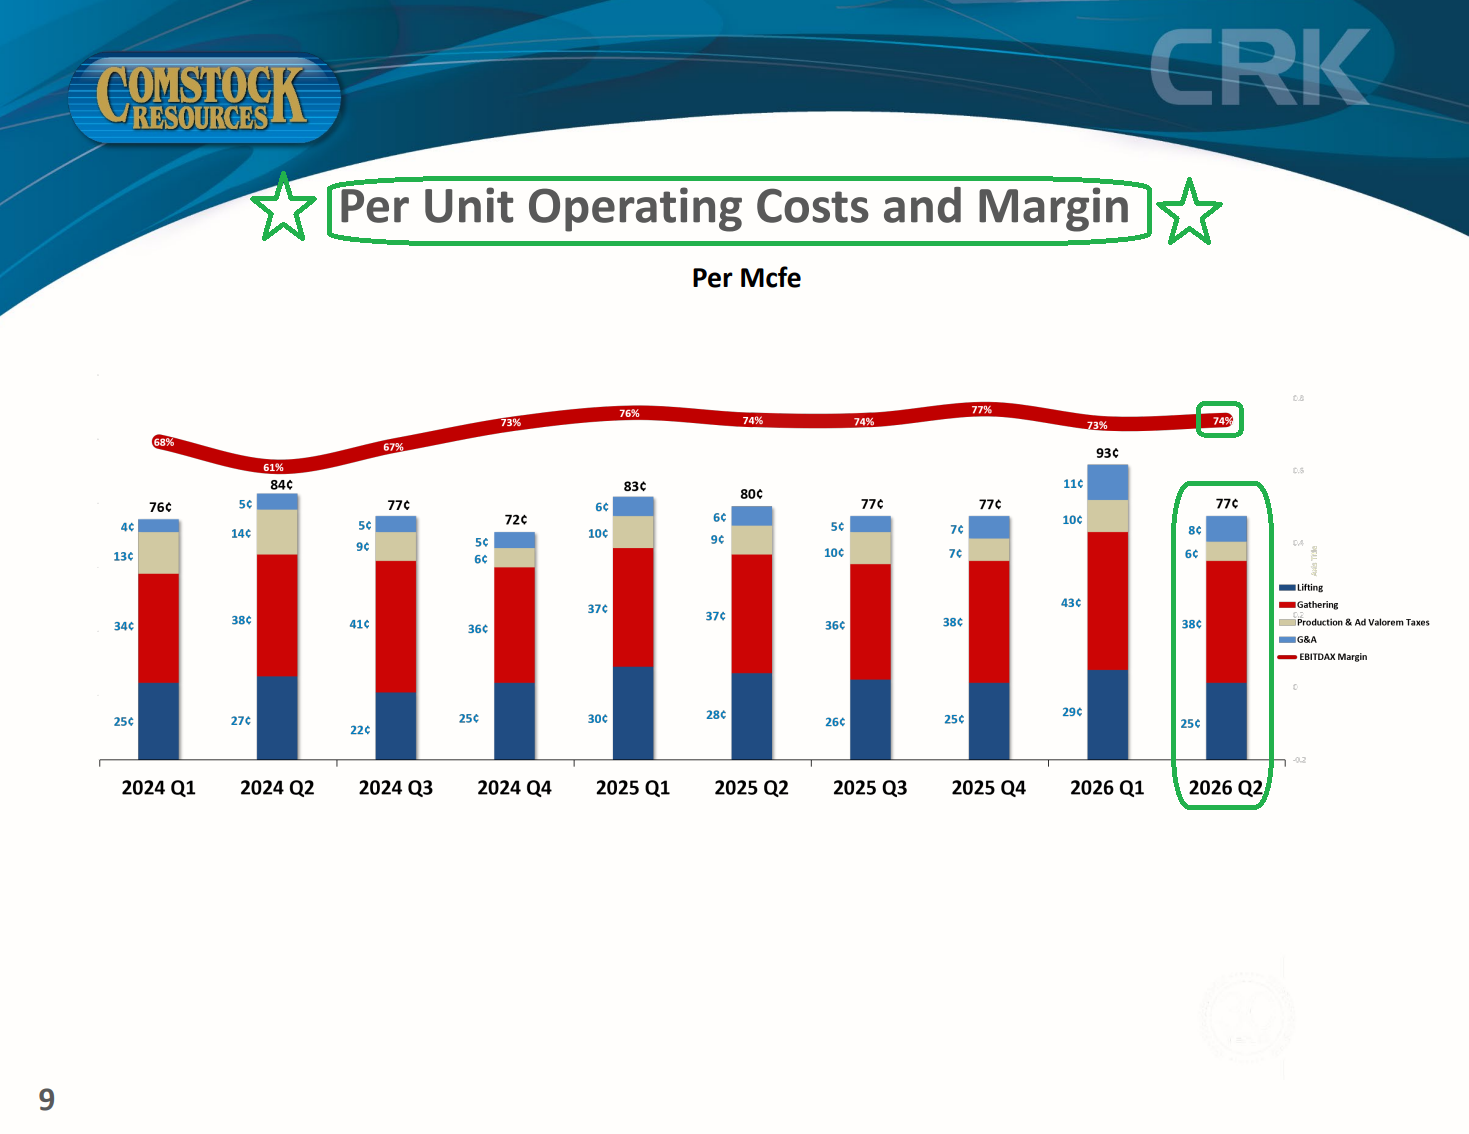
Q2 production cost $0.77/Mcfe (G&T $0.38, LOE $0.25, taxes $0.06, cash G&A $0.08) vs. $0.80/Mcfe last year, normalizing from the Q1 spike as higher volumes absorbed the largely fixed field cost base.
Unhedged operating margin 70% (vs. 73% last year), with hedged margin held at 74% (vs. 74%).
Superior price realization from proximity to Gulf Coast LNG, petrochemical, and industrial demand centers. Haynesville is the “poster child for a well-located, low-cost shale gas basin.”
FY2025 D&C costs $1,347/lateral foot (-11% Y/Y), one of the lowest in the basin.
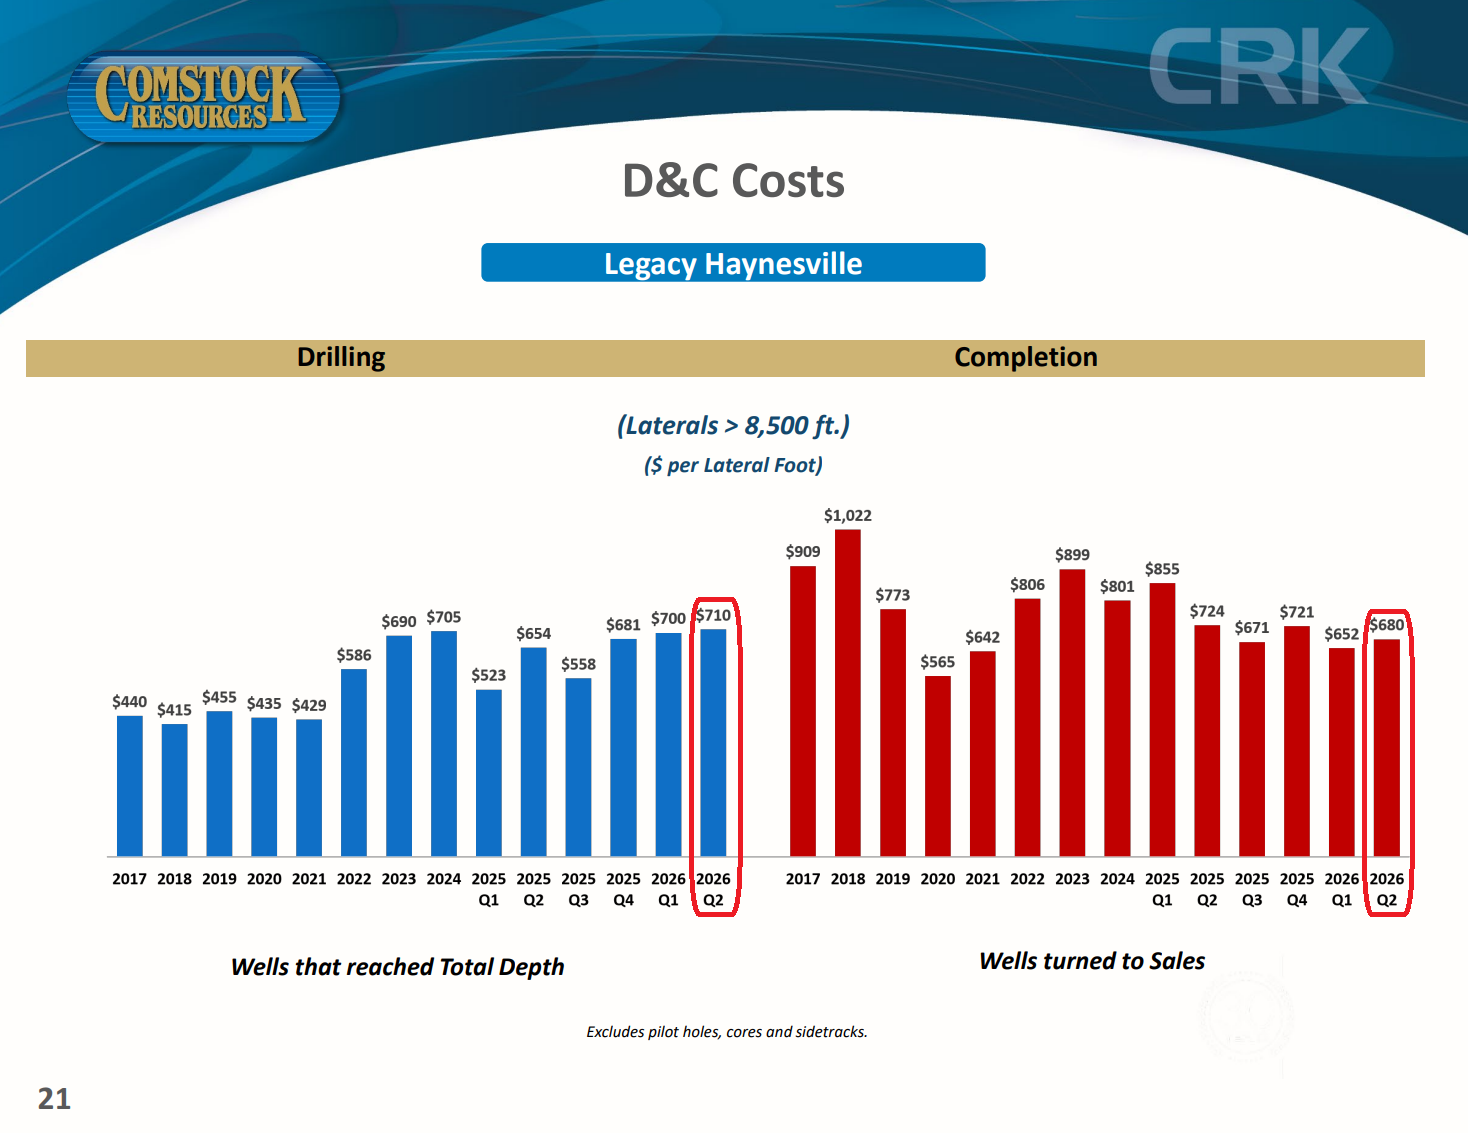
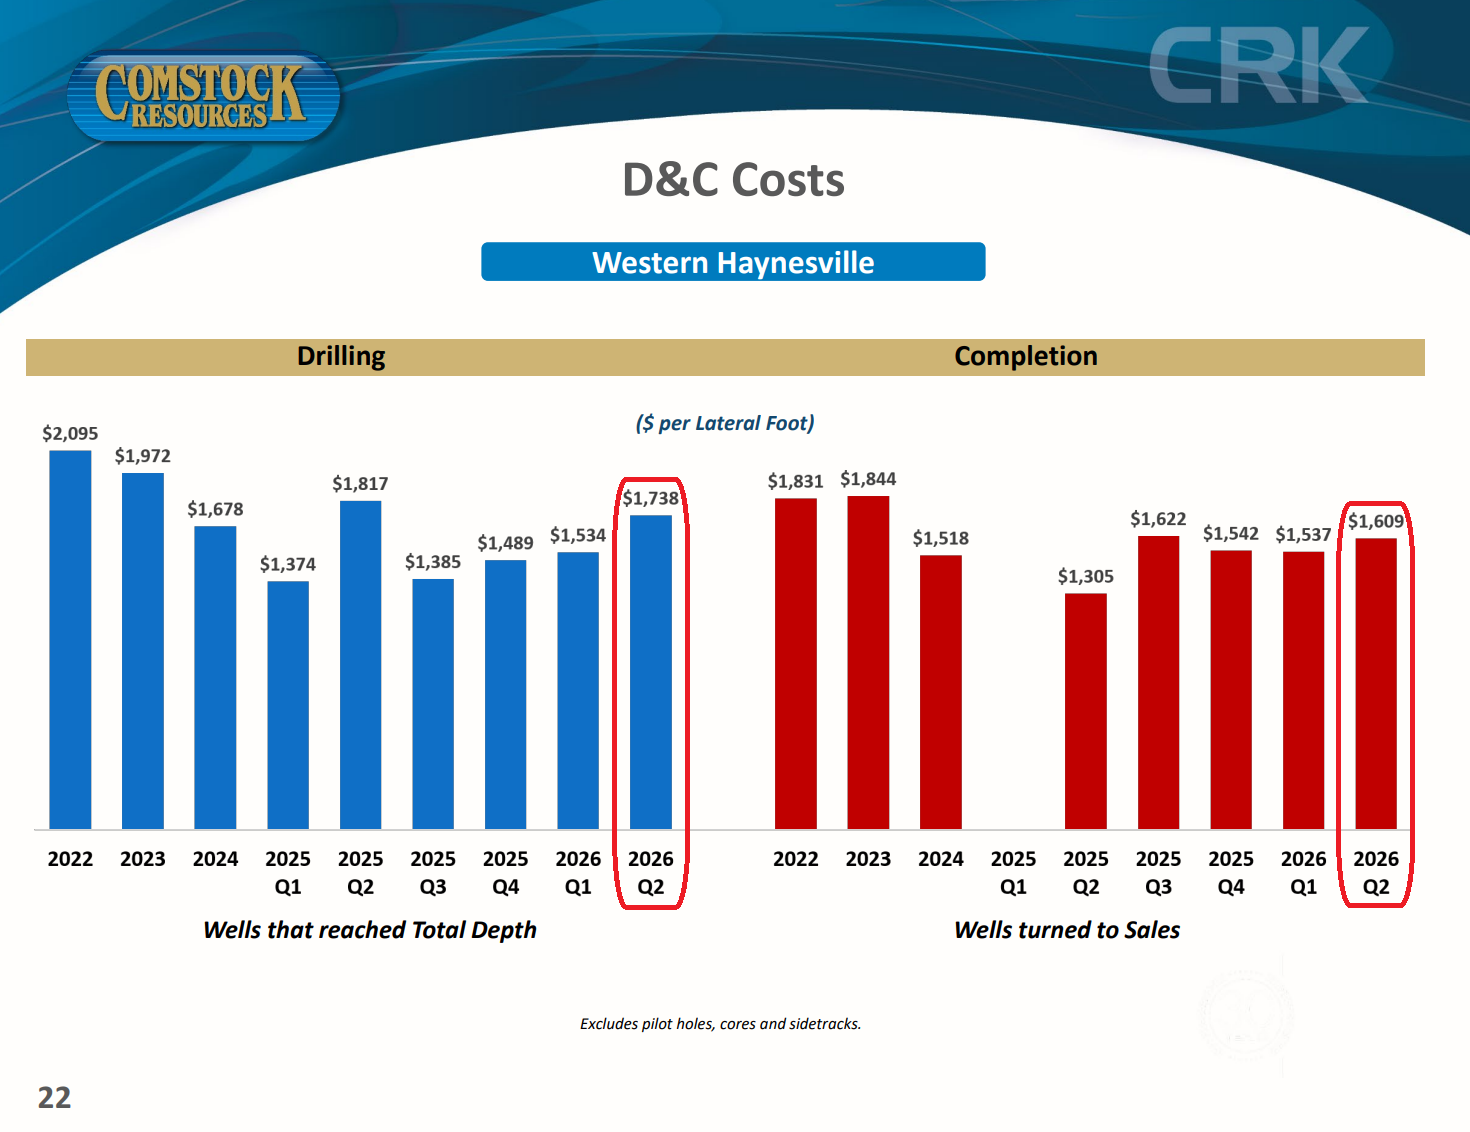
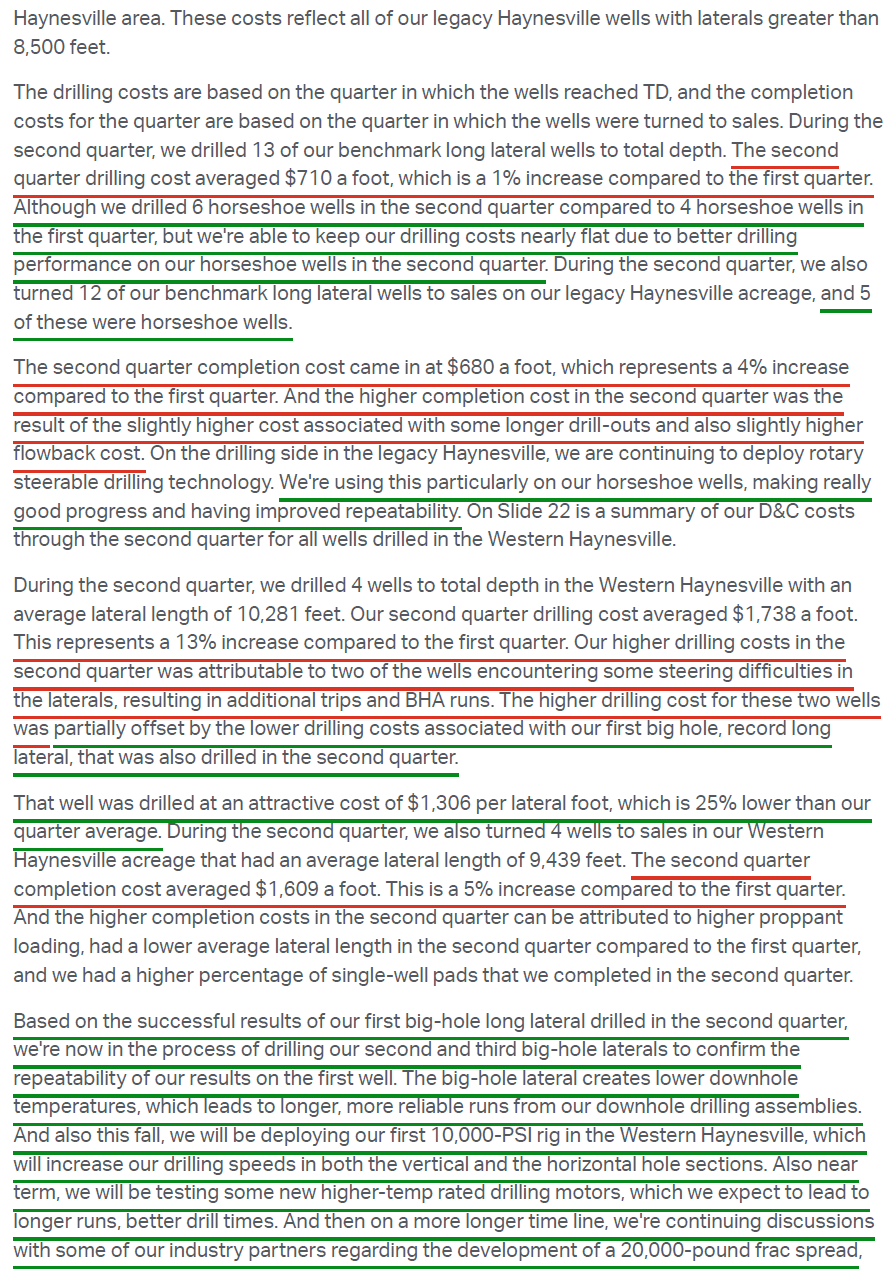
Q2 legacy drilling $710/lateral foot (+1% Q/Q) with completion $680/lateral foot (+4% Q/Q).
Western drilling $1,738/lateral foot (+13% Q/Q) with completion $1,609/lateral foot (+5% Q/Q).
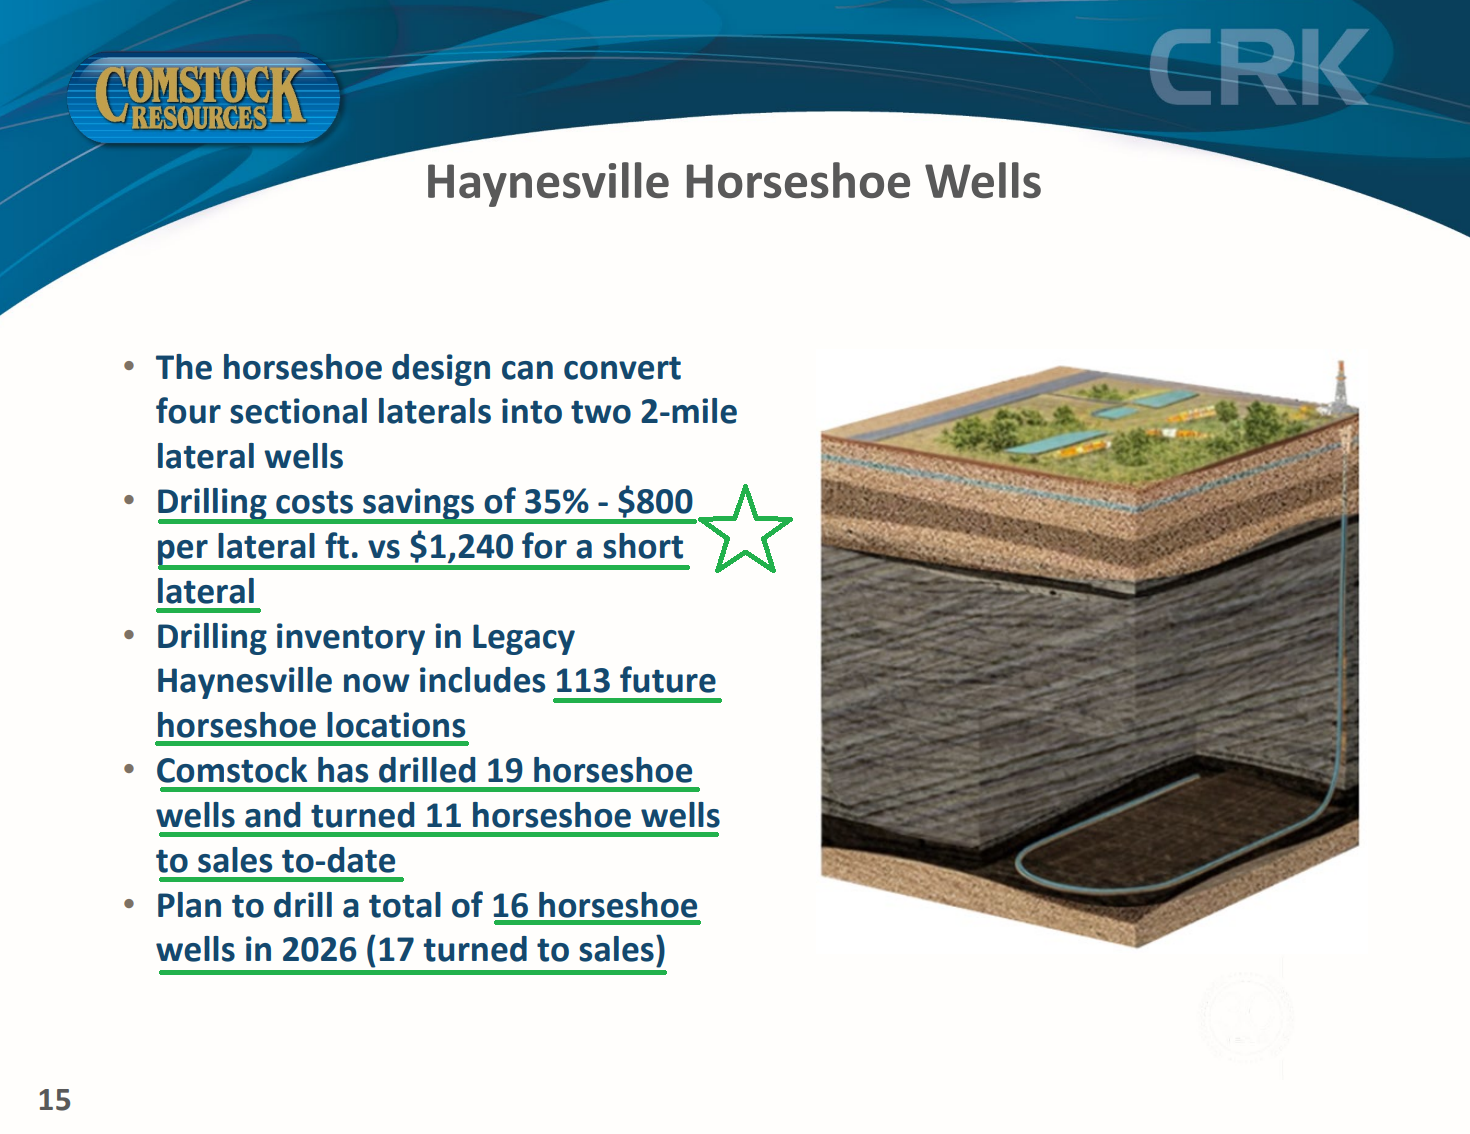
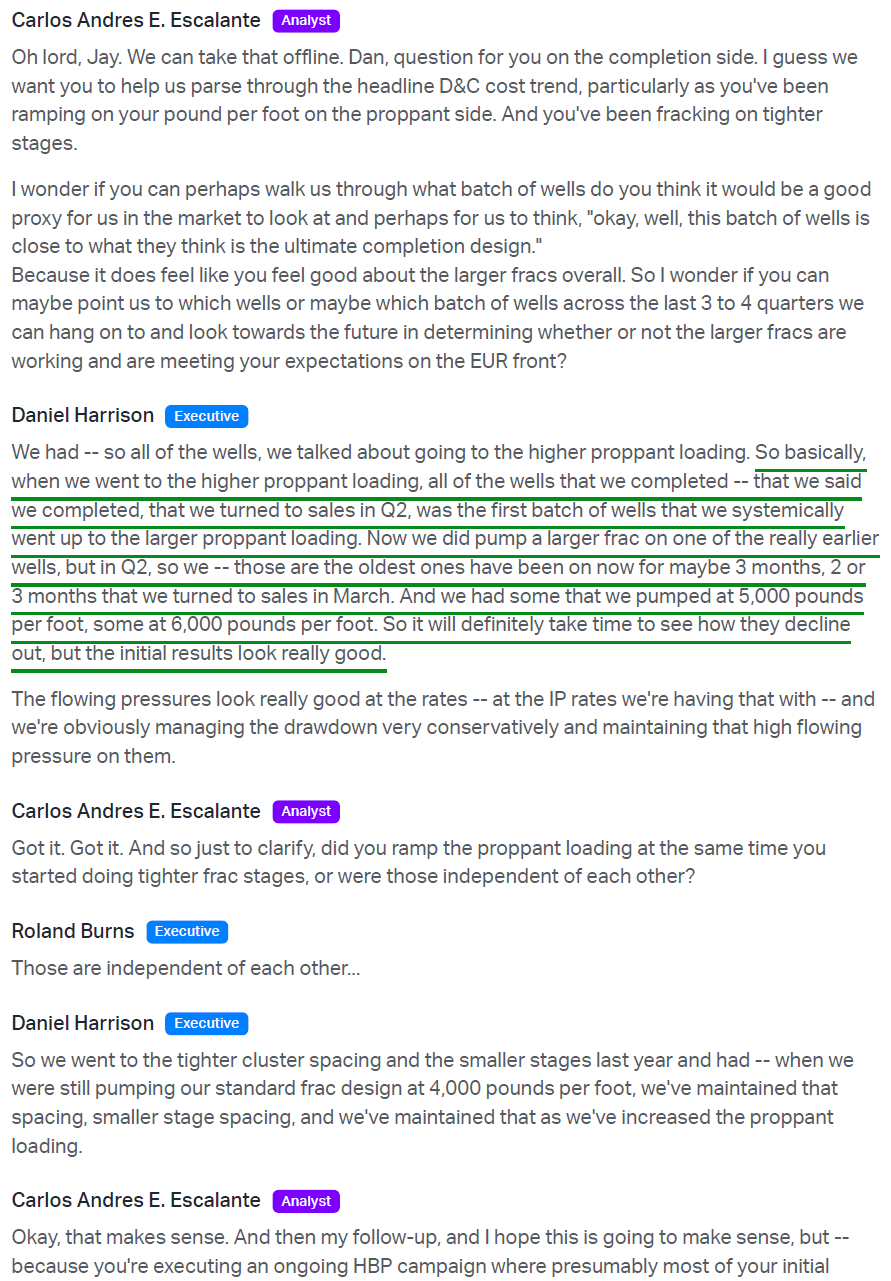
Horseshoe well design driving 35% drilling cost savings ($800/lateral ft vs. $1,240 for short laterals); 19 horseshoes drilled (11 turned to sales) to date with 16 planned for 2026 and 113 future locations booked.
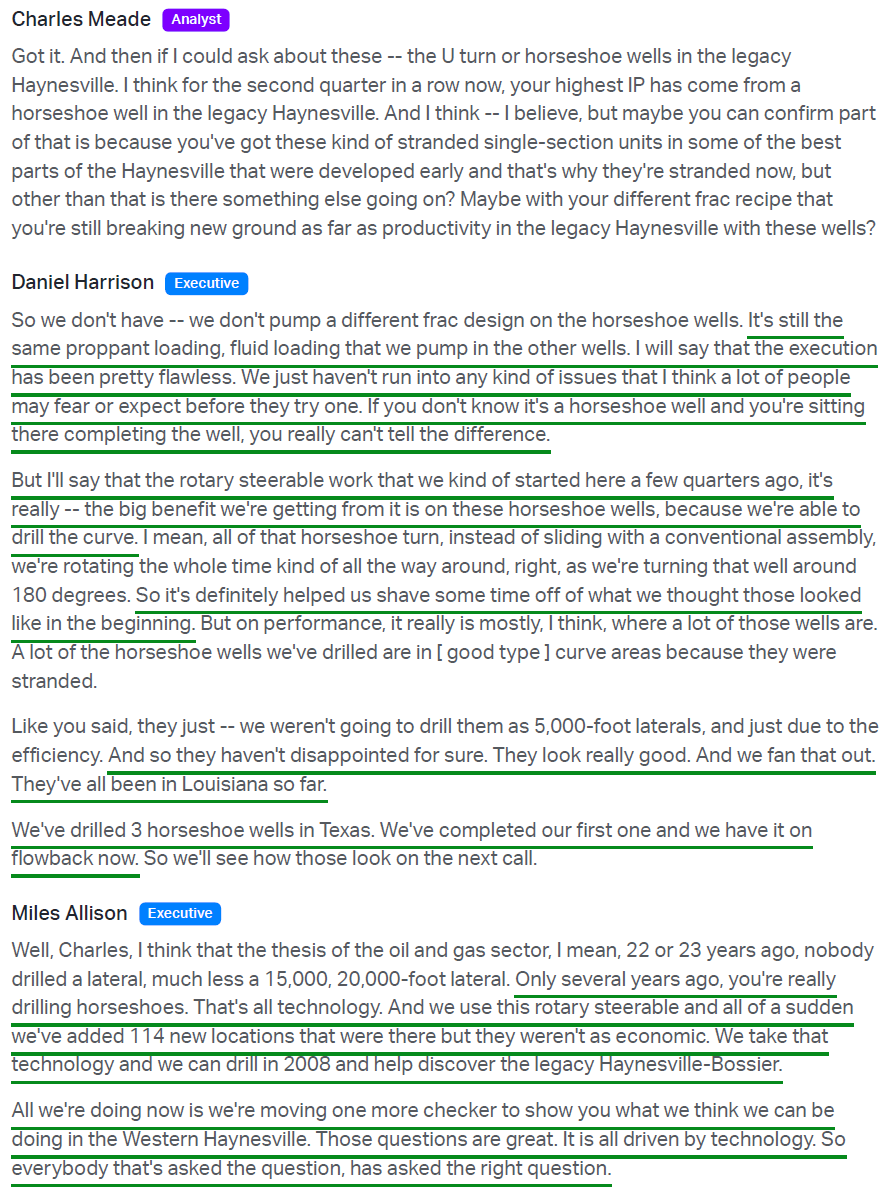
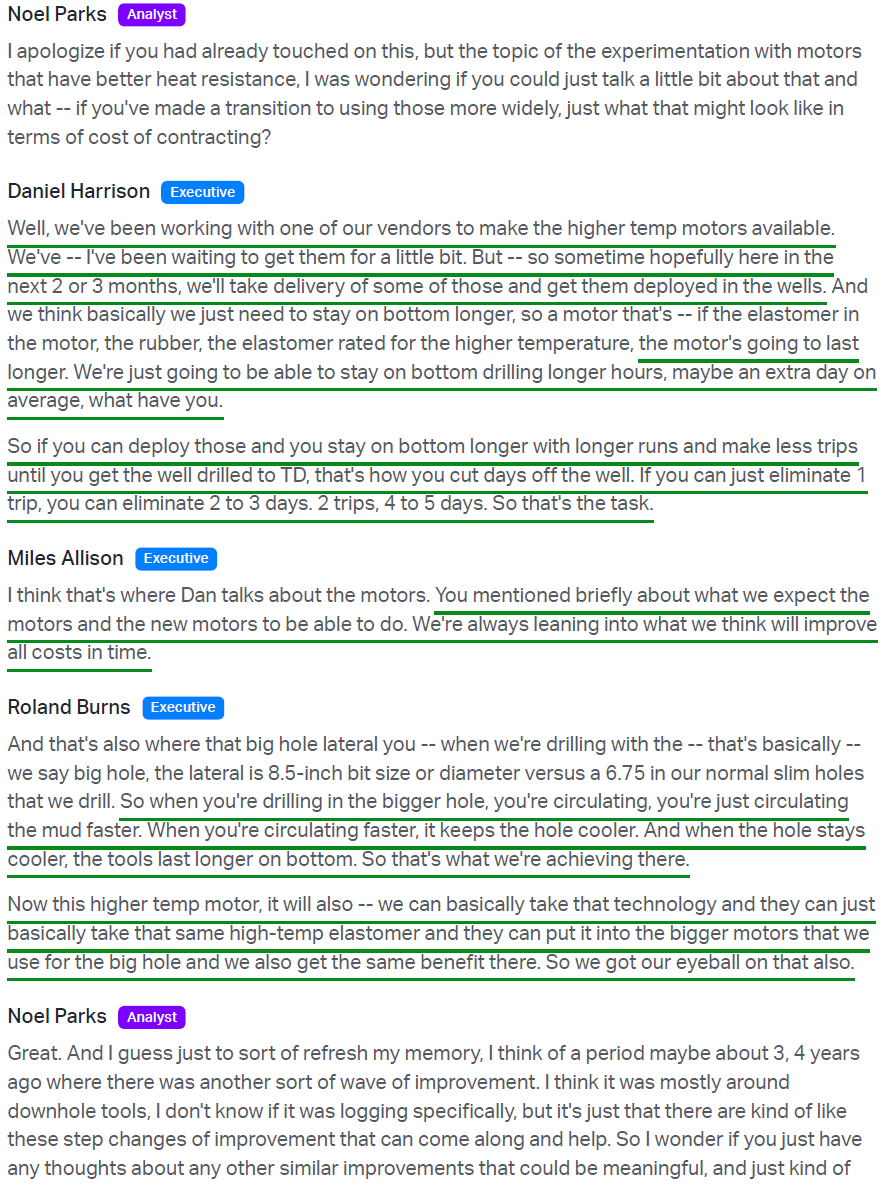
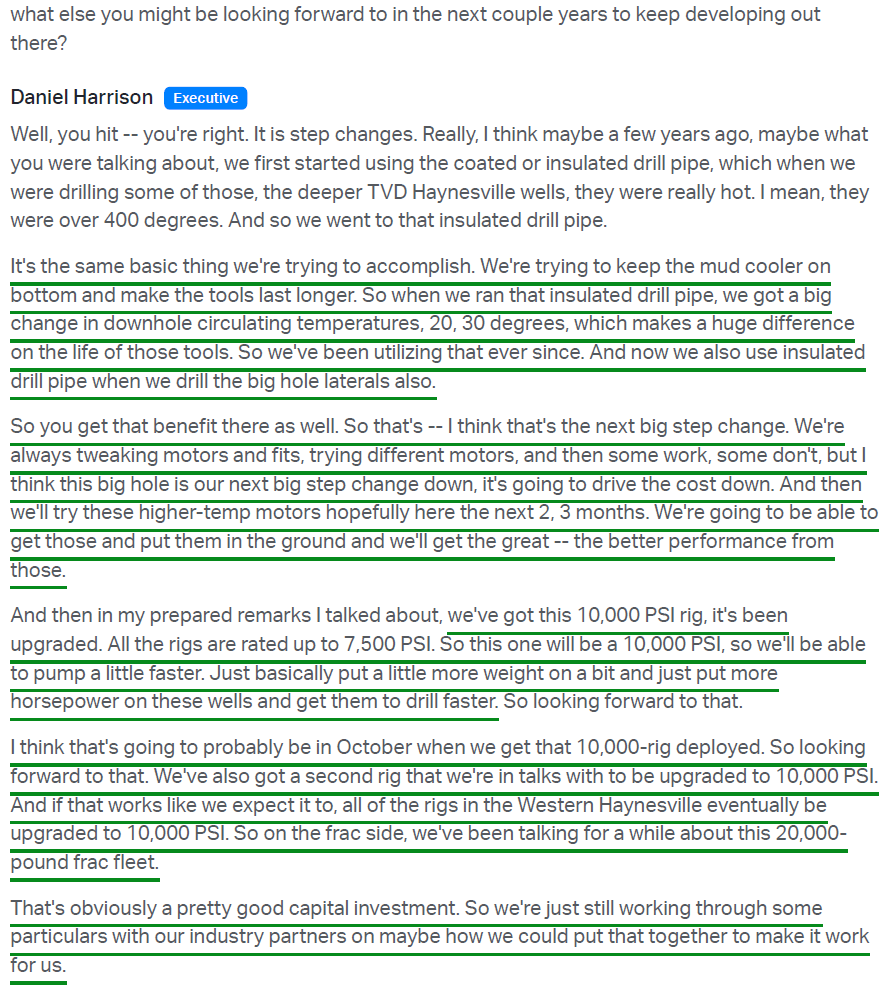
Cost initiatives ongoing: first 10,000 PSI rig deploying in October with a second in talks for the same upgrade, higher temp-rated drilling motors arriving in the next 2-3 months, rotary steerable now running in legacy (biggest benefit on horseshoe curves), and a 20,000-lb frac fleet targeted for 2027.
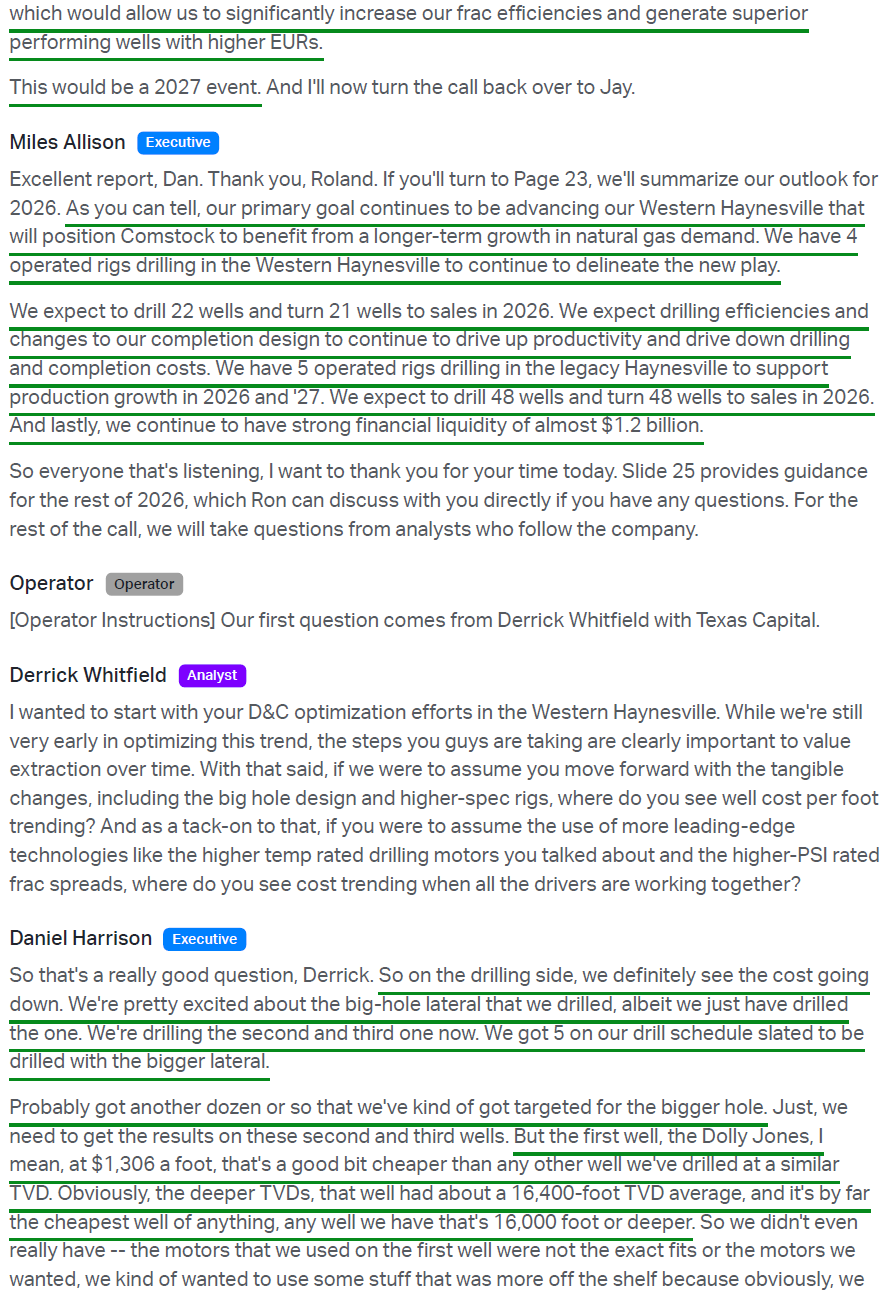
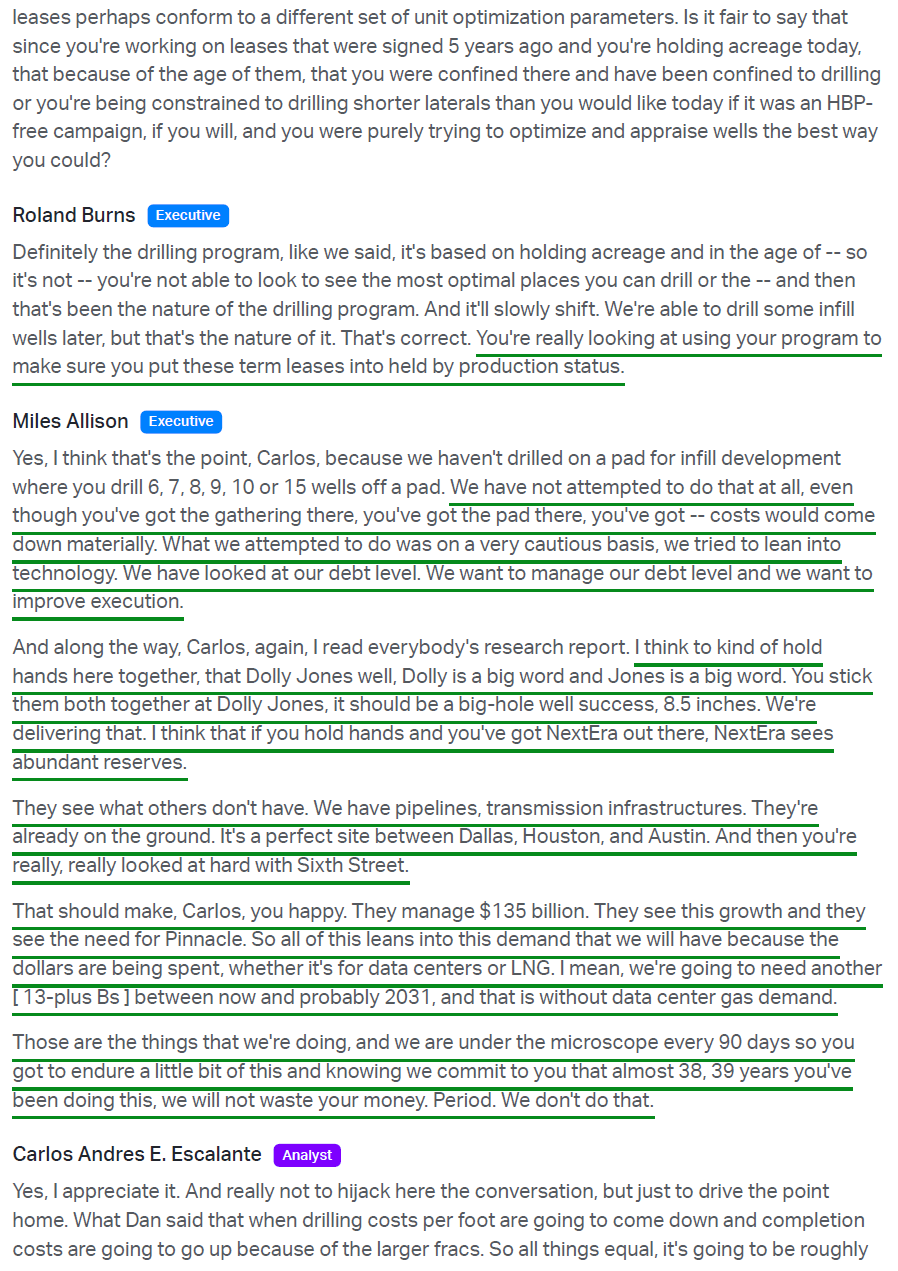
Big hole lateral design (8.5-inch vs. standard 6.75-inch slim hole) keeps downhole temperatures lower, extending tool life and improving steering. First well, the Dolly Jones, drilled at $1,306/lateral foot, ~25% below the Western quarterly average and the cheapest of any well drilled below 16,000 feet. Two more underway to confirm repeatability, with ~a dozen targeted and management expecting most future Western wells to adopt the design.
Proved Reserves + Western Haynesville
Proved reserves: 7.0 Tcfe at end-2025 under SEC rules and 7.2 Tcfe at year-end NYMEX prices (up from 3.8 Tcfe SEC at end-2024).
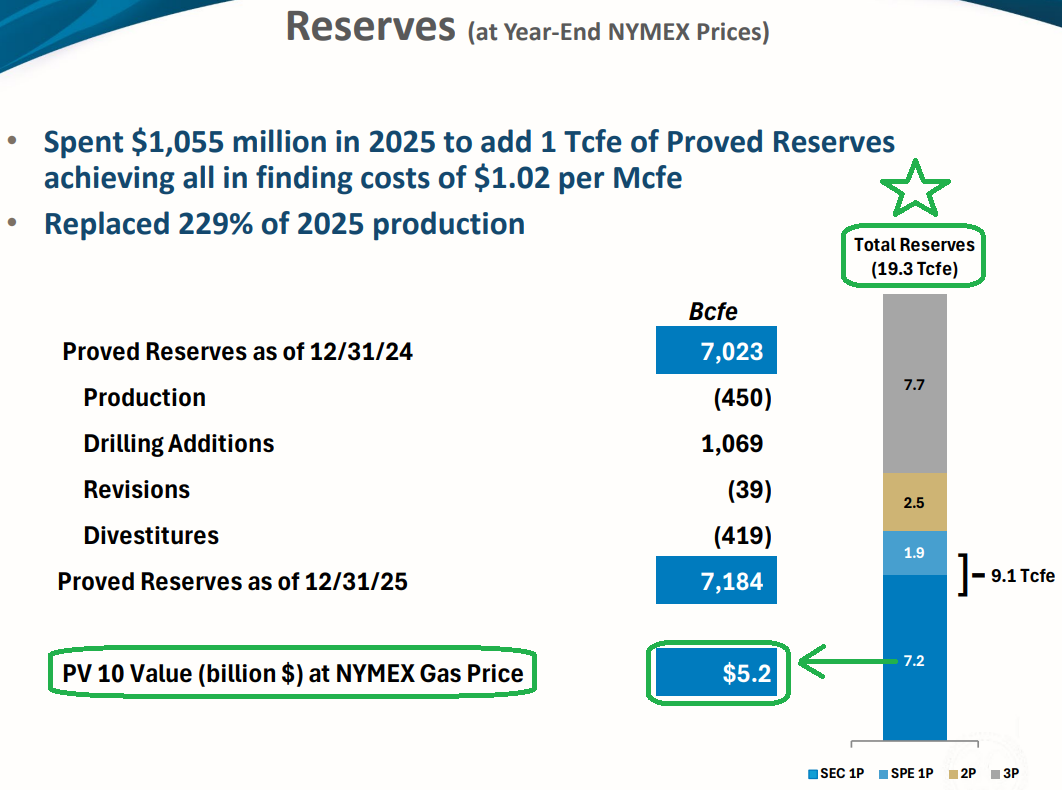
PV-10 ~$4.5B at SEC pricing and $5.2B at NYMEX. Added 1 Tcfe of proved reserves in 2025 at all-in finding costs of $1.02/Mcfe, replacing 229% of production.
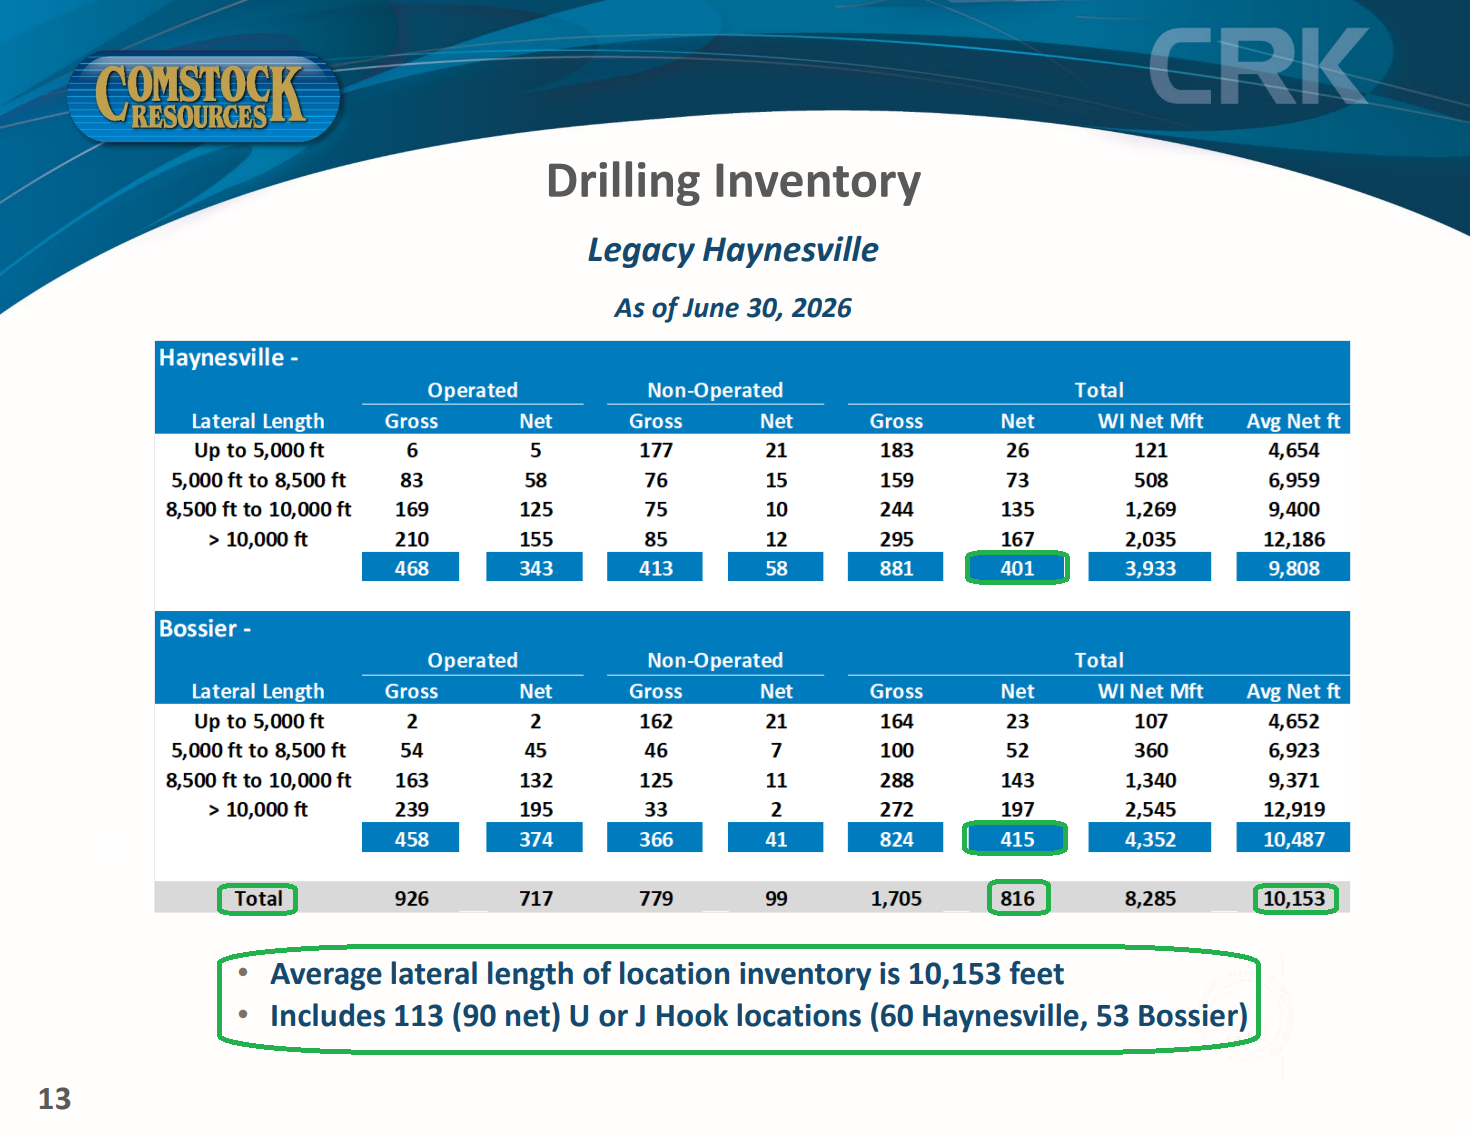
Total reserves: 19.3 Tcfe (7.2 SEC 1P, 1.9 SPE 1P, 2.5 2P, 7.7 3P), supporting >30 years of drilling activity. Total inventory: 3,344 net locations.
The $5.2B PV-10 values only 7.2 of the 19.3 Tcfe resource base, or ~37%. The other 12.1 Tcfe carries zero dollars in that figure.
Does not include substantial reserve potential in much of the Western Haynesville acreage (only 5.4 Tcfe booked). Legacy + Western estimated recoverable reserves: ~174 Tcfe (75 Tcfe legacy + 99 Tcfe Western). Management sees $100B+ PV in Western alone.
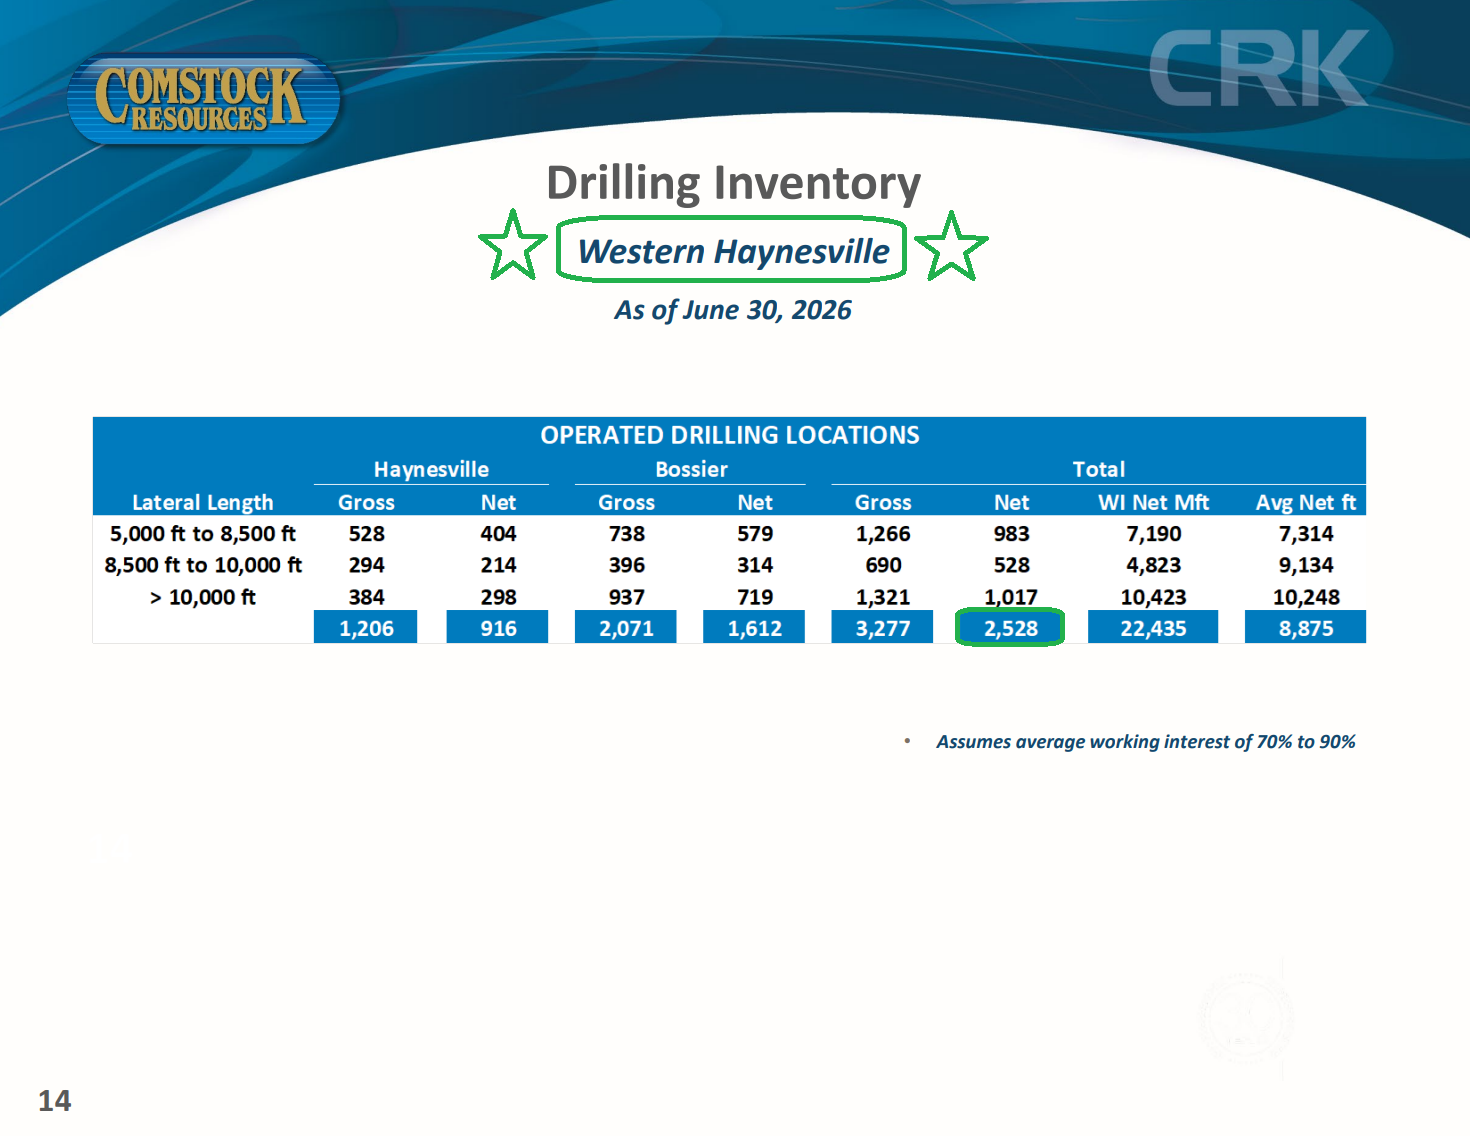
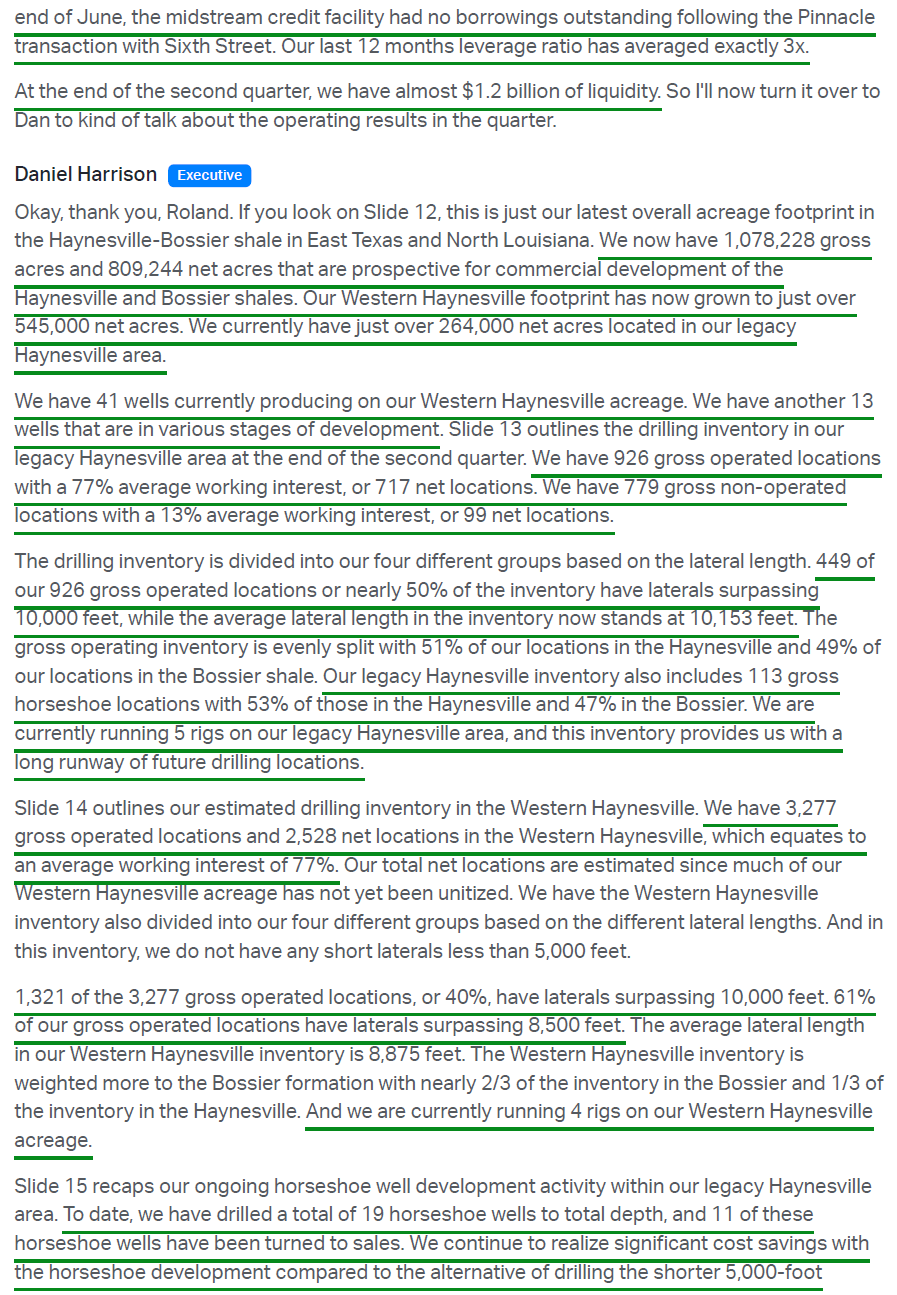
Western Haynesville footprint: 545,190 net acres with 2,528 net locations (vs. 816 legacy). The “holy grail” asset, expected to yield significantly more resource potential per section than legacy Haynesville, with as much as 2,000 feet of pay versus ~200 feet typical elsewhere. 41 wells now producing, 50 drilled to total depth.
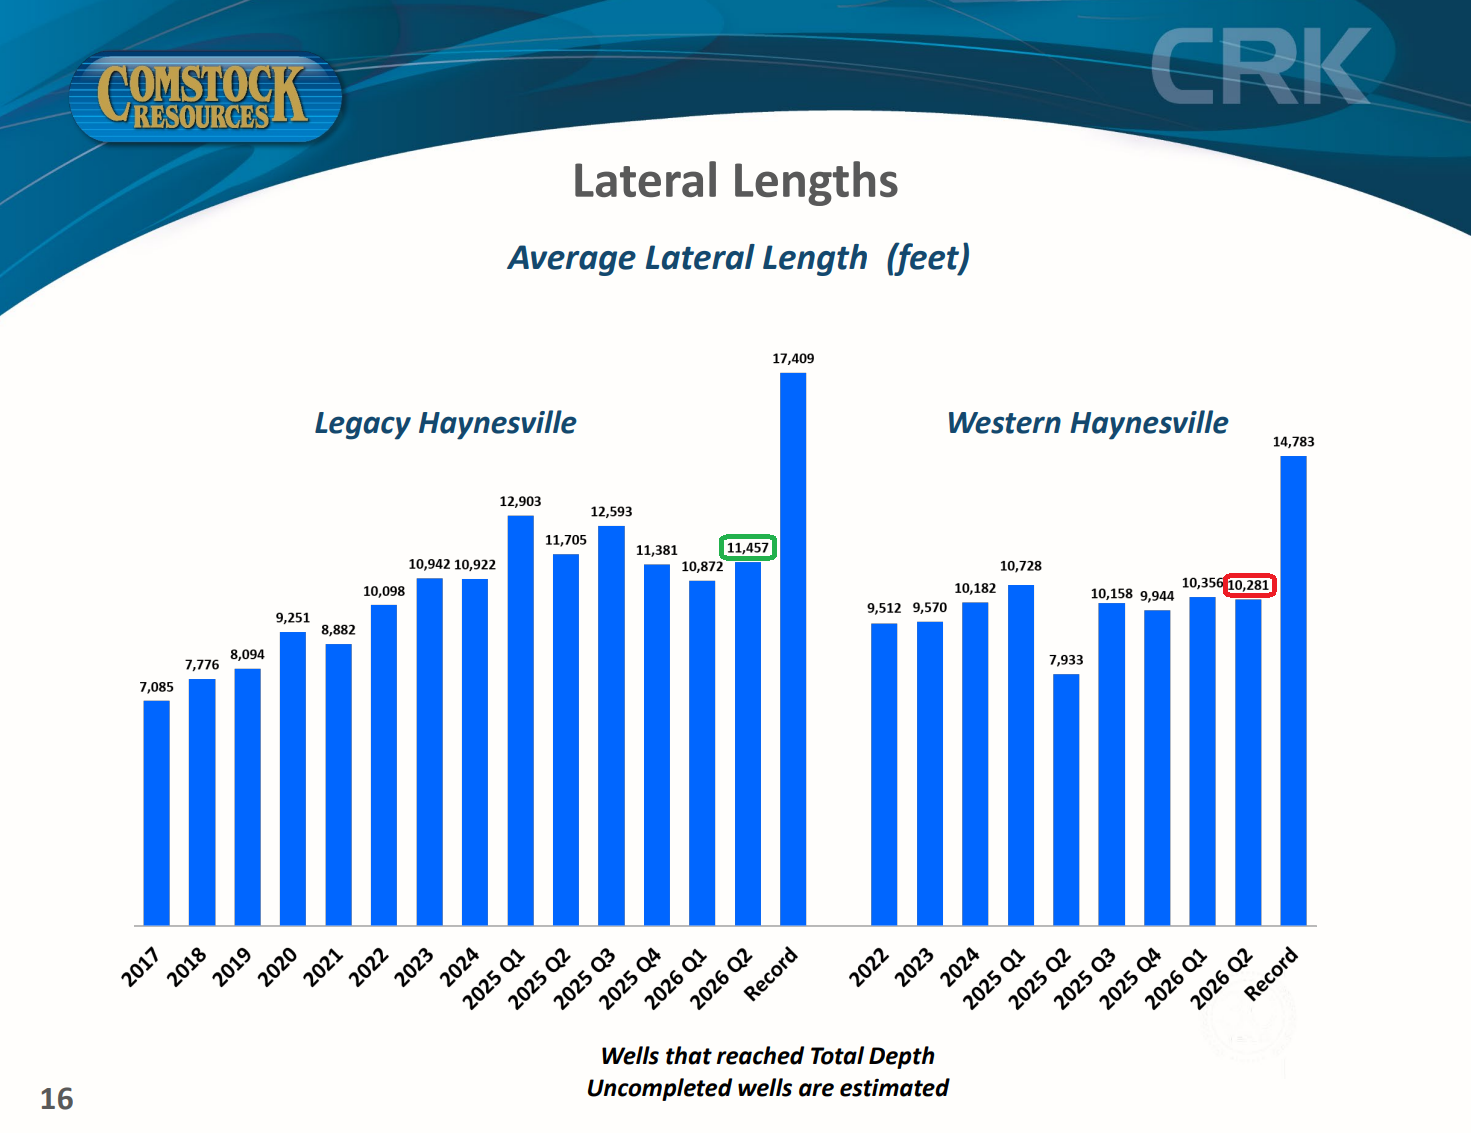
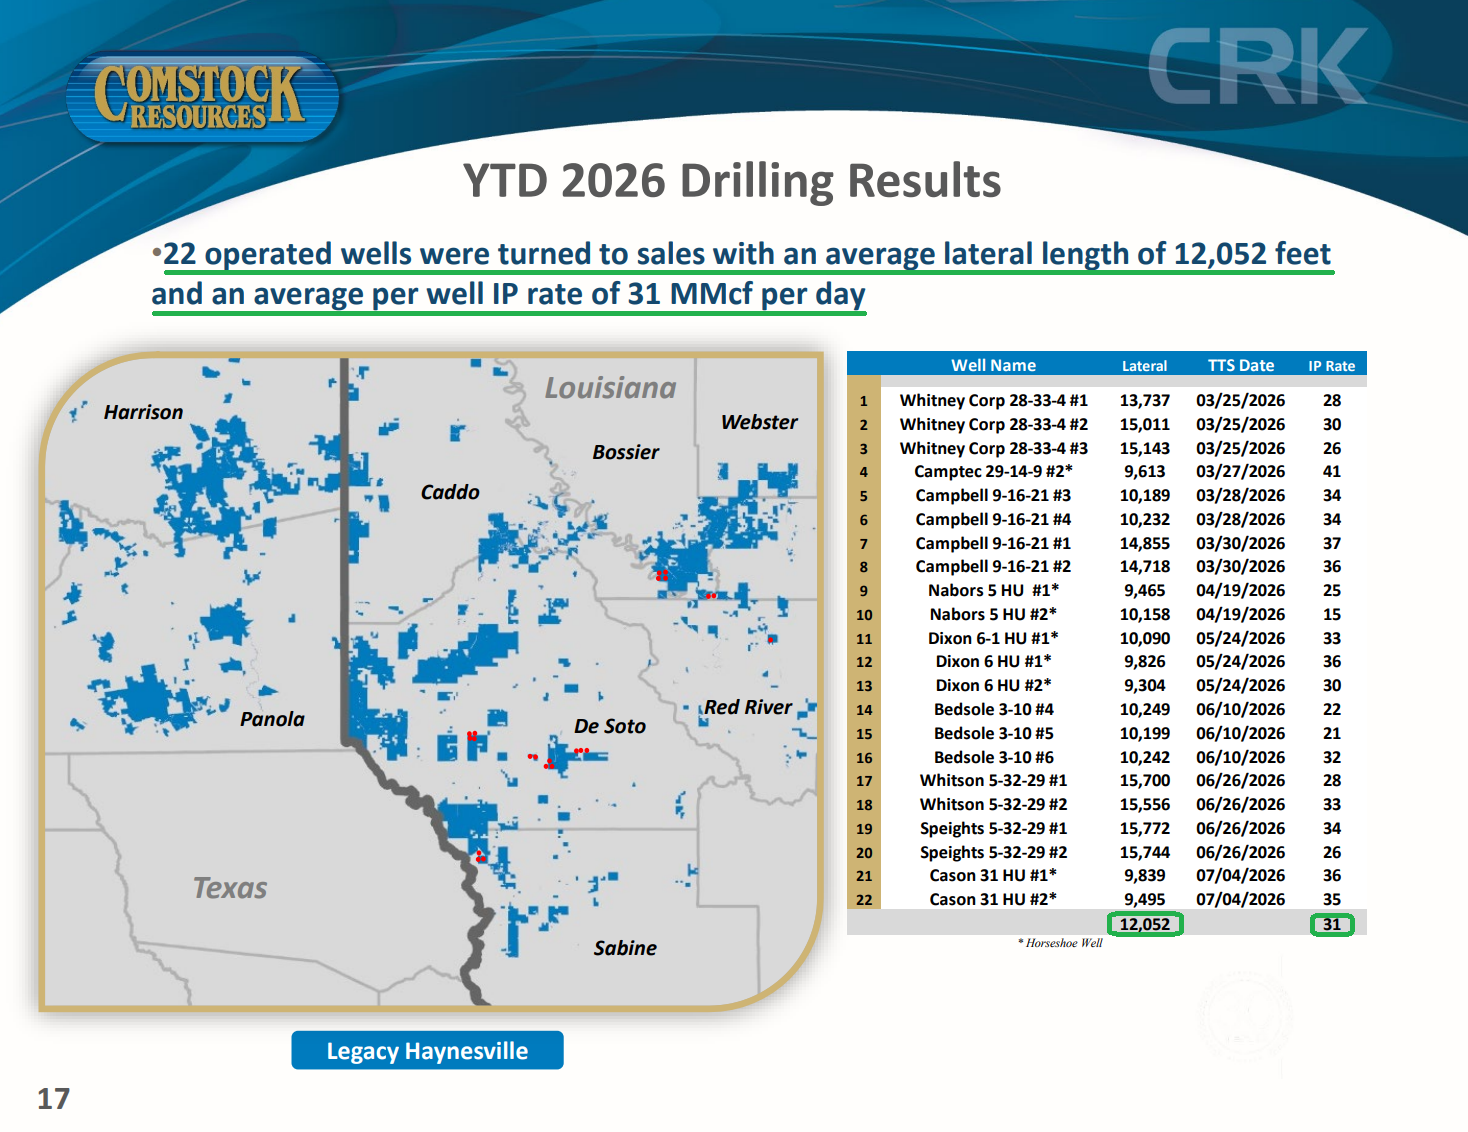
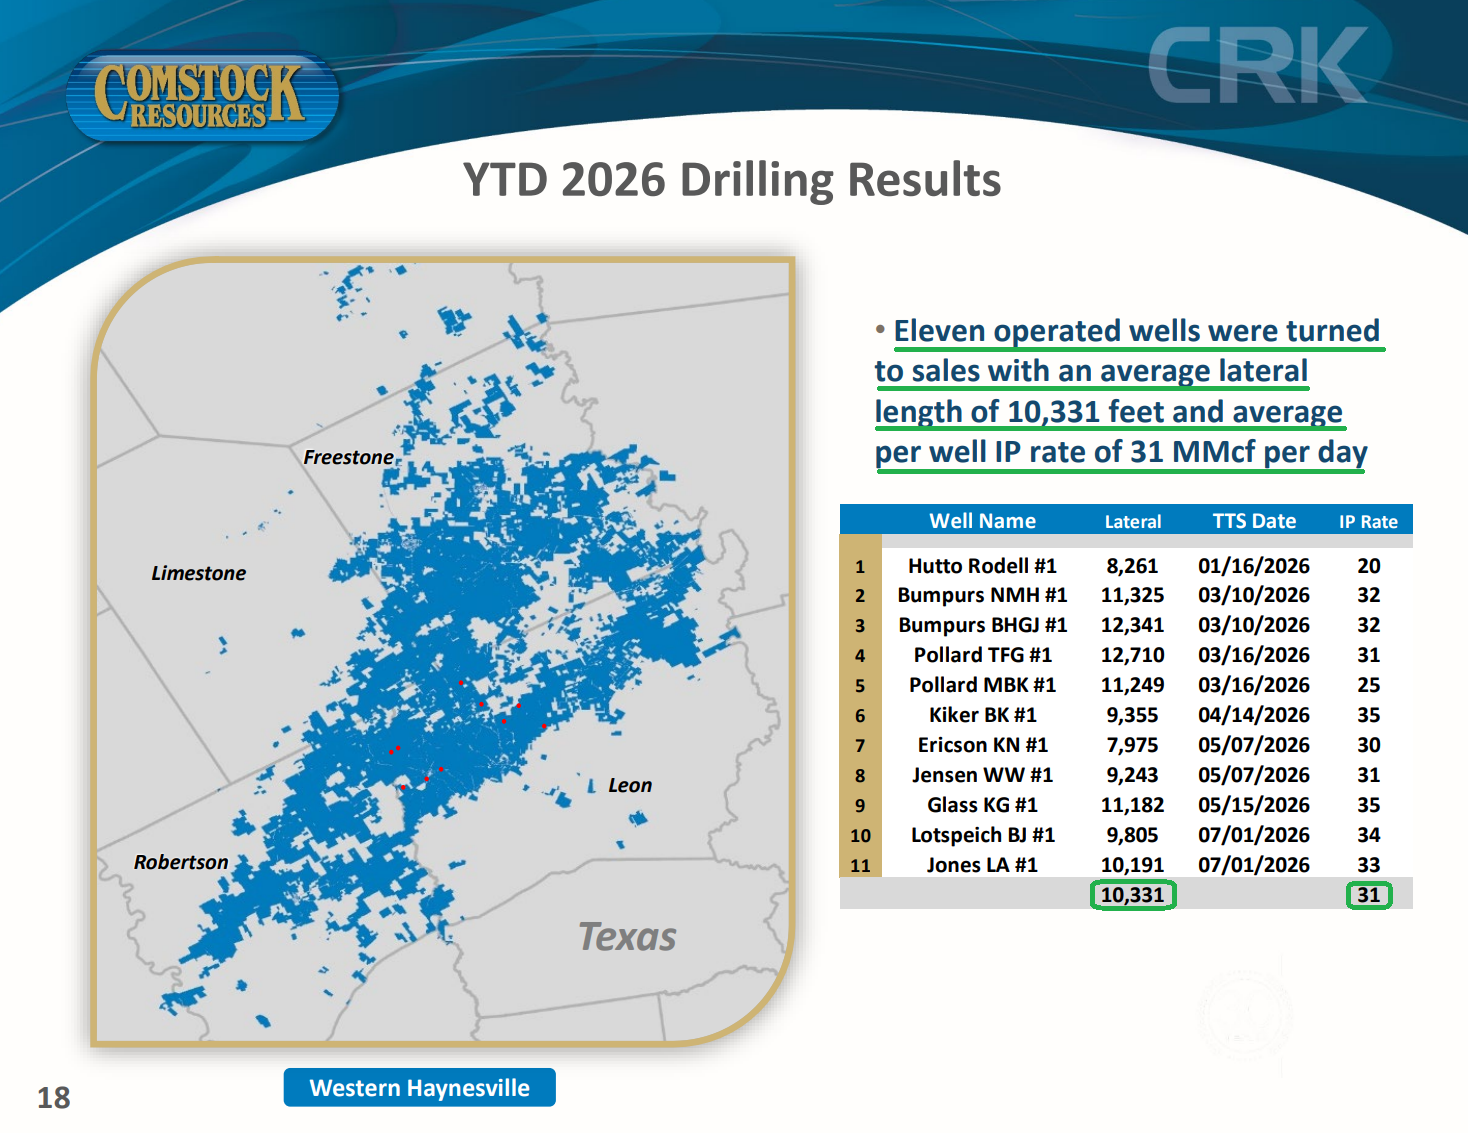
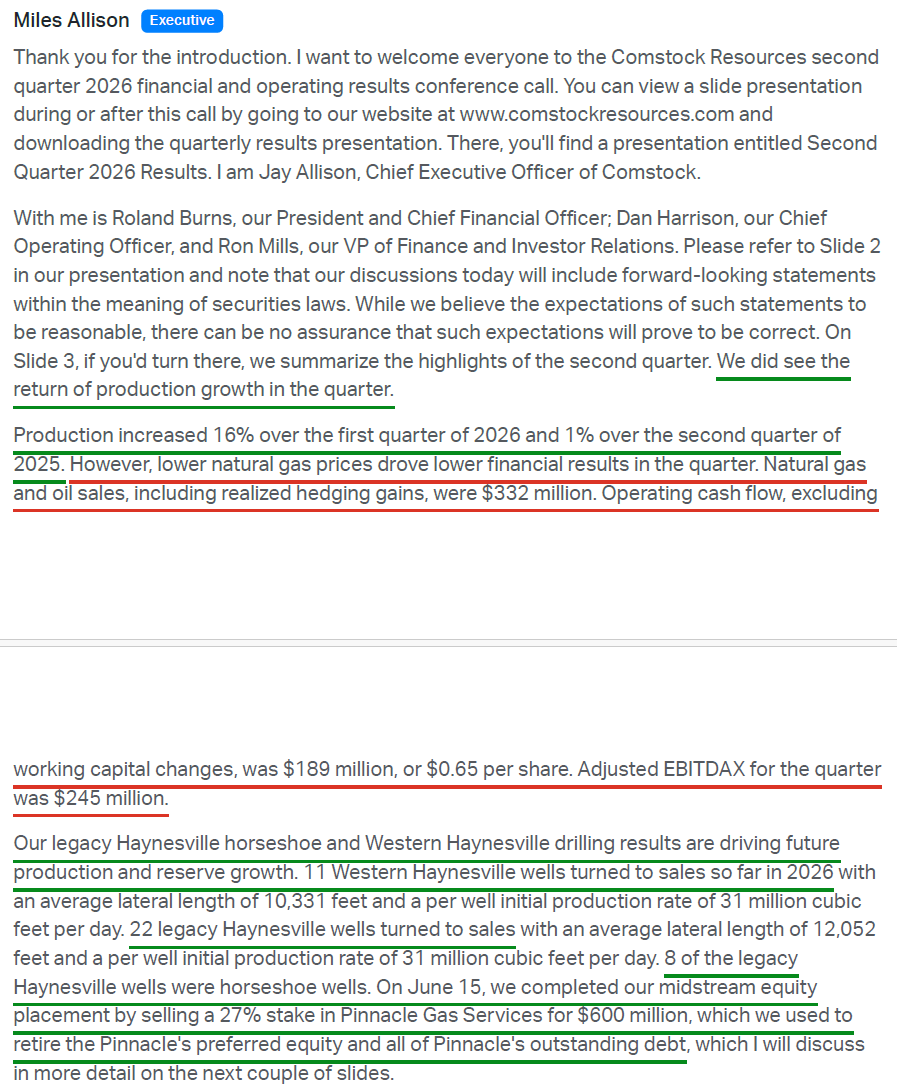
Q2 drilling: turned 17 operated wells to sales, 12 Legacy Haynesville wells averaging 11,835 feet and 31 MMcf/d IP rate, and 5 Western Haynesville wells averaging 9,679 feet and 33 MMcf/d IP rate.
YTD Western wells average 31 MMcf/d with the last five ranging 30-35 MMcf/d as results tighten across the play.
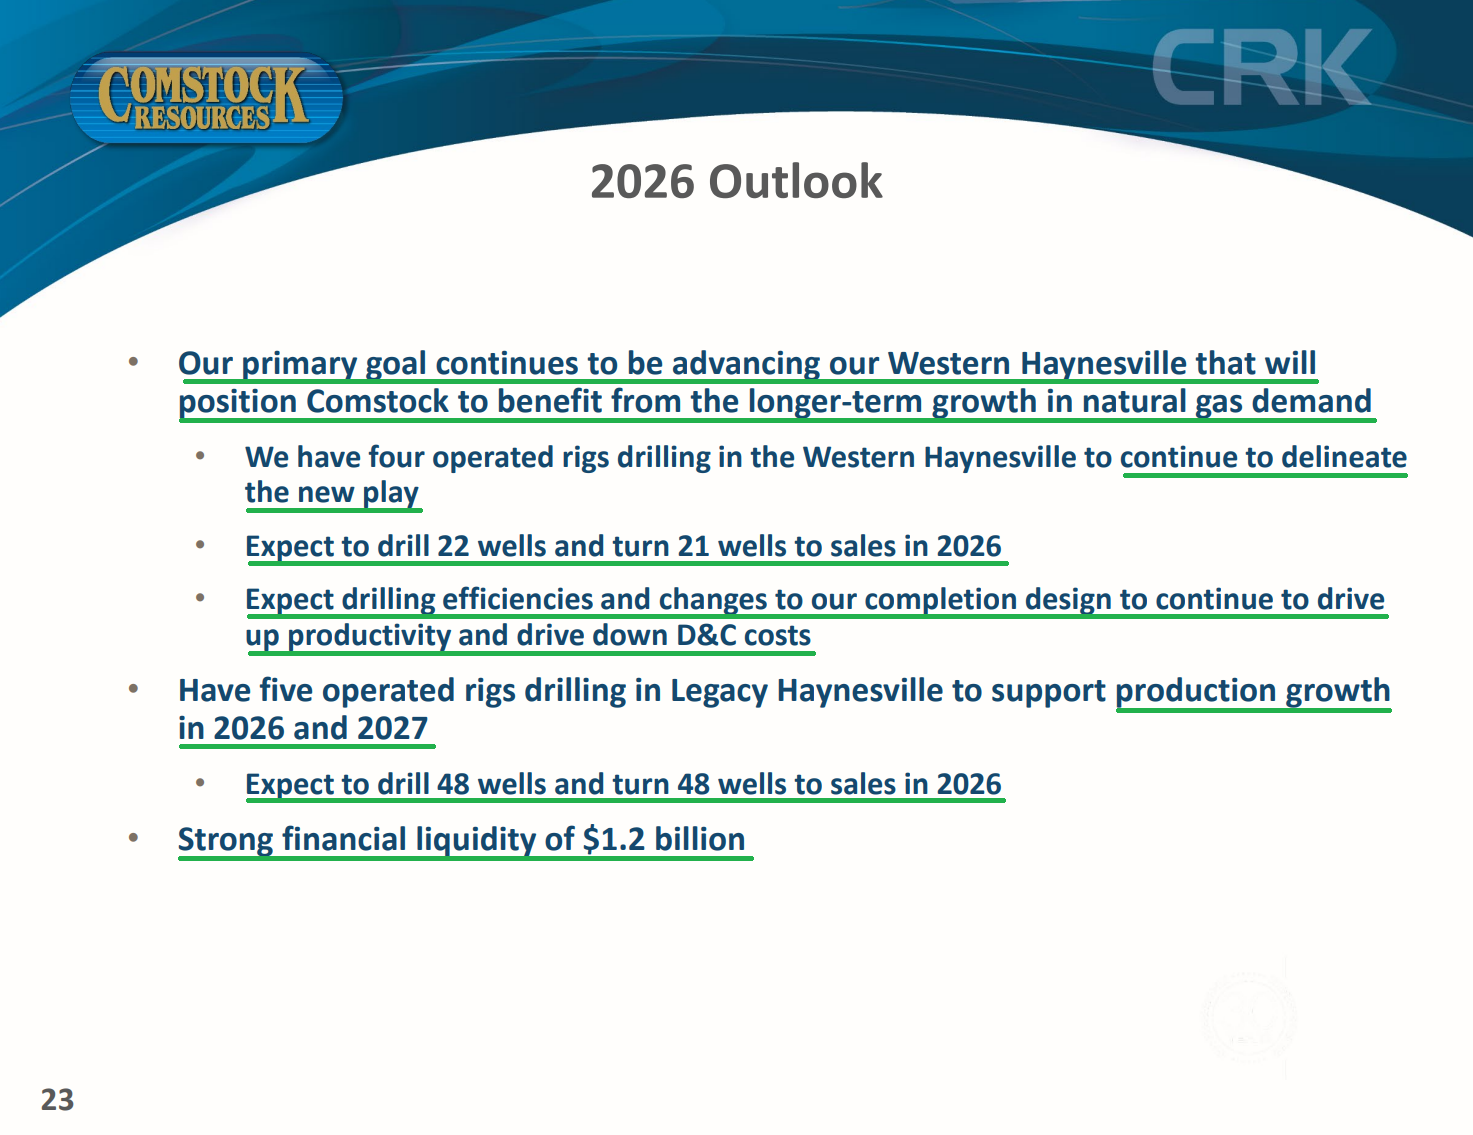
Plan to drill 48 Legacy Haynesville wells (48 TTS) and 22 Western Haynesville wells (21 TTS) in 2026 across nine operated rigs (5 Legacy, 4 Western).
Natural Gas Demand
“I don’t believe we have ever seen a brighter future for natural gas.” — CRK management. A structural U.S. nat gas super cycle is underway.
LNG exports: the U.S. is #1 globally and the first country to export over 100M metric tons of LNG in a single year (110 total). U.S. export capacity is projected to expand by ~25 Bcf/d over the next decade, with LNG demand forecast rising from 19 Bcf/d in 2025 to 32 Bcf/d by 2028.
Industrial gas demand expected to grow ~8 Bcf/d through 2050, with pipeline exports to Mexico up ~2 Bcf/d over the same period.
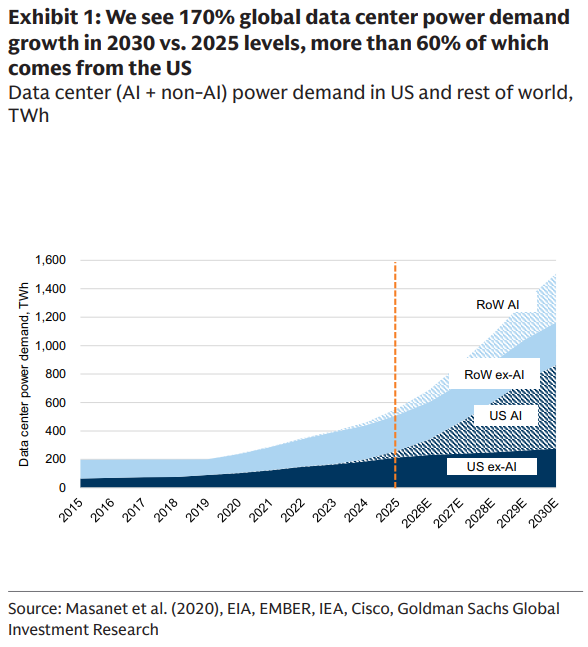
Data center demand: global data center power demand could rise ~170% by 2030 from 2025 levels (Goldman Sachs (GS)), with gas supplying ~60% of that load. Natural gas already supplies over 40% of U.S. data center electricity.
Data center demand is expected to rise from 5% to ~12% of U.S. electricity use by 2030, with global demand reaching 1,596 TWh by 2035.
BloombergNEF now expects gas to supply 69% of the power needed by new grid-connected facilities, up from a prior ~60% assumption. The power sector becomes the second-largest driver of U.S. gas demand through 2035, trailing only new Gulf Coast LNG terminals.
Combined demand growth of ~3 Bcf/day annually through 2030 from LNG and data centers.
Power Generation Hub Catalyst
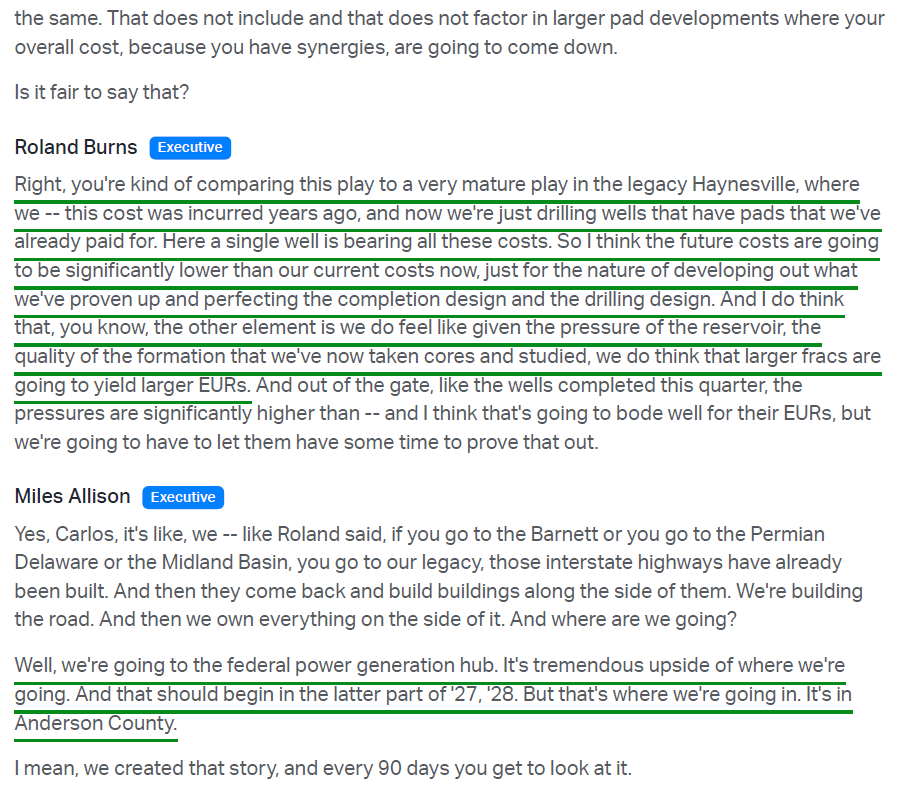
Western Haynesville selected by the U.S. Department of Commerce (March 19, 2026) to host the $16B Texas Natural Gas-Fired Power Generation Hub, announced as part of the U.S.-Japan trade deal and Japan’s $550B U.S. investment commitment.
The Anderson County facility will have up to 5.2 GW of dispatchable gas-fired generation capable of serving up to 5 GW of large-load demand from data centers and advanced manufacturing, jointly owned by Japan and the U.S. and built/operated by NextEra (NEE), a Comstock partner since 2015.
Located in the rapidly growing ERCOT market, taking advantage of Comstock’s gas supply and existing transmission infrastructure at Bethel, Texas.
CRK does not own the surface and carries no construction obligation. It supplies the natural gas, with potential to reach ~1 Bcf/d by 2031, nearly as much gas as the entire company produced in Q1, from a single customer.
SOCAR Partnership + Jones Drilling Venture
On September 1, 2026, Comstock announced a $1.65B cash strategic partnership with SOCAR, structured as a binding letter of intent with a definitive agreement targeted by October 31, 2026 and closing by year-end.
SOCAR acquires a 20% non-operated working interest in Comstock’s Legacy Haynesville upstream assets, a 15% non-operated working interest in Western Haynesville upstream assets, and 15% of Comstock’s 73% stake in Pinnacle Gas Services.
SOCAR’s 15% Western interest reverts to 7.5% after five years once it achieves a 15% return.
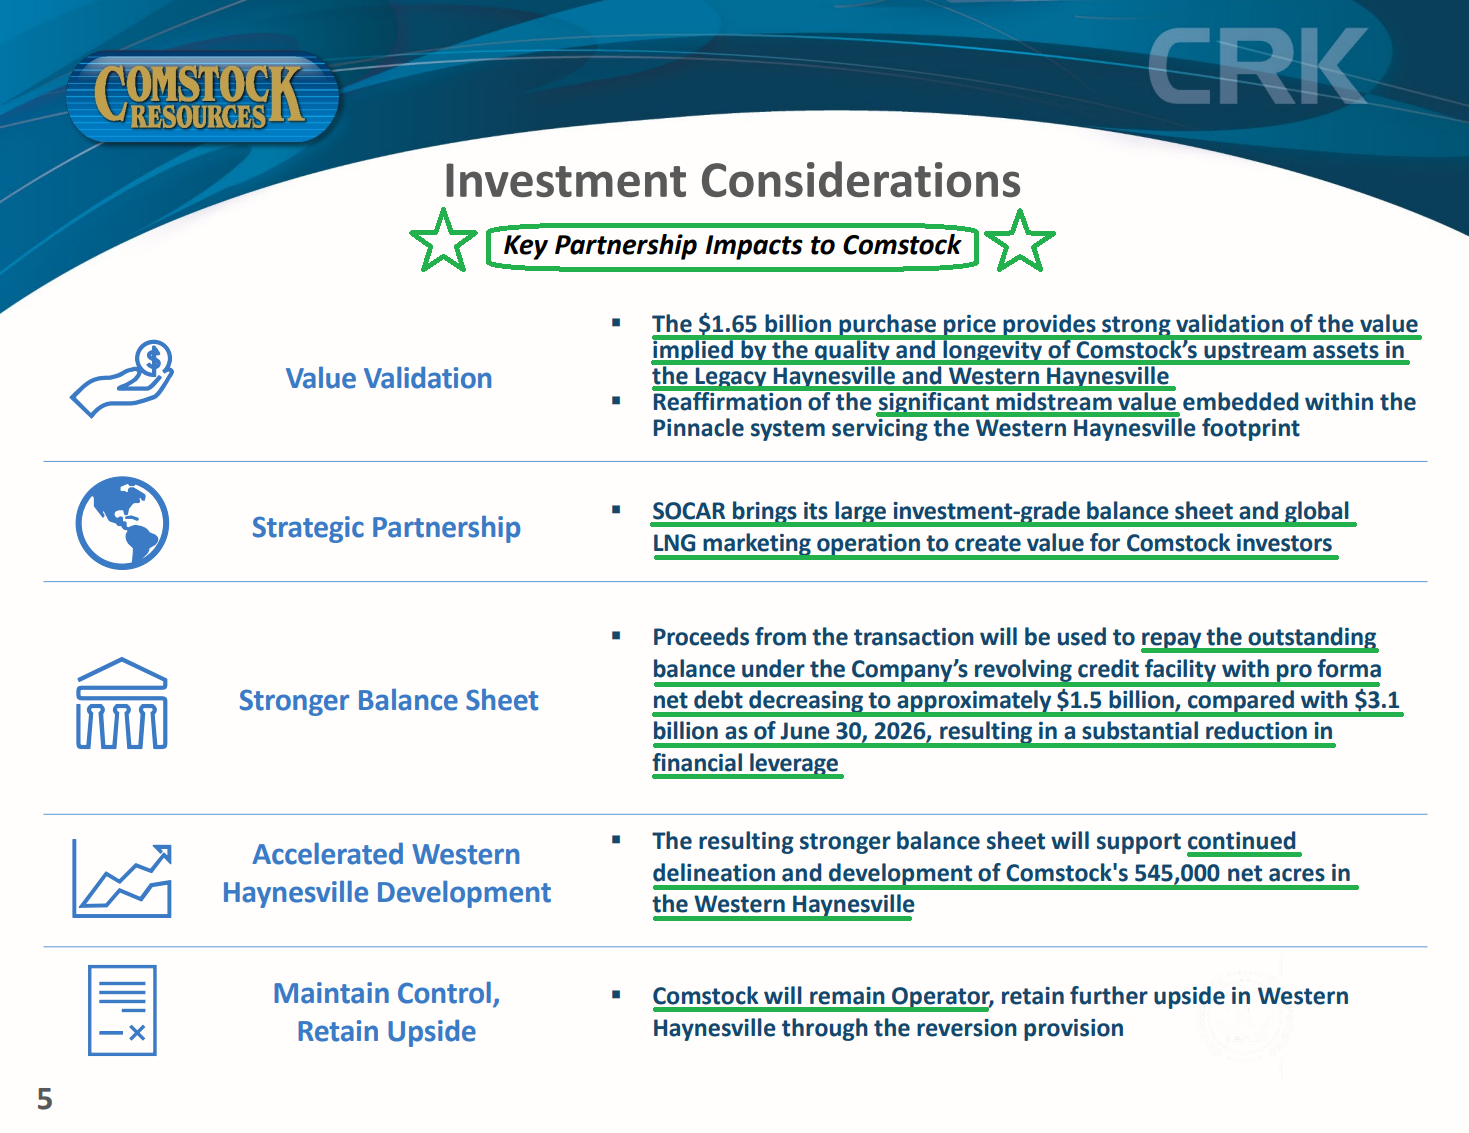
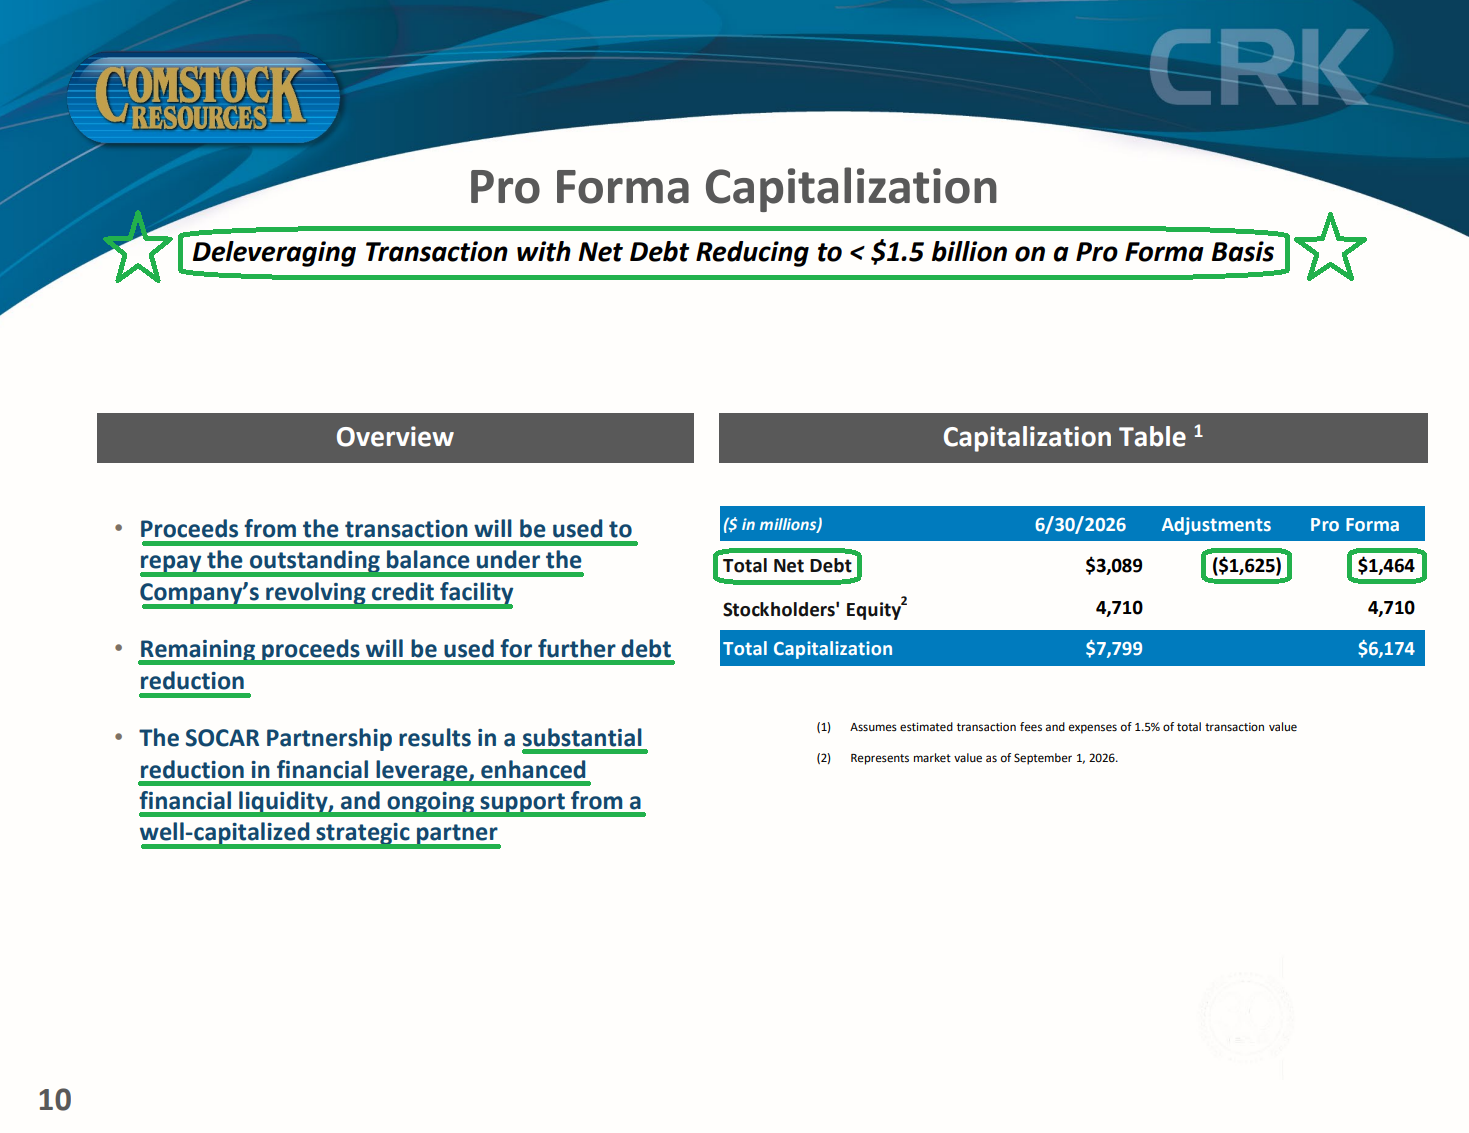
Pro forma net debt falls from $3.1B to ~$1.5B, cutting leverage roughly in half. Proceeds repay the revolver first, with the remainder applied to further debt reduction ($1.624B 6.75% 2029 notes).
Comstock remains operator of all upstream assets and continues to manage and control Pinnacle. SOCAR participates pro rata in future leasing and acquisitions within an area of mutual interest and provides Comstock access to international LNG marketing channels.
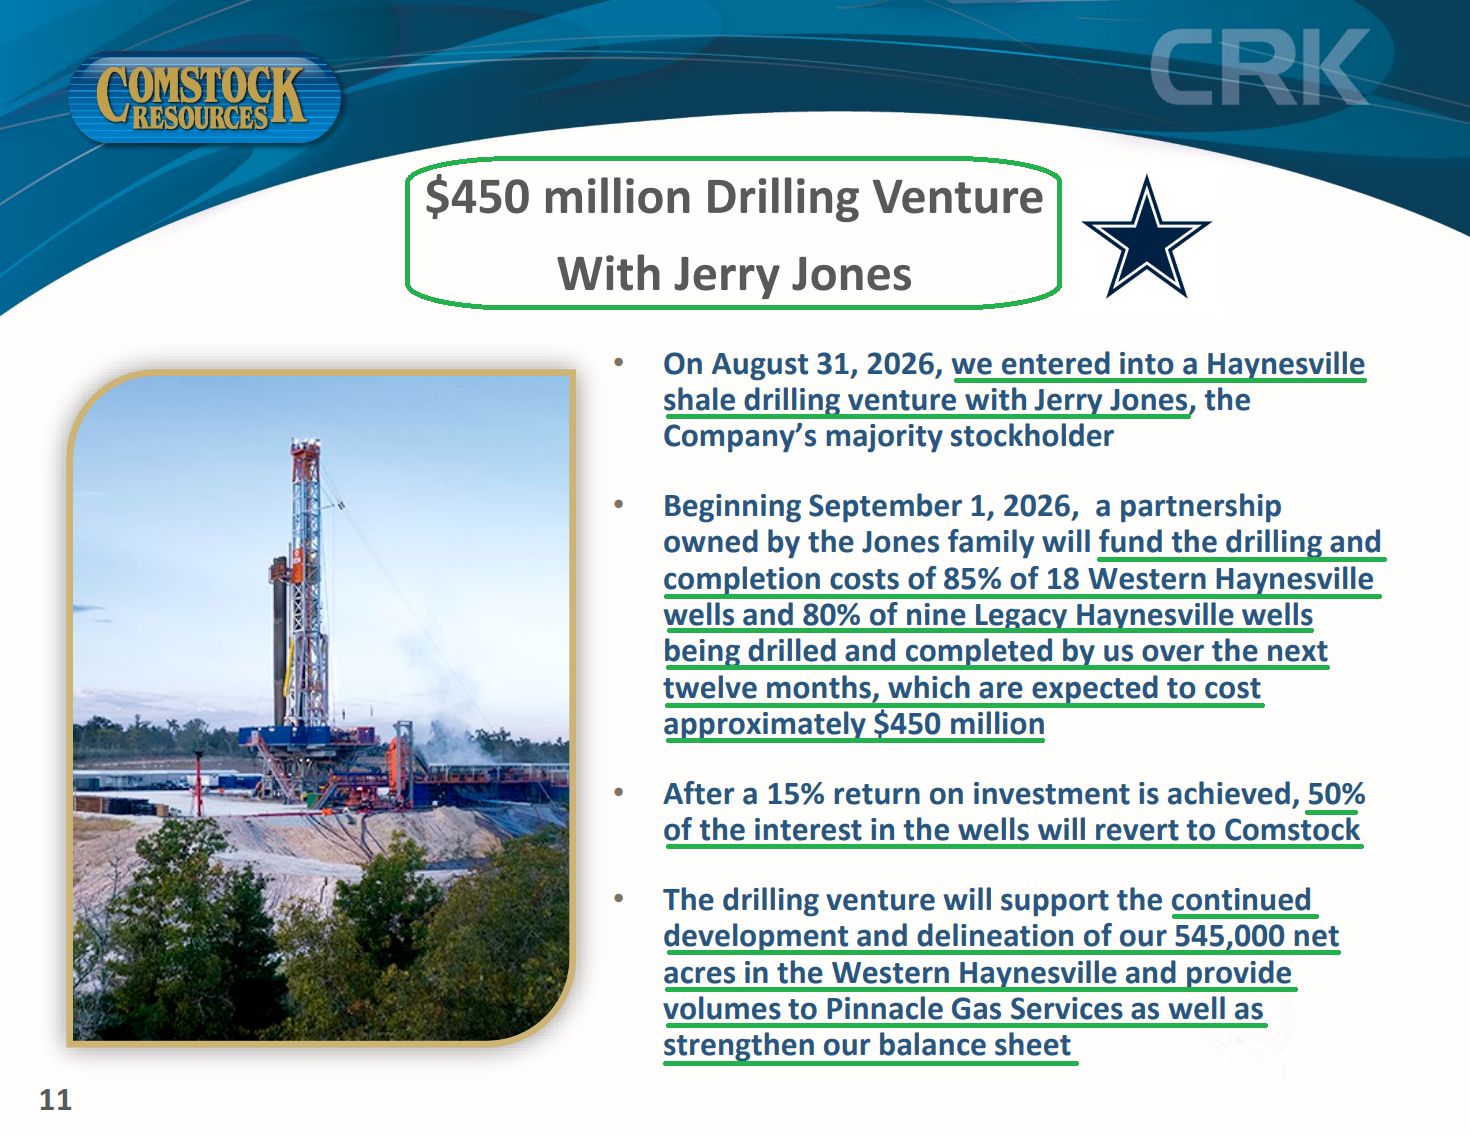
Separately, a partnership owned by the Jones family will fund D&C costs for 85% of 18 Western Haynesville wells and 80% of nine Legacy Haynesville wells over the twelve months beginning September 1, 2026, at a cost of ~$450M. 50% of the interest reverts to Comstock after a 15% return is achieved.
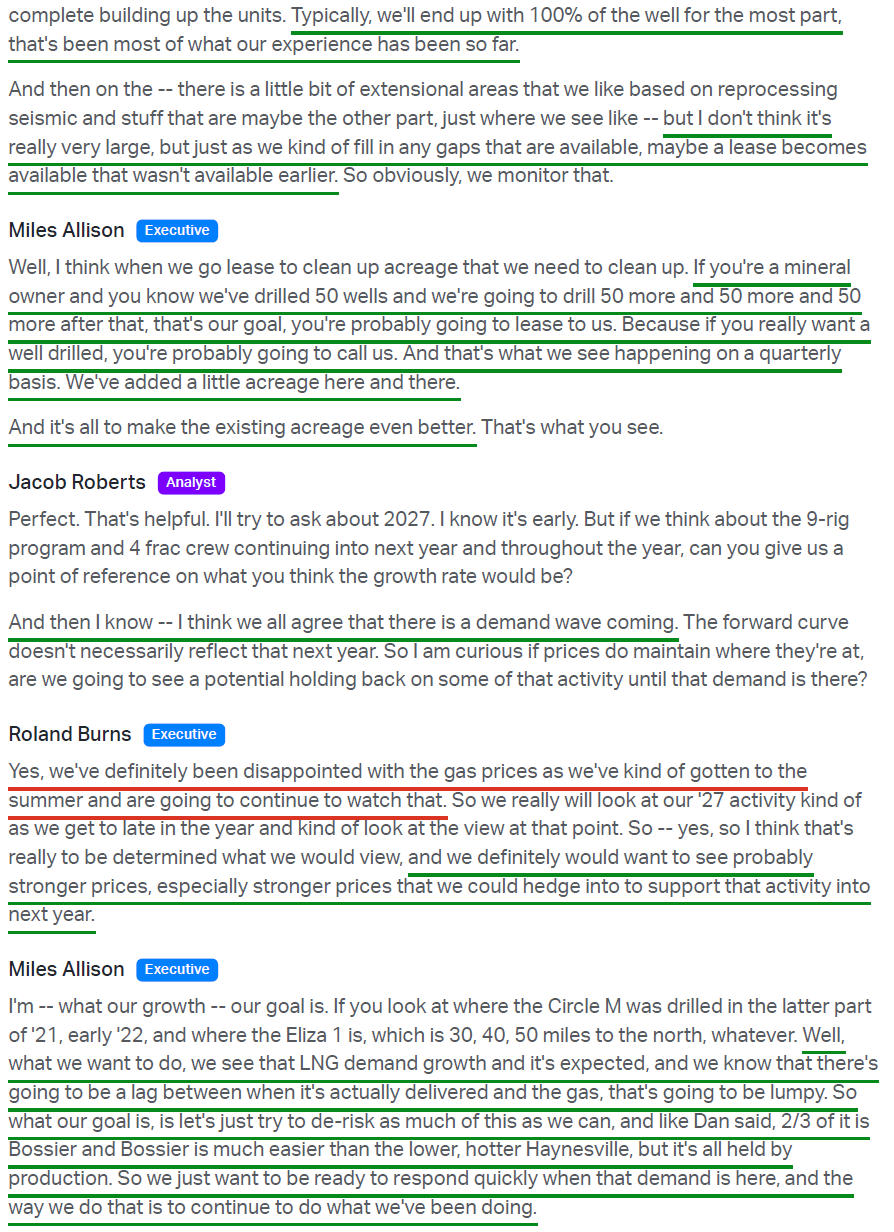
The 18 Western wells represent more than 80% of Comstock’s planned 2026 Western count. Combined with SOCAR’s working interests, Comstock is effectively relieved of D&C costs on those wells, lowering 2026 capital spending by an estimated $250M-$300M and reducing FCF outspend.
Together the transactions provide ~$2.1B of balance sheet and capital relief, addressing the leverage overhang while preserving the majority of Western Haynesville resource value.
Pinnacle Gas Services
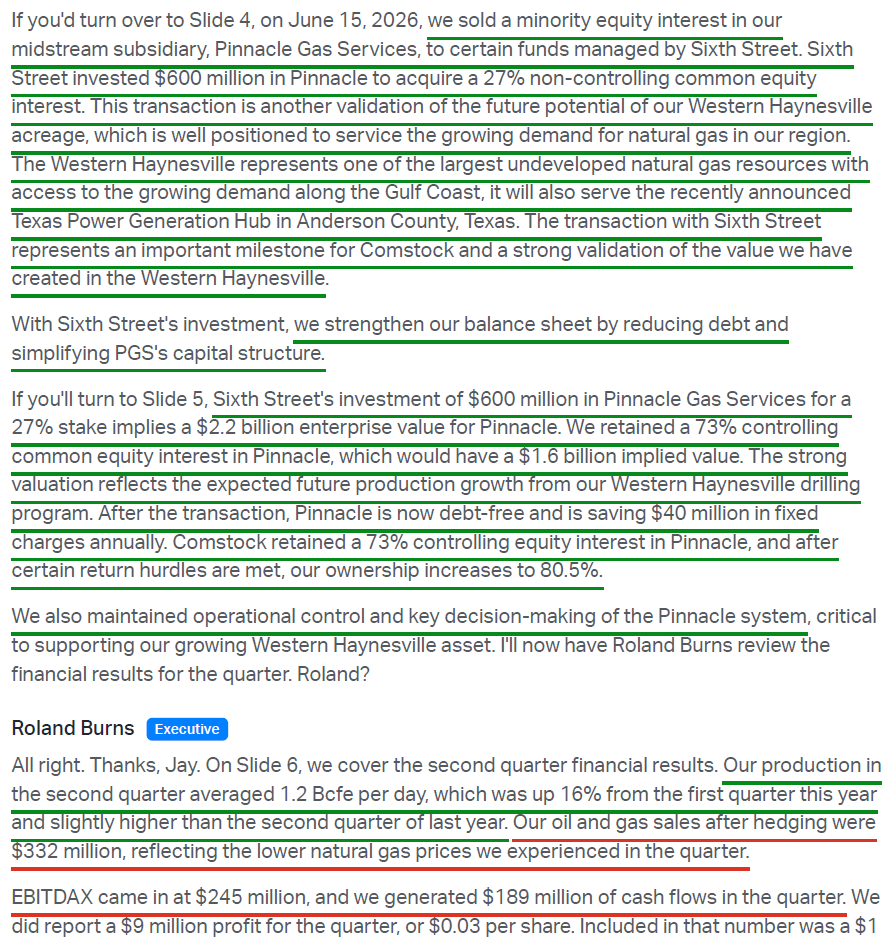
Sold a 27% non-controlling common equity interest in midstream subsidiary Pinnacle Gas Services to Sixth Street for $600M (June 15, 2026), implying a ~$2.2B enterprise value.
Comstock retains a 73% controlling interest worth ~$1.6B and continues to manage, operate, and control the business under a management services agreement.
Proceeds fully retired the expensive Quantum preferred units ($445M plus accrued dividends) along with all Pinnacle-level debt, leaving the entity debt-free and cutting fixed charges by ~$40M per year.
Ownership steps to 80.5% upon Sixth Street clearing certain return hurdles, above the 70% Comstock would have been entitled to before the preferred redemption. Post-SOCAR, Comstock holds 62% with Sixth Street at 27% and SOCAR at 11%.
Pinnacle operates 246 miles of in-service high-pressure pipeline and two gas treating plants. Owning the midstream keeps producing costs low and captures future infrastructure value.
Key Financials
FY2025: natural gas and oil sales $1.45B (+15.4% Y/Y). Operating cash flow $861M (up from $675M in 2024). Adjusted EBITDAX $1.1B (up from $850M in 2024). Production averaged 1,234 MMcfe/d.
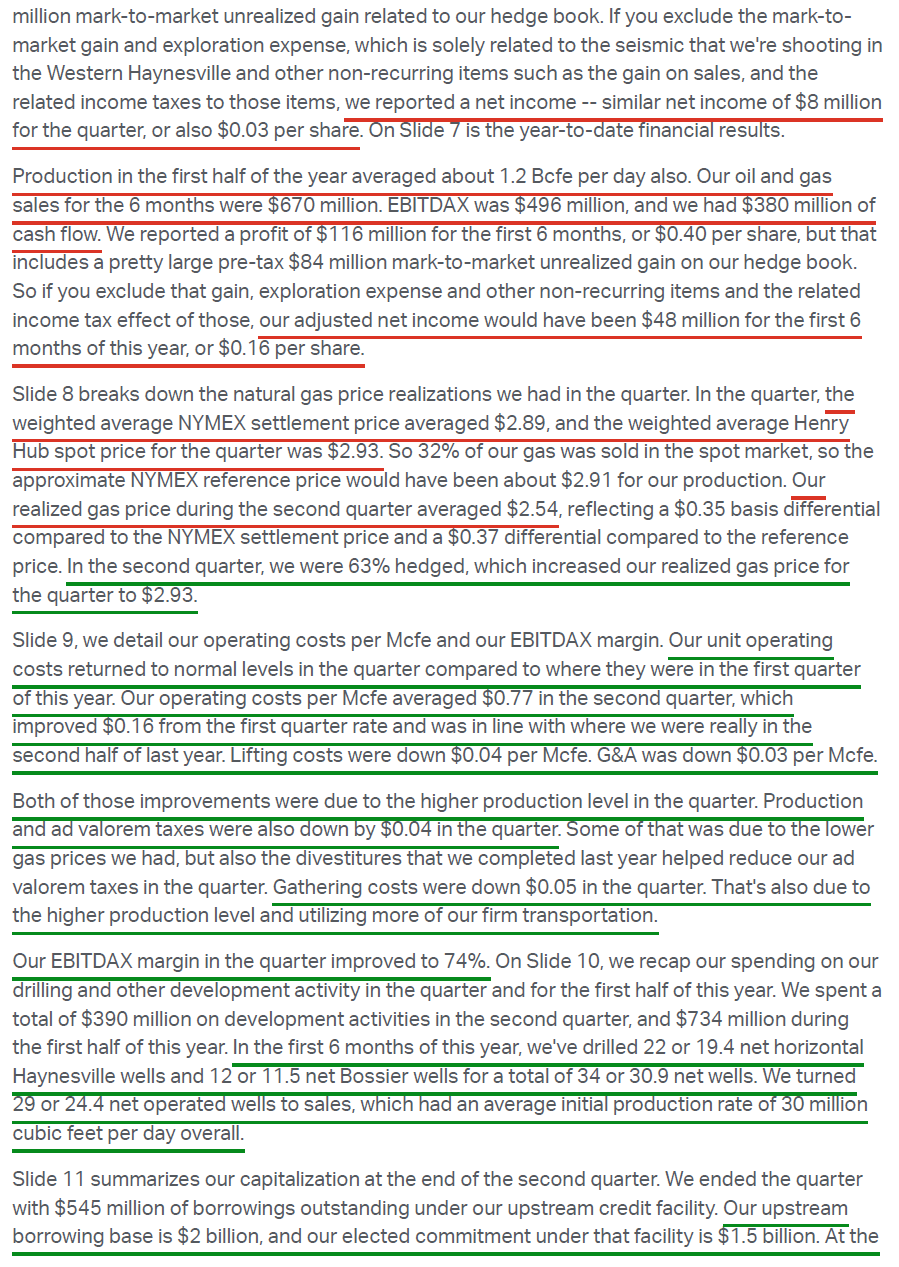
Q2: natural gas and oil sales $331.6M (-4% Y/Y), including ~$43M of realized hedging gains.
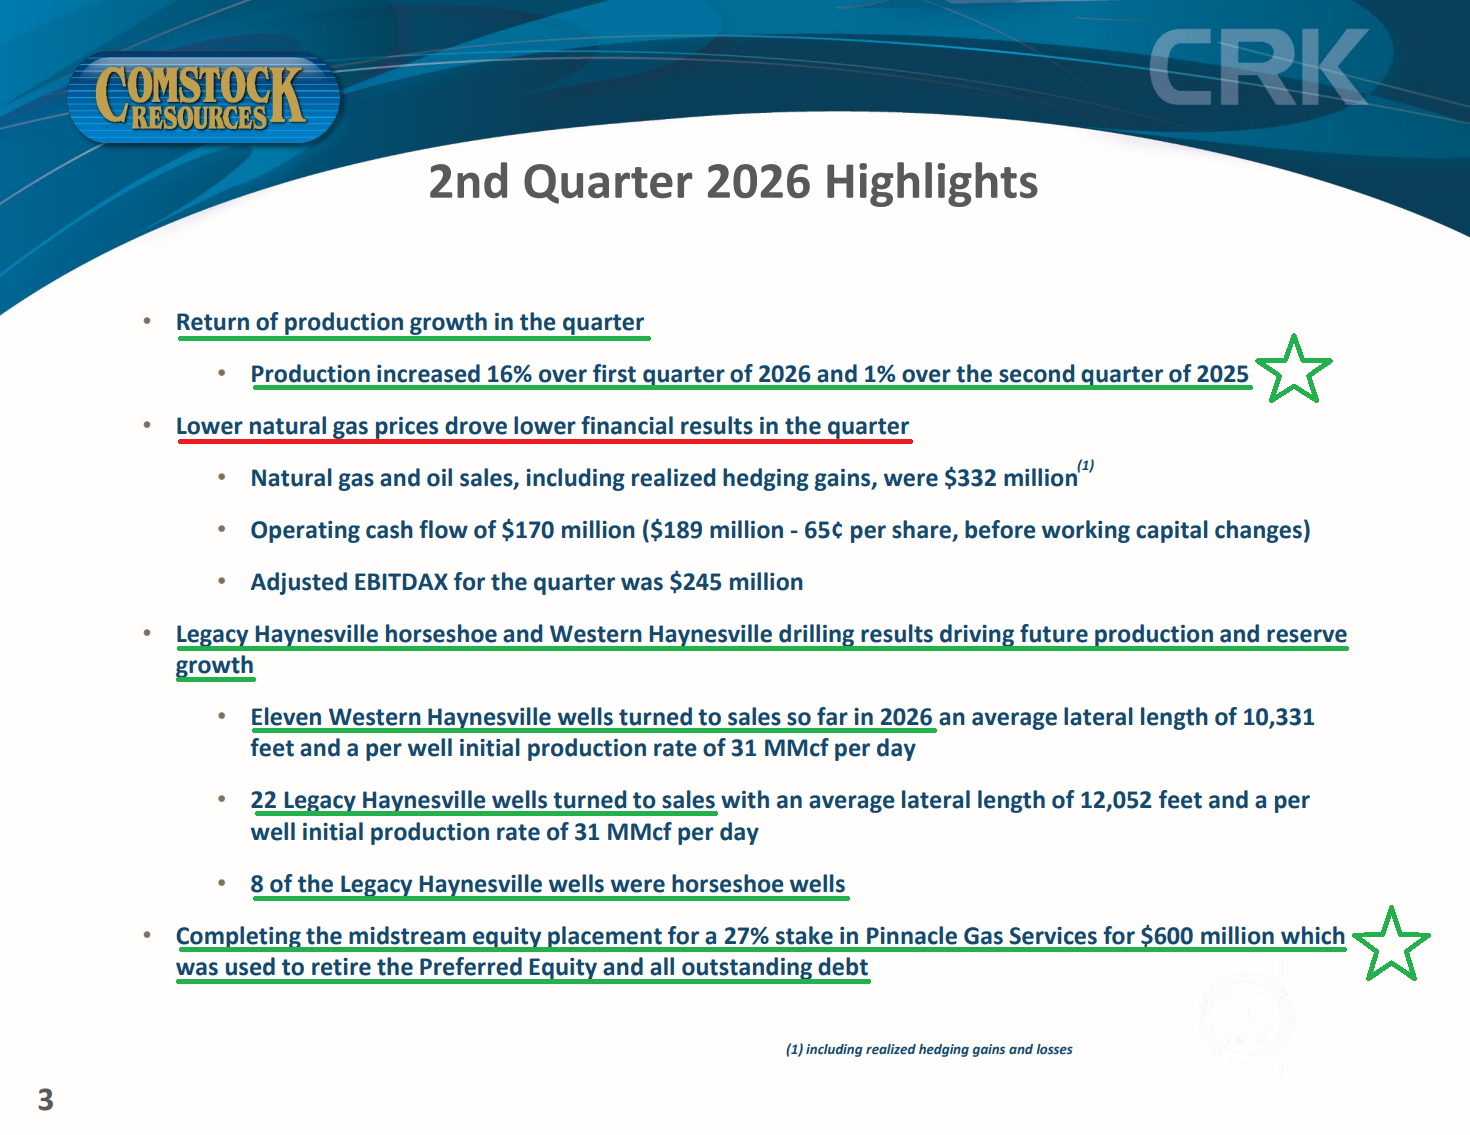
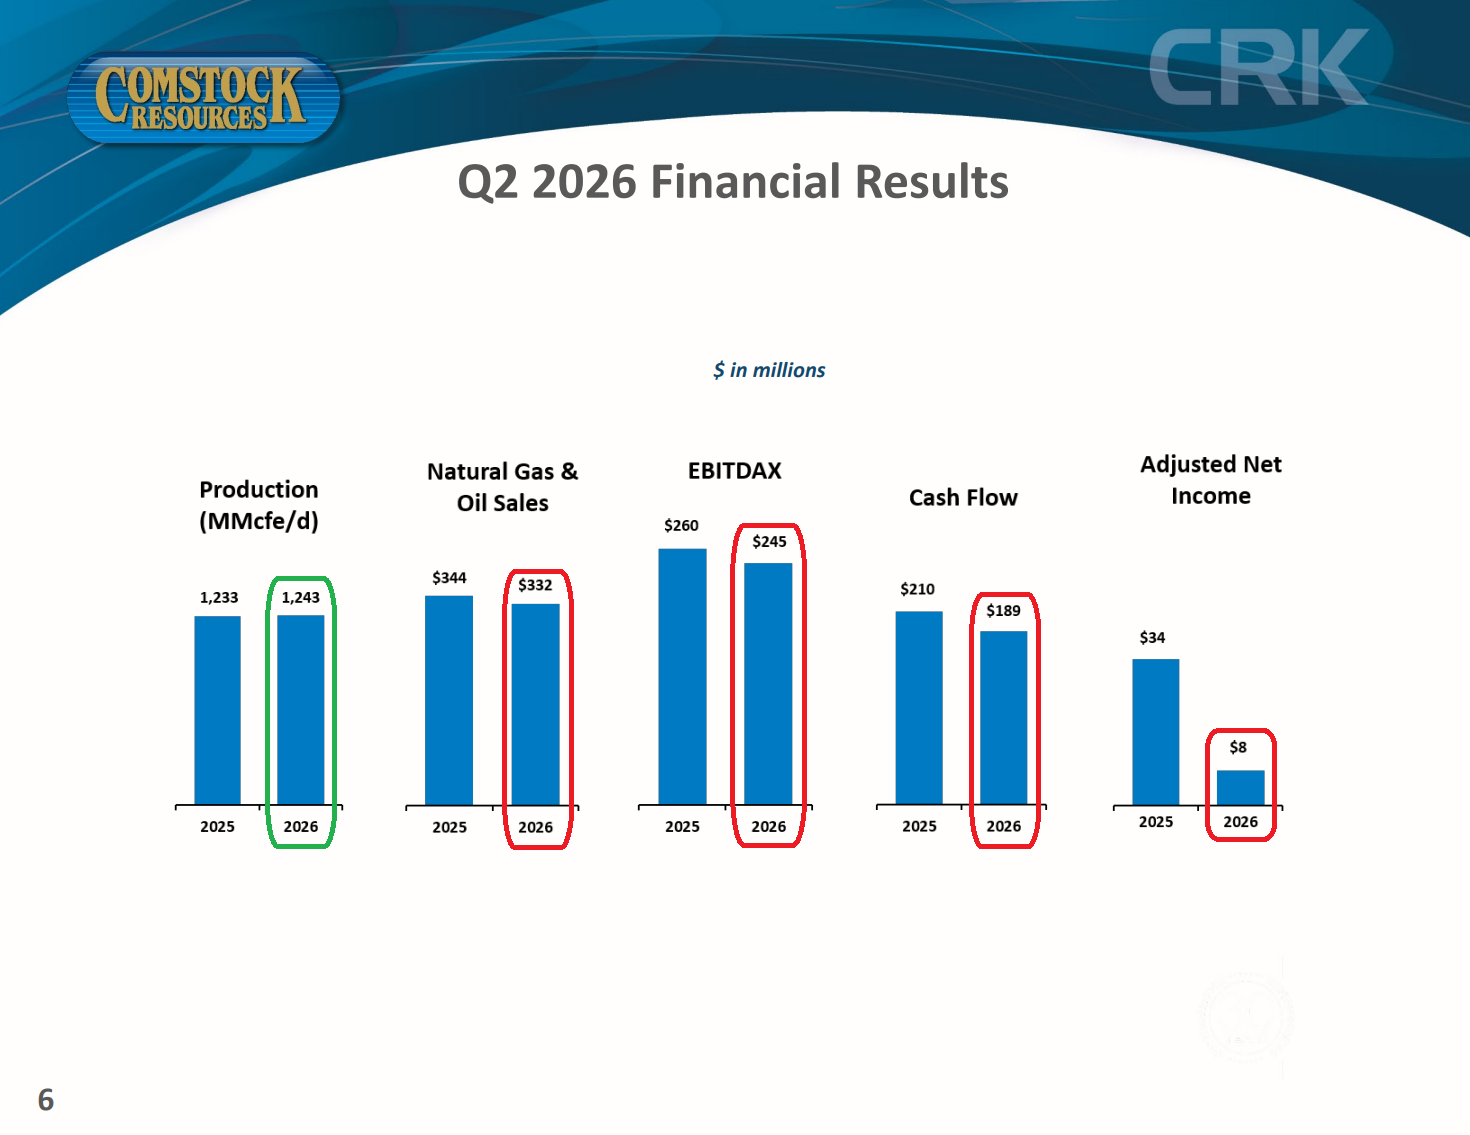
Production 1,243 MMcfe/d (+1% Y/Y, +16% sequentially), returning to growth off the weather-hit first quarter and topping management’s guided 13-15% sequential increase.
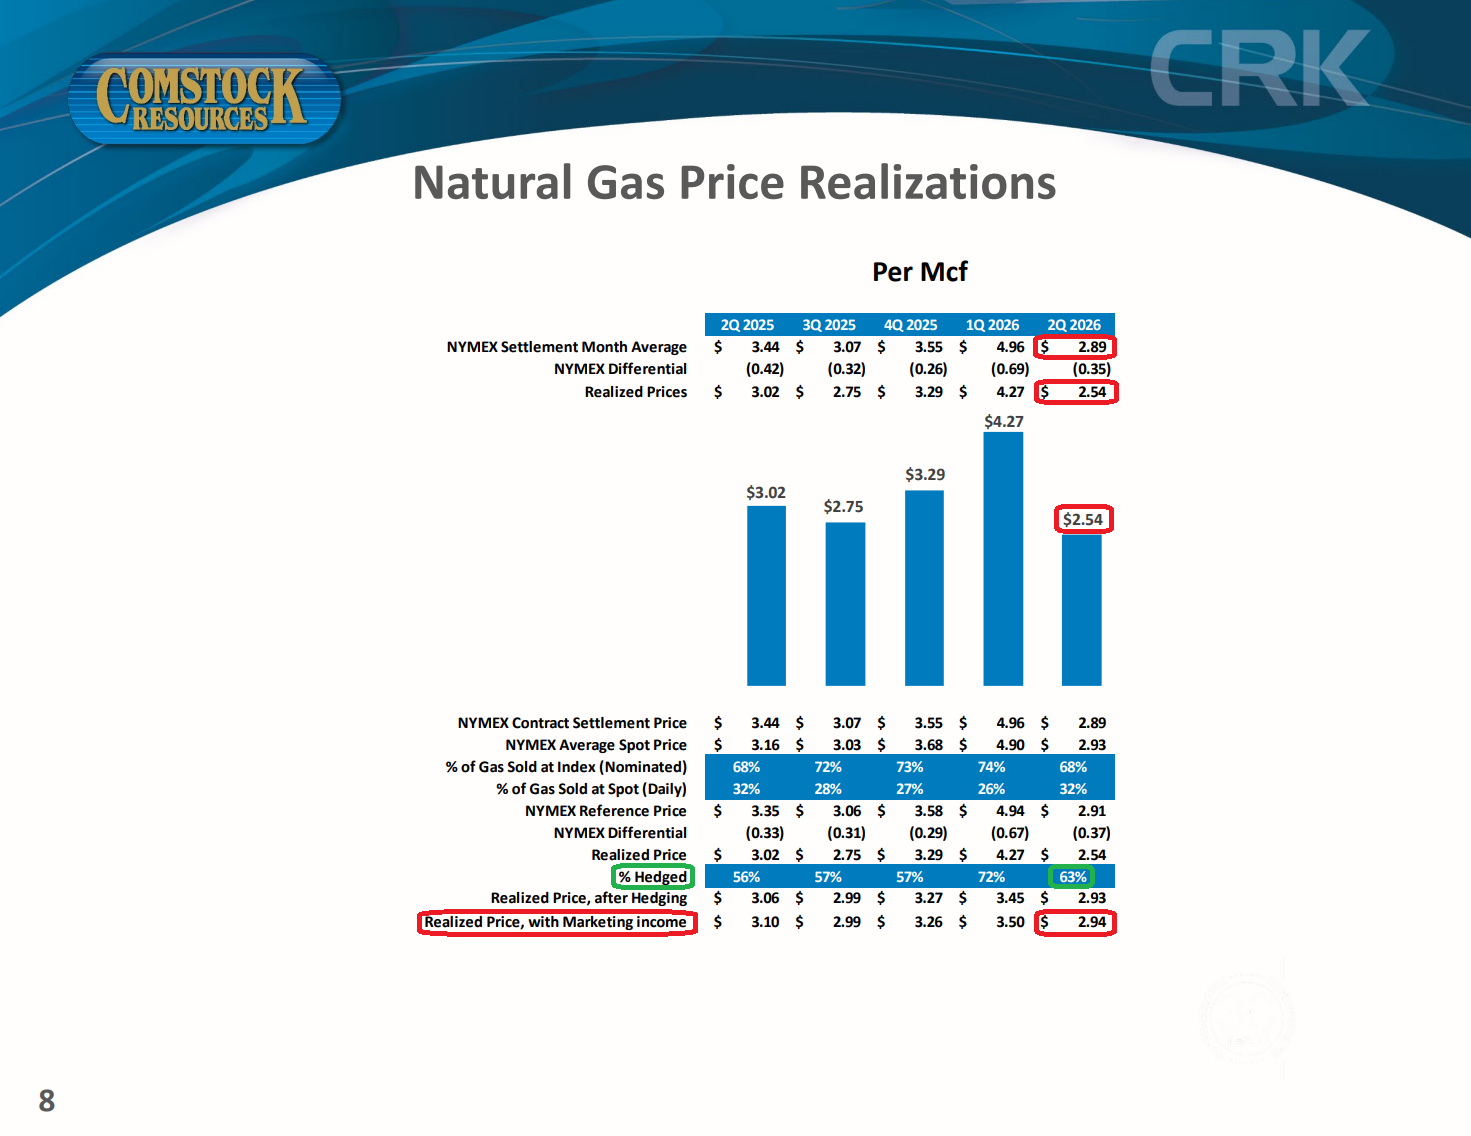
Post-hedge realized price of $2.93/Mcf (-4% Y/Y) with the book 63% hedged (vs. 56% last year).
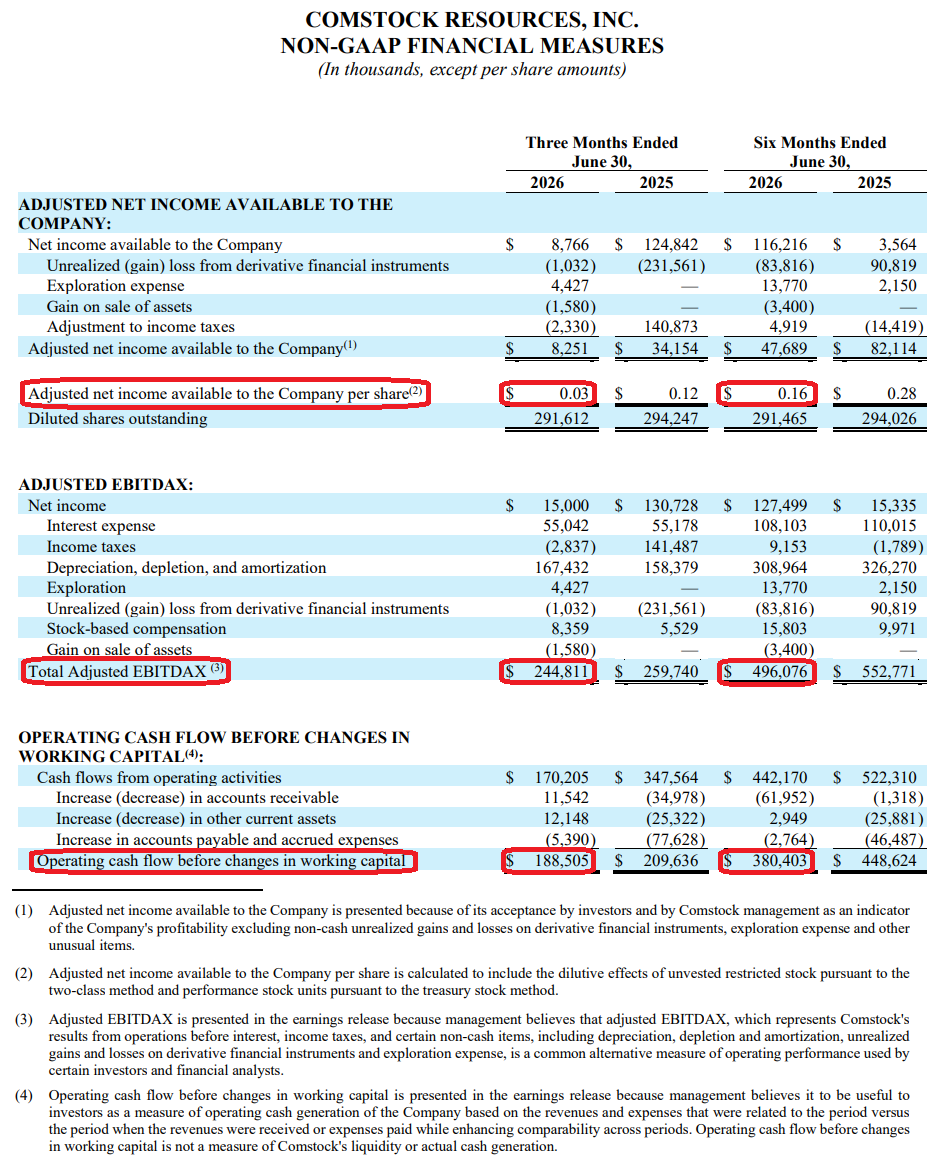
Q2 adjusted EBITDAX $245M (-6% Y/Y from $260M) as unit costs normalized. Adjusted EPS $0.03 (-75% Y/Y from $0.12), in line with the $0.03 consensus.
Q2 operating cash flow before working capital $188.5M (-10% Y/Y) or $0.65/diluted share. FCF a deficit of ~($202M) vs. ~($59M) last year, on stepped-up E&D capex of $390M (+46% Y/Y) for the Western Haynesville buildout. Deficit widens to ~($222M) including acquisitions.
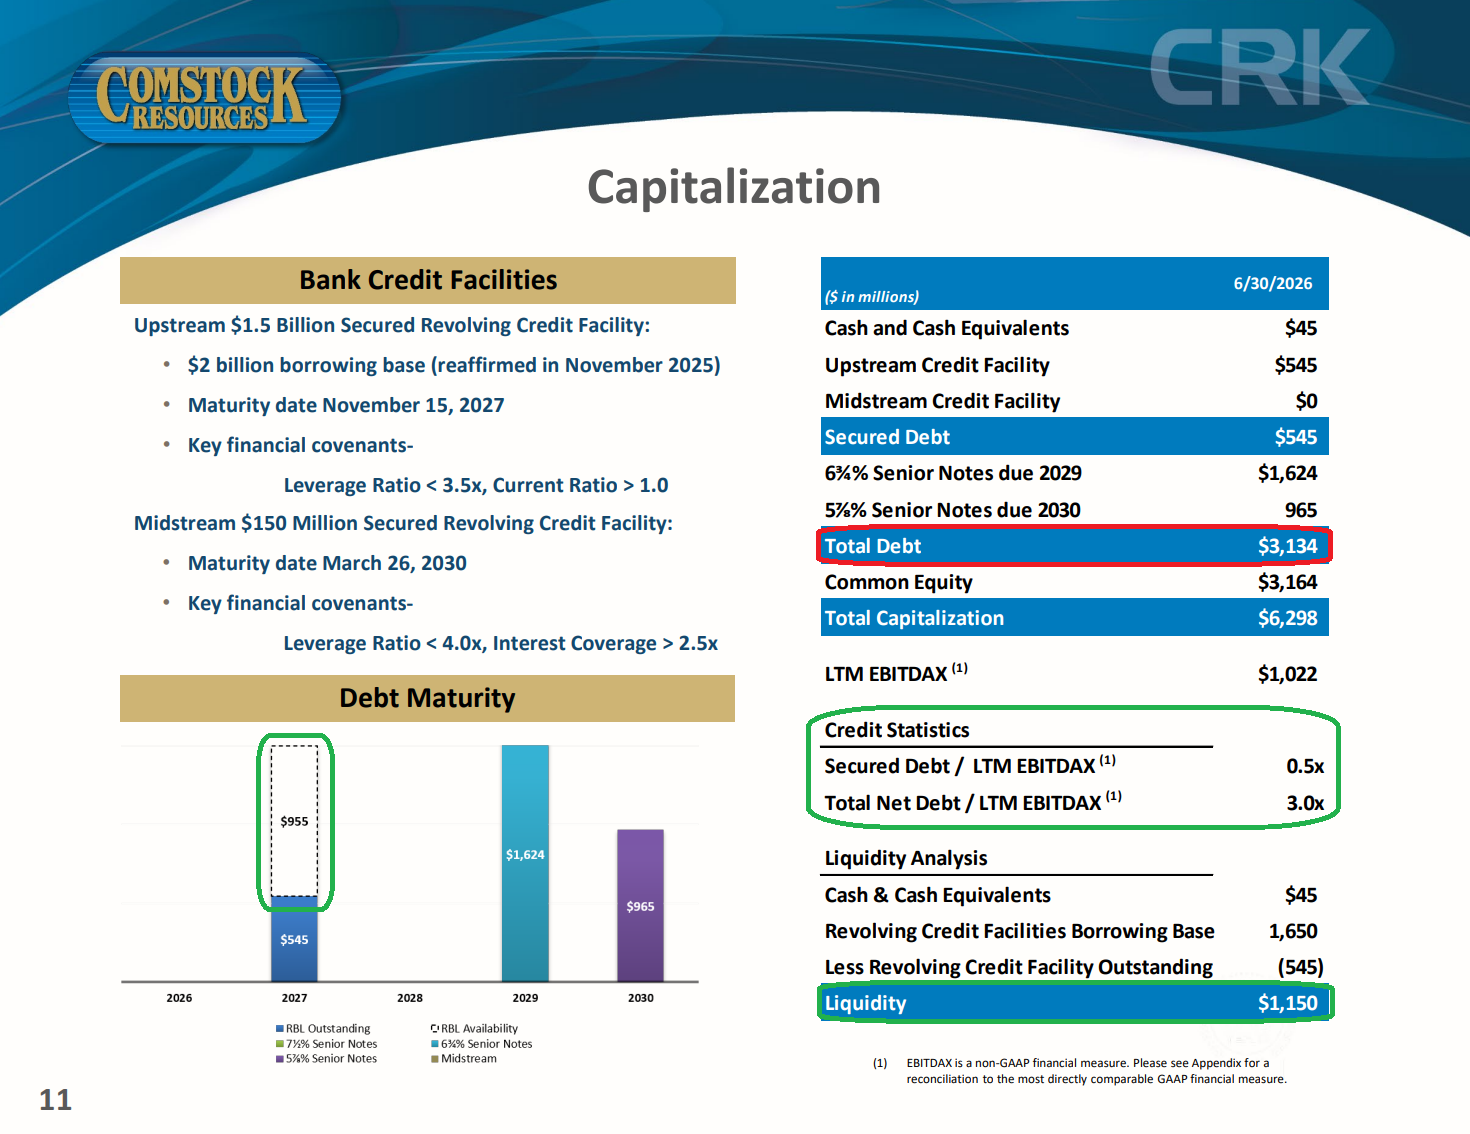
Balance sheet: cash $45M, total debt $3.1B, net debt ~$3.1B. Net leverage 3.0x LTM EBITDAX ($1,022M), comfortably inside 3.5x upstream and 4.0x midstream covenants.
Strong liquidity of $1.15B with no debt maturities until 2027 (RBL) and 2029/2030 (senior notes). Pro forma for SOCAR, net debt drops to ~$1.5B.
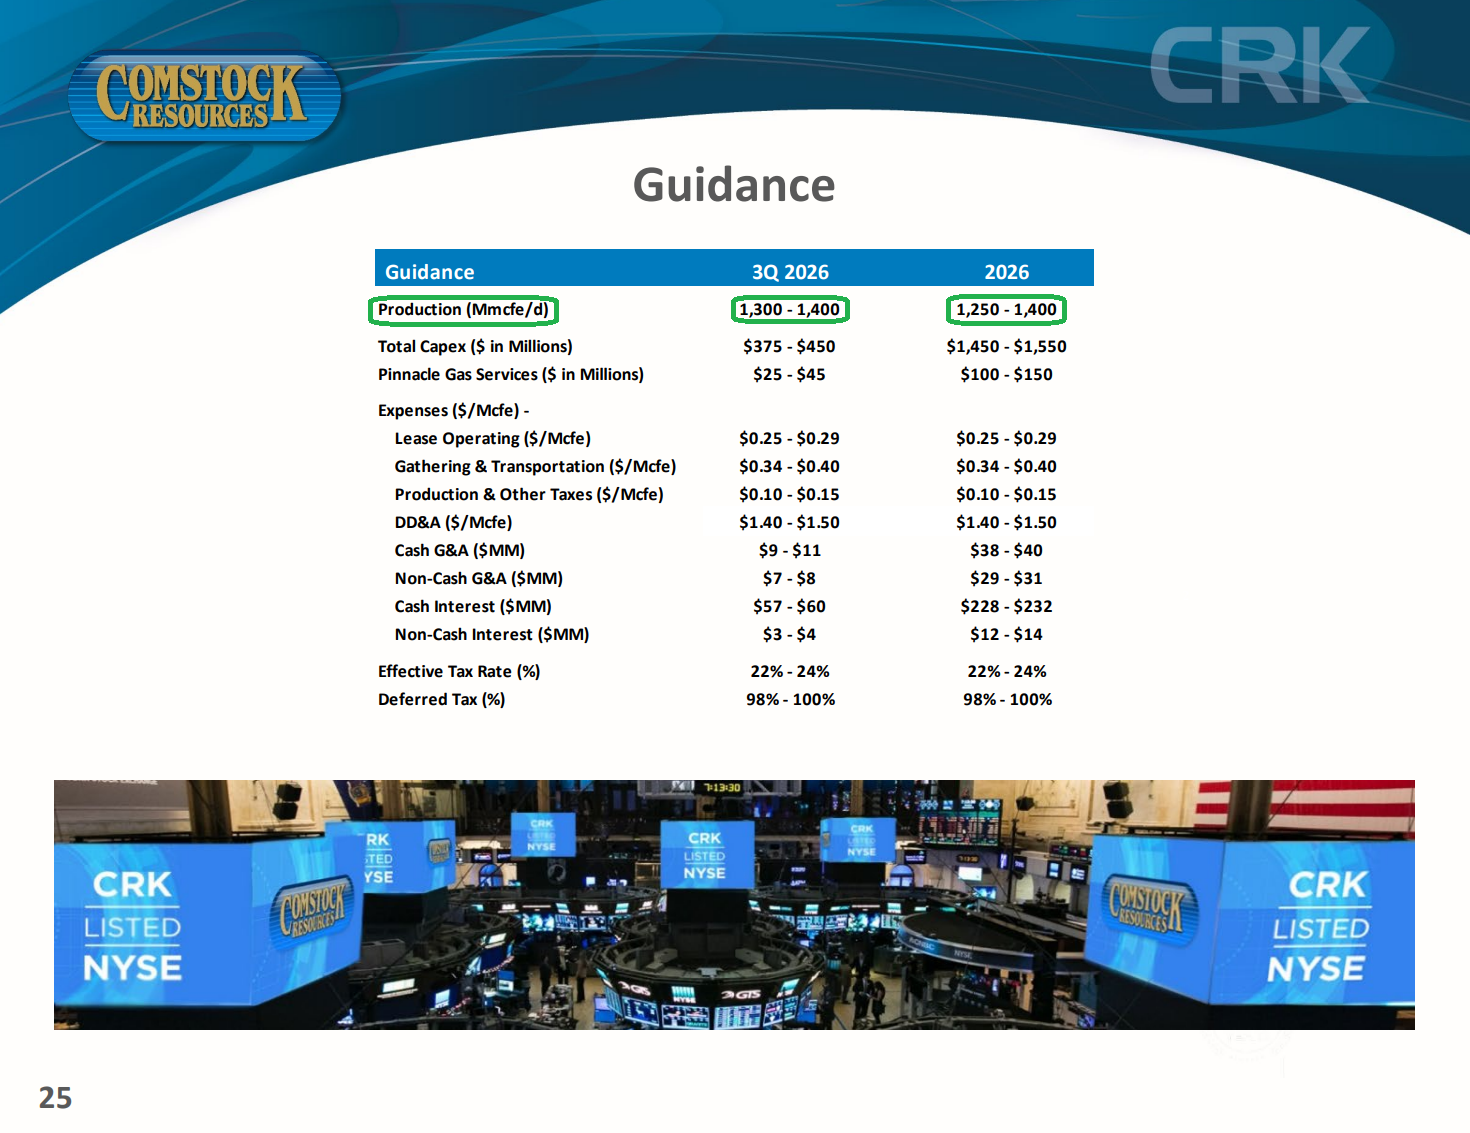
FY26 guidance maintained: production 1,250-1,400 MMcfe/d (vs. FY25’s 1,234 MMcfe/d, midpoint implying ~7% growth), total capex $1.45B-$1.55B (plus $100M-$150M for Pinnacle).
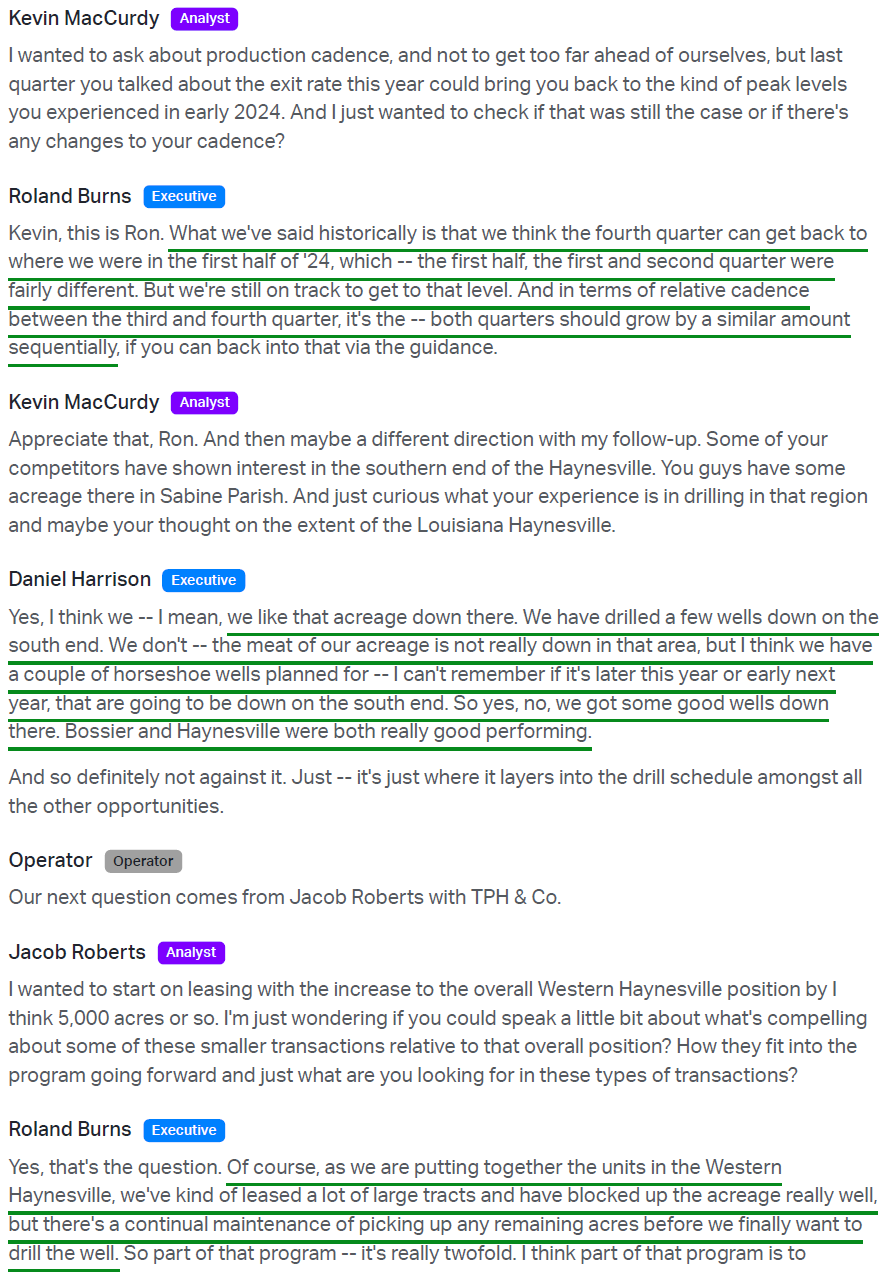
Q3 production guided to 1,300-1,400 MMcfe/d, with sequential growth continuing through the back half and Q4 expected back near the first-half-2024 peak.
Completed $445M in divestitures (Cotton Valley and Shelby Trough), with proceeds directed to debt reduction.
Q2 Commentary
“I think we’ve turned the corner.”
That was CRK management in May, closing the book on a brutal first quarter in which winter weather shut in wells, idled frac crews, and pushed nearly every completion into the final days of March. The company guided to a 13% to 15% sequential rebound in production for the second quarter. Comstock topped it, delivering 16% growth to 1,243 MMcfe/d, with fourth-quarter production still expected to return to the peak levels the company last saw in the first half of 2024.
The step-up in volumes brought costs back with them. Production expenses fell to $0.77 per Mcfe from the $0.93 spike in the first quarter, when largely fixed field costs were spread across far fewer units of production. That was below the $0.80 posted a year ago and ~50% below the peer average. This best-in-class cost structure is part of what attracted us to the name in the first place and remains one of the many durable advantages Comstock has over its peers.
The only headwind was price. NYMEX averaged $2.89/Mcf versus $3.44 a year ago, leaving Comstock with a realized price of $2.54/Mcf before hedging and $2.93/Mcf after hedging, with a larger hedge book (63% hedged vs. 56% last year) cushioning the decline. Oil and gas sales came in at $331.6M, down 4% Y/Y, while adjusted EBITDAX was $245M, down 6% from $260M. Weaker prices, combined with a continued step-up in spending as the Western Haynesville buildout accelerated, drove a free cash flow deficit of ~$202M.
When you can’t control the price you receive, you turn your attention to what you can control: the cost of production. That’s where management focused its efforts this quarter.
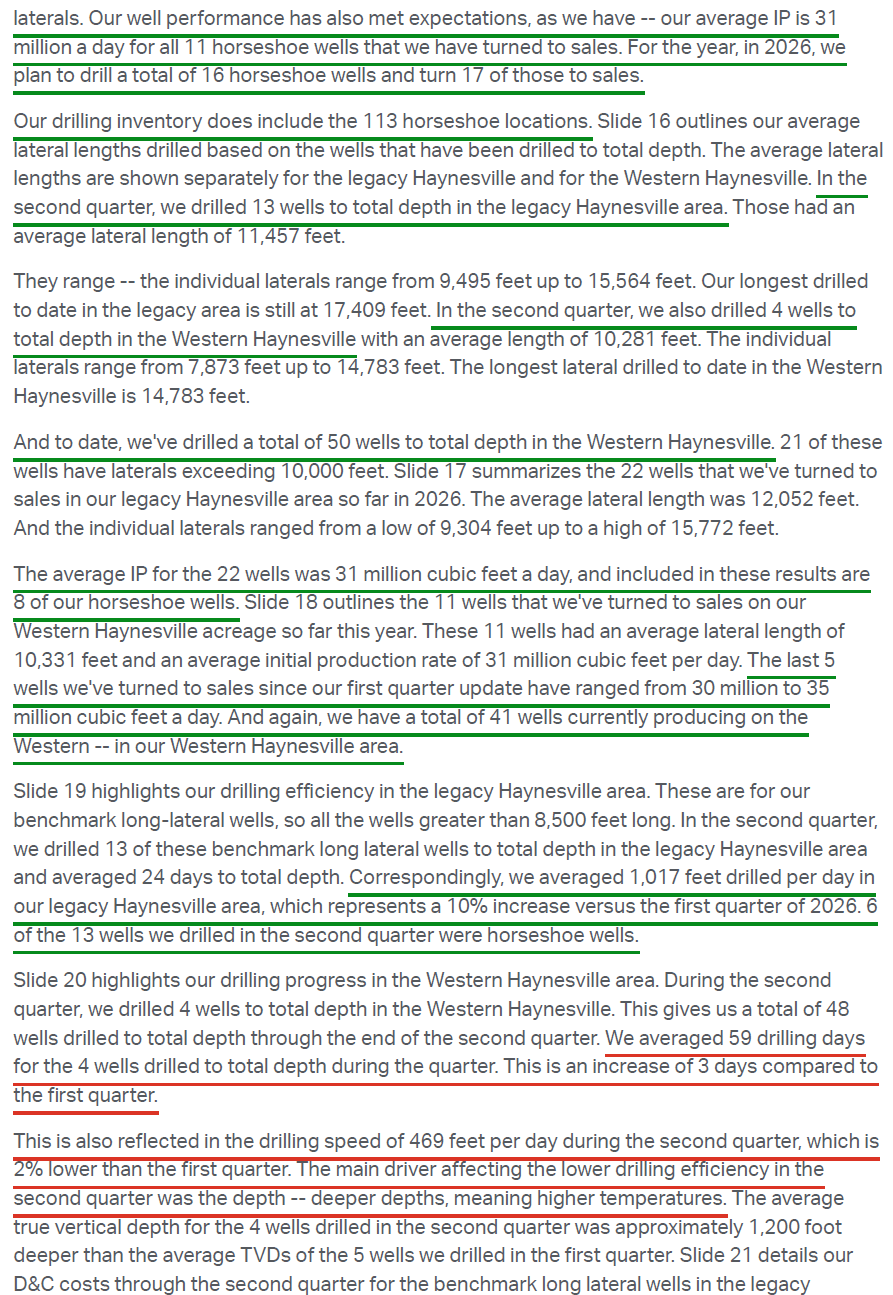
Comstock holds 545,190 net acres in the Western Haynesville, what management calls the “holy grail,” though the play is still in the very early innings. CRK has far less operational history there than in the legacy Haynesville, with the company still experimenting with well designs and drilling techniques and learning by trial and error, the way every new shale field gets figured out. That learning curve comes with a real price tag, with Western drilling costs running $1,738 per lateral foot in the quarter versus $710 in the legacy Haynesville.
Much of that gap comes down to the stage of development, not the rock itself. The legacy Haynesville is a developed play where the roads, pads, and gathering infrastructure were paid for years ago. In the Western Haynesville, a single well still carries many of those costs, which should come down materially as the play develops.
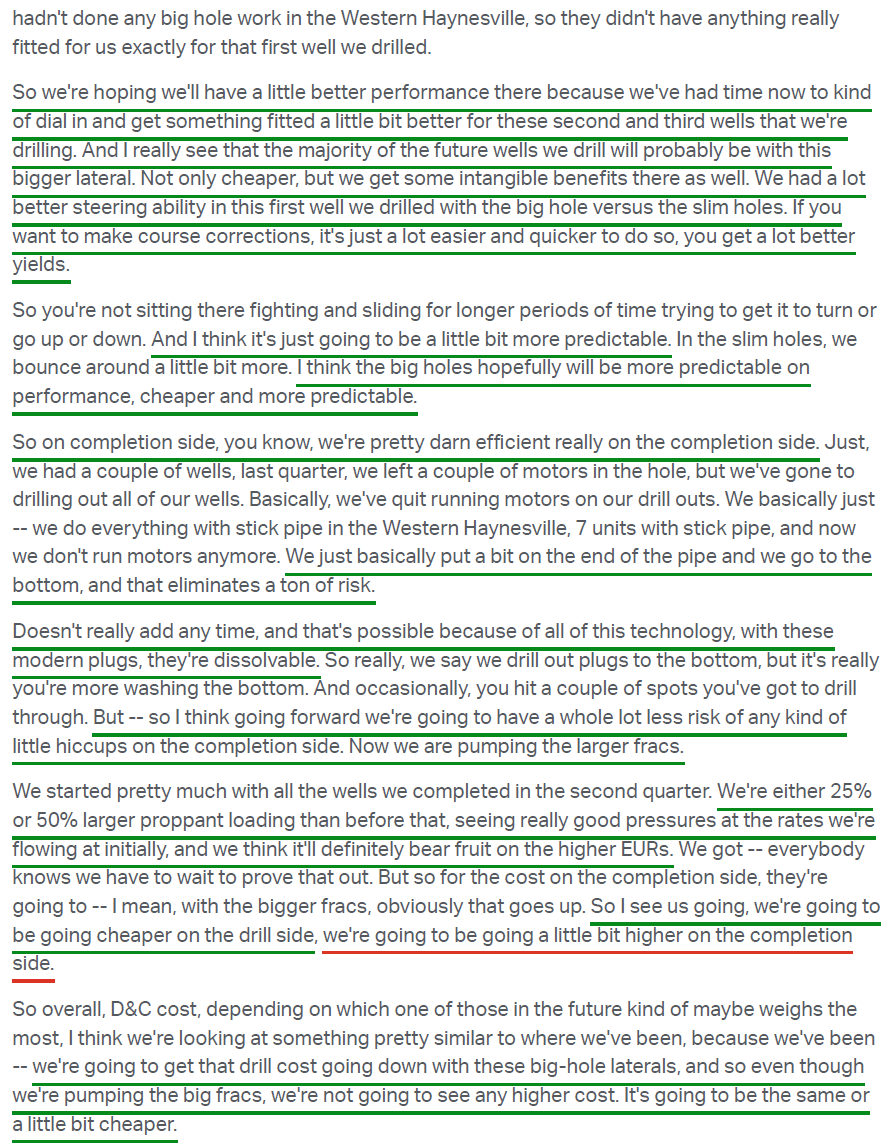
Management is pulling several levers to accelerate that process. The quarter’s breakthrough was the Dolly Jones, Comstock’s first “big hole” lateral, drilled with a larger bit that keeps downhole temperatures lower, allowing tools to last longer and the well to steer more predictably. It came in at $1,306 per lateral foot, ~25% below the quarterly average and the cheapest well Comstock has drilled below 16,000 feet, where costs typically run highest. Two more are in the ground to confirm the results are repeatable, with the majority of future Western wells (2,528 net locations) expected to adopt the design. Higher-pressure rigs, insulated drill pipe, higher-temperature-rated motors, and larger fracs are also being deployed, creating further opportunities to bring costs down.
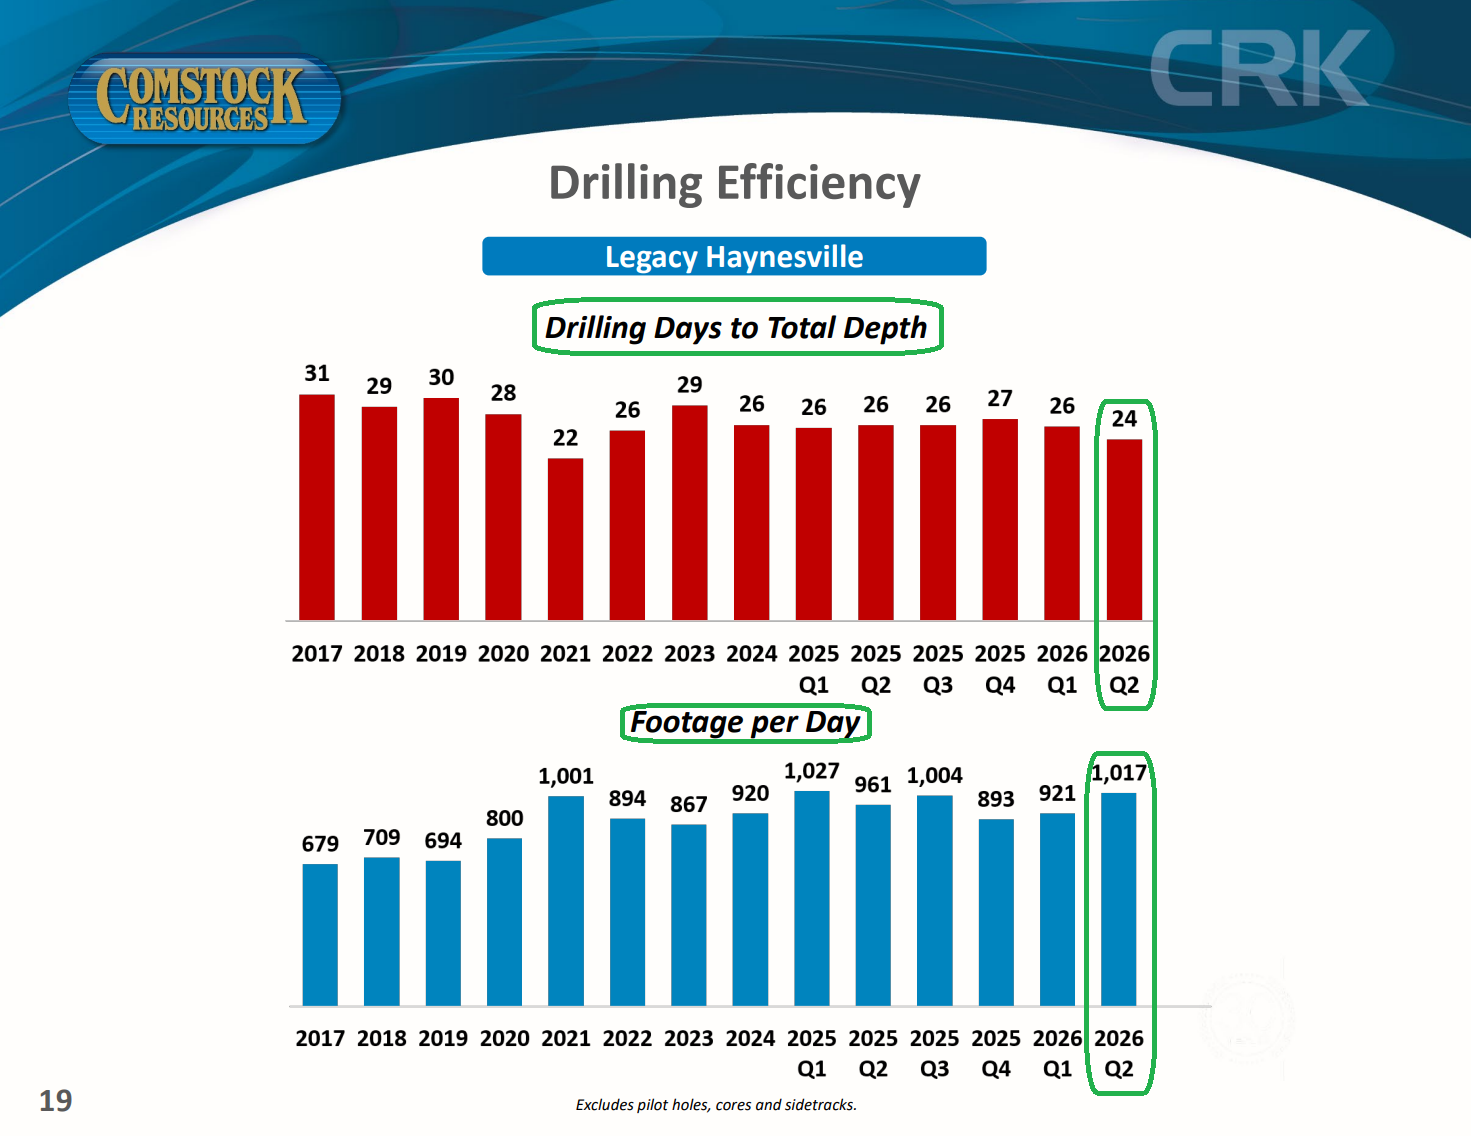
Meanwhile, the legacy asset turned in one of its best operational quarters in years, reaching total depth in 24 days at 1,017 feet per day, while the horseshoe program continued to deliver 35% drilling cost savings. All in, it was a solid quarter of continued operational progress, delivering exactly what management said it would.
But the bigger news came earlier this month, putting those operational results in the shade.
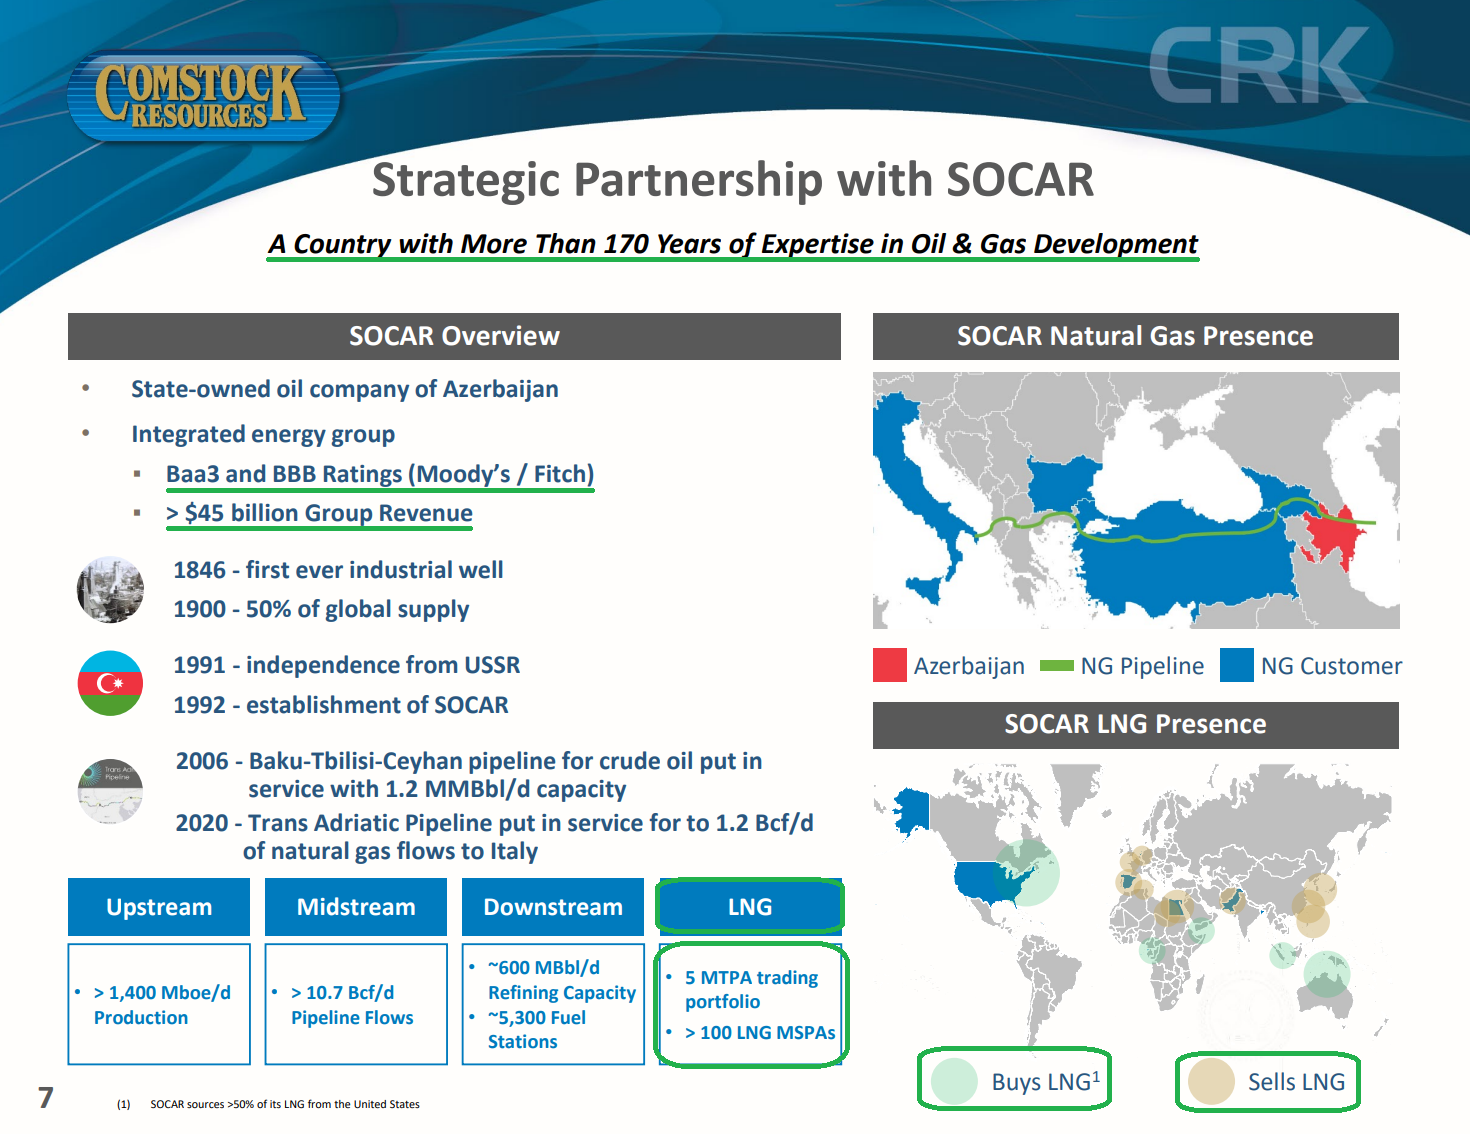
On September 1st, Comstock announced a $1.65B all-cash strategic partnership with SOCAR, the state oil company of Azerbaijan.
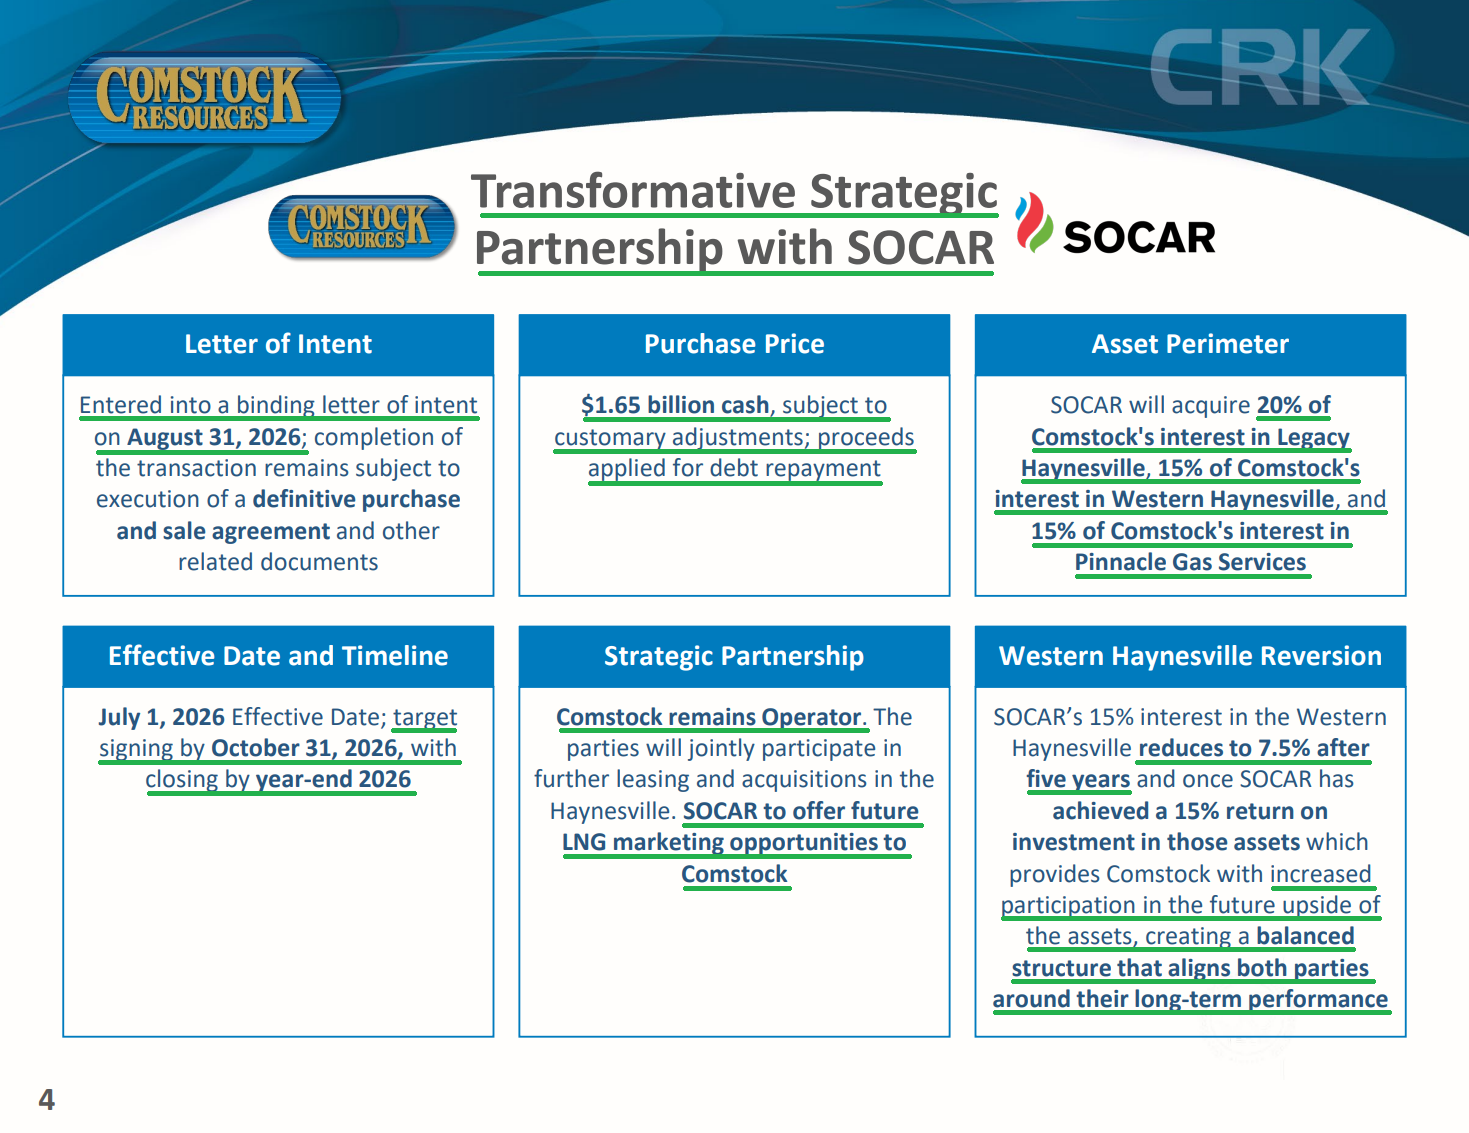
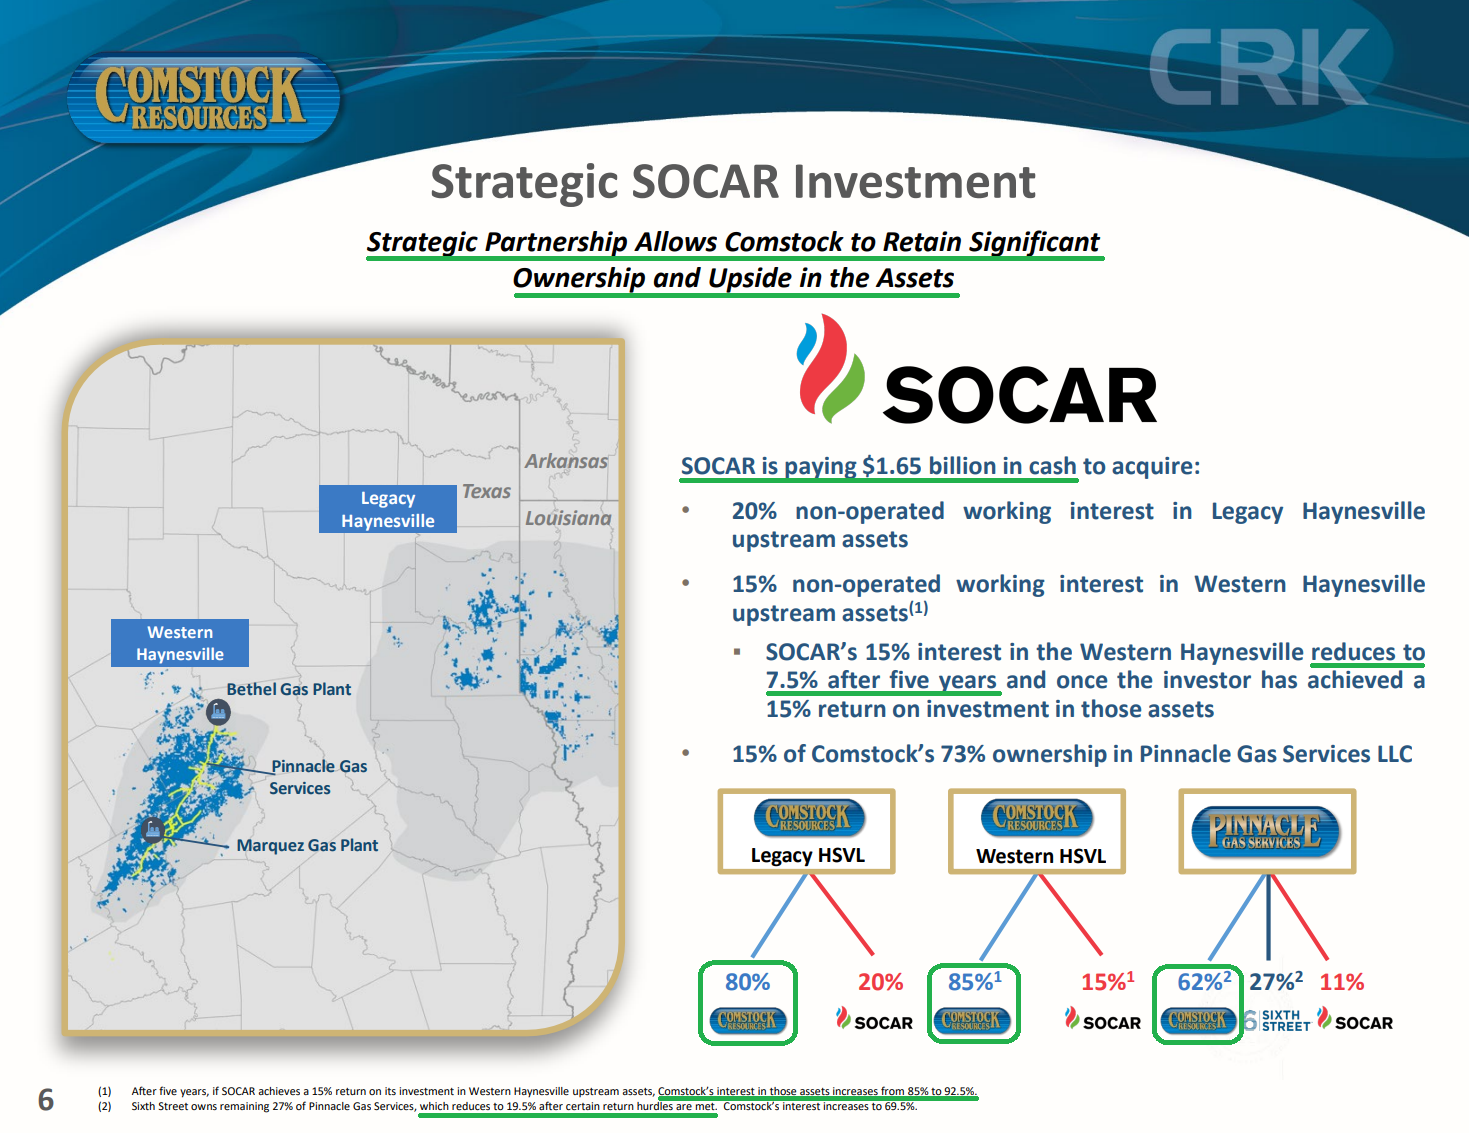
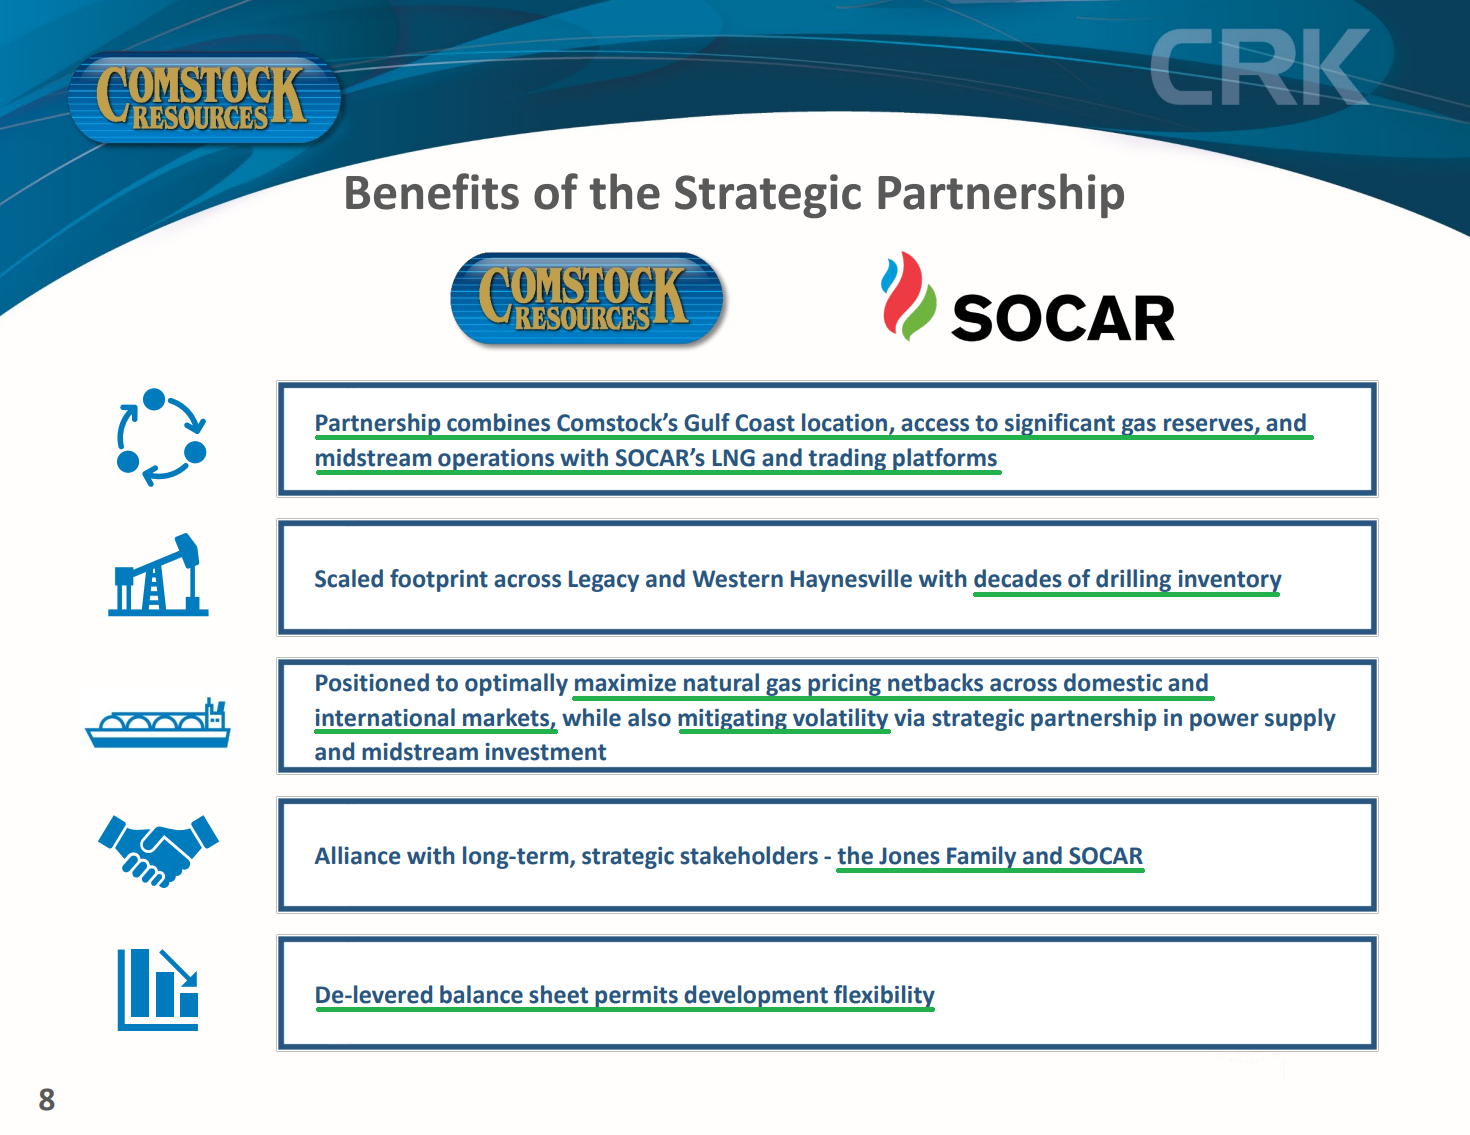
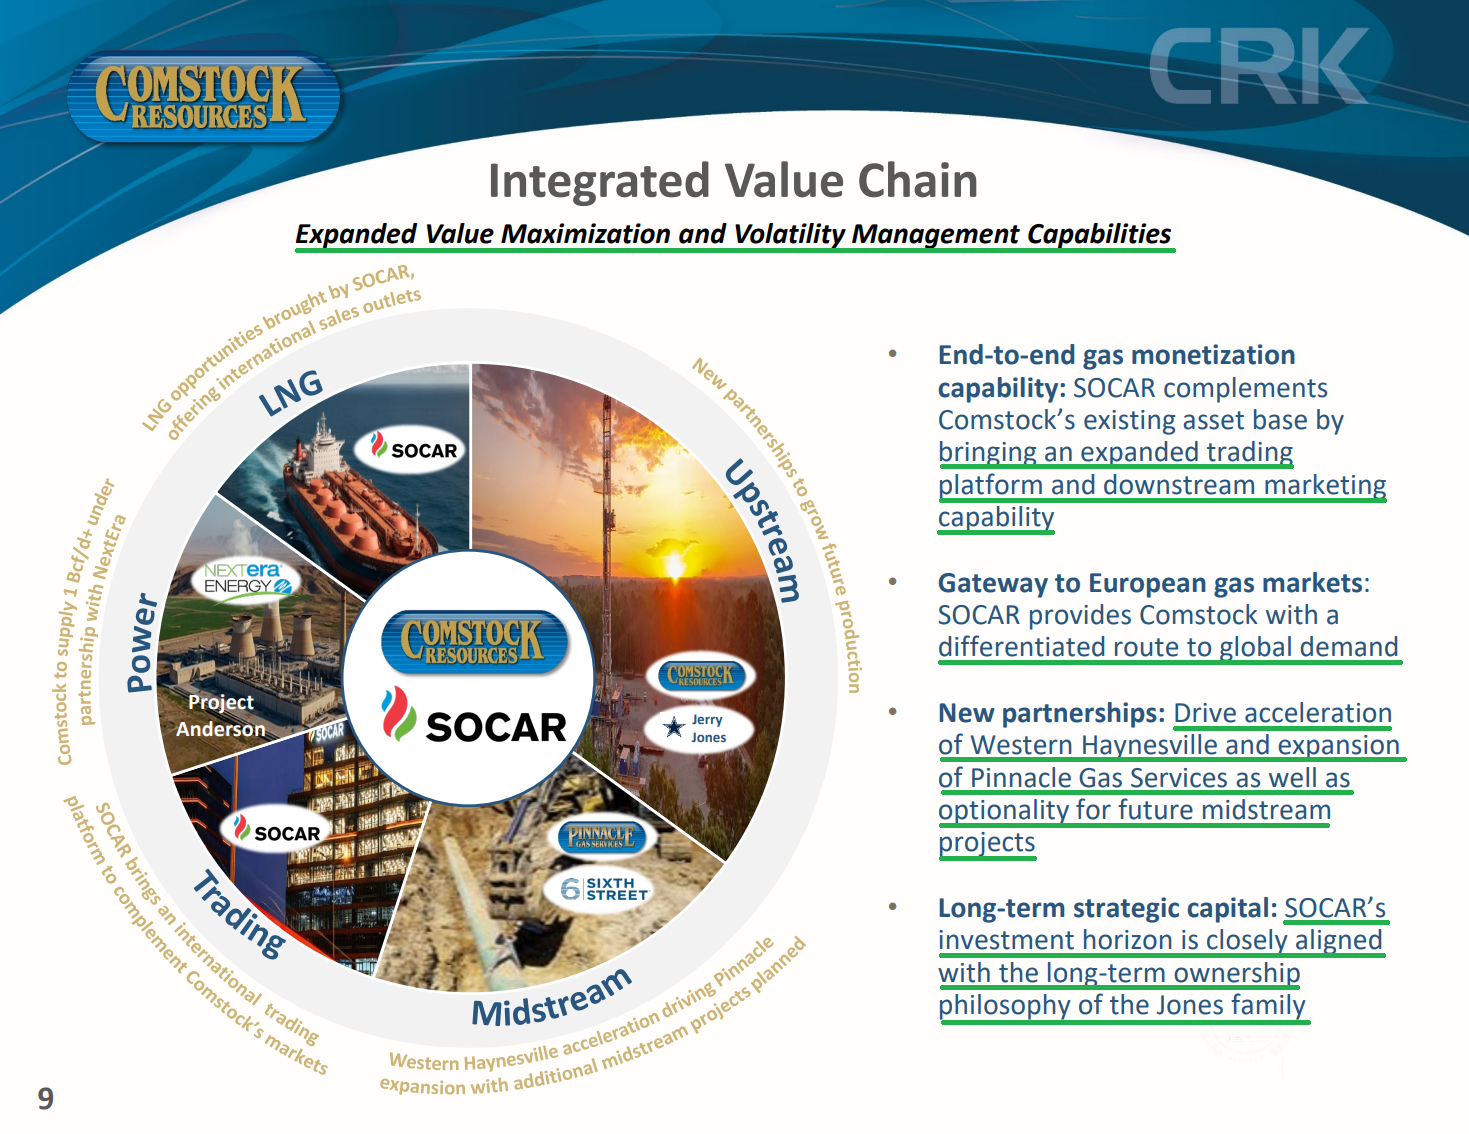
Under the agreement, SOCAR will acquire a 20% non-operated interest in the legacy Haynesville, a 15% non-operated interest in the Western Haynesville that reverts to 7.5% after five years once SOCAR earns a 15% return, and 15% of Comstock’s stake in Pinnacle Gas Services. Comstock will retain 62% of the midstream business, worth ~$1.4B against the ~$2.2B valuation implied by Sixth Street’s June investment.
The agreement is a binding letter of intent, with a definitive agreement targeted by the end of October and closing expected by year end.
The proceeds remove what has been one of the primary overhangs on the stock, cutting net debt by more than half from $3.1B to ~$1.5B. The cash will first retire the revolver, with the remainder going toward the $1.62B of 6.75% senior notes due 2029, Comstock’s most expensive debt. After that, there is nothing due until whatever remains of those 2029 notes, followed by the 2030 senior notes.
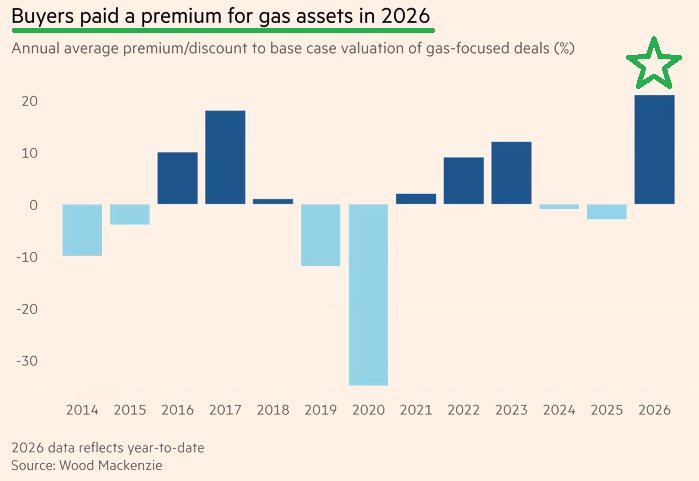
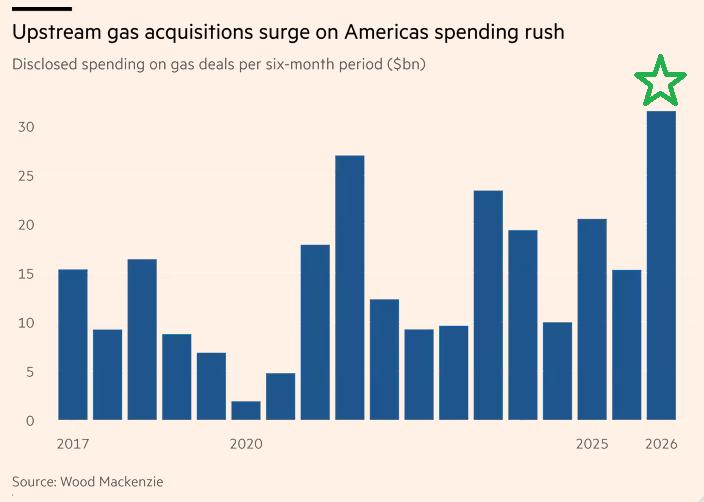
The deal also speaks to a broader trend we see playing out as international buyers look for alternatives to Middle East supply, ~20% of which has been disrupted, and pay up to secure them. U.S. producers like Comstock are on the receiving end of that scramble, with more than $32B spent on gas-focused upstream acquisitions in the first half alone and transactions pricing at an average 21% premium to valuation, the highest since 2013.

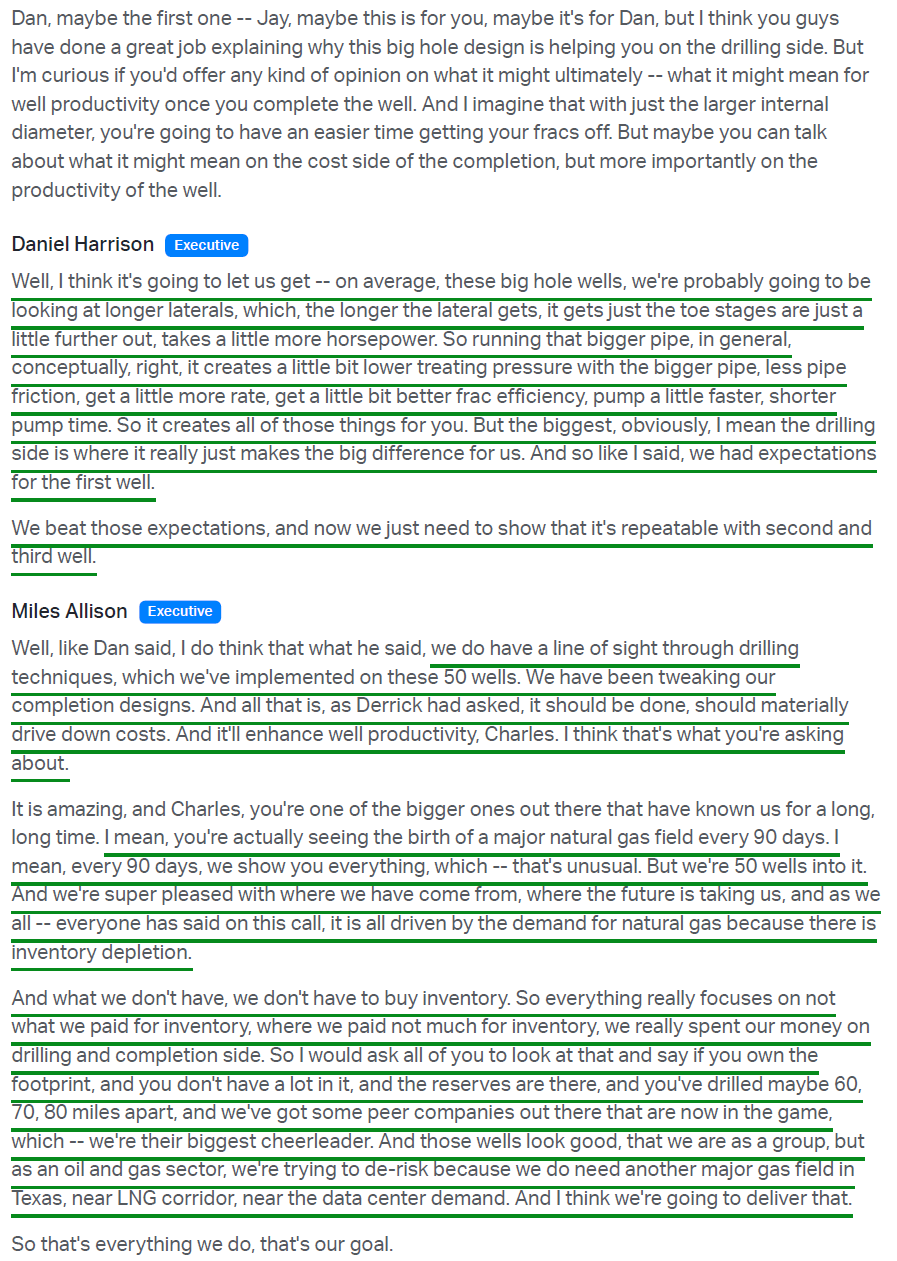
Alongside the SOCAR deal, Comstock announced a $450M drilling venture with Jerry Jones, who will fund 85% of drilling and completion costs on 18 Western Haynesville wells and 80% on nine legacy wells over the next twelve months, with half the interest reverting to Comstock once a 15% return is achieved. That comes on top of the ~71% of the company Jones already controls and more than $1.1B he has invested at ~$7 per share, another strong vote of confidence in the play from an owner with more skin in the game than anyone else.
Between SOCAR’s working interests and the Jones funding, Comstock is now fully relieved of drilling and completion costs on those wells, which represent ~80% of its current annual drilling pace in the Western Haynesville and ~20% of its pace in the legacy Haynesville. The two transactions provide ~$2.1B of balance sheet and capital relief, shift near-term development spending onto third-party capital, and allow Comstock to retain the overwhelming majority of its long-term upside in a play Jones himself has repeatedly valued at $100B of present value.
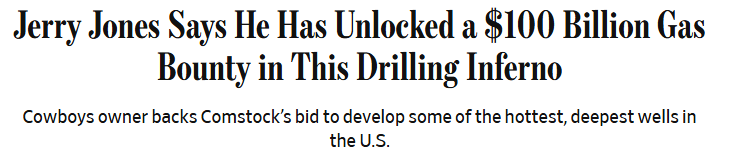
On that note, here’s a great interview from a few weeks back, just before the deal was announced, with Jerry Jones and Jay Allison on the energy edge Comstock built, why they went against the grain to buy gas acreage when nobody else wanted it, the resource potential in the Western Haynesville, and why Jones believes the position is ultimately worth more to him than the Dallas Cowboys (the world’s most valuable sports franchise at ~$16B versus CRK’s ~$3.9B market cap).
The reason we want as much exposure to this play as possible comes down to a twofer of structural demand tailwinds converging on Comstock at the same time, starting with LNG exports.
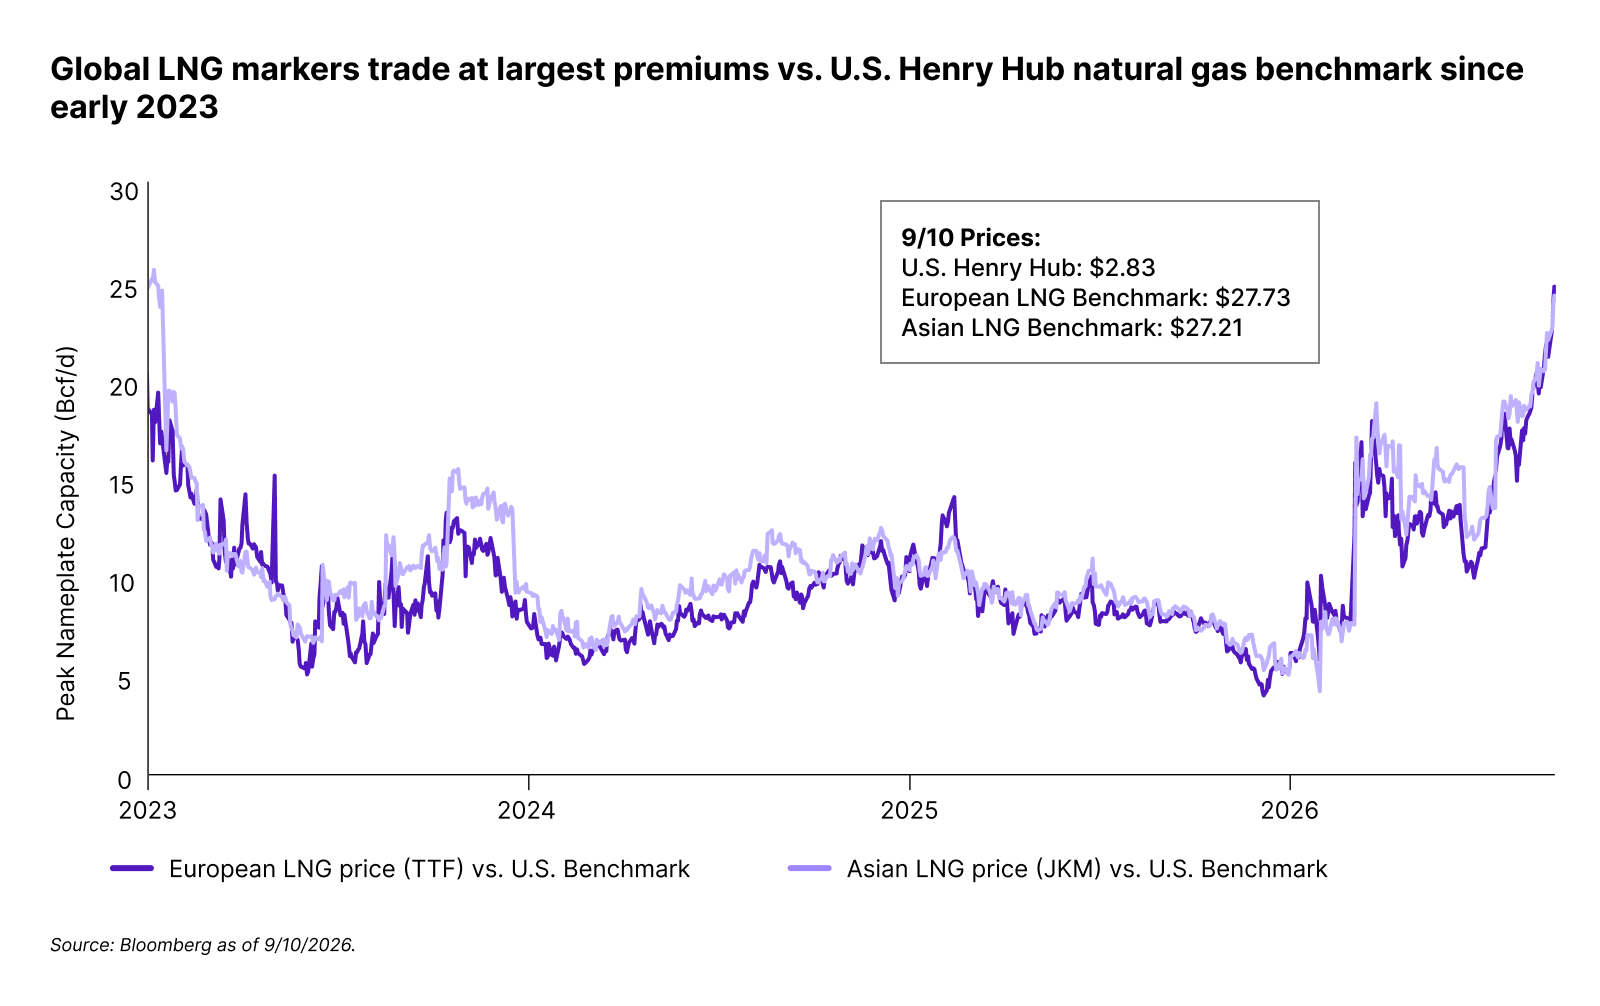
The U.S. is already the world’s largest LNG exporter and is set to ~double shipments by the end of the decade, yet it currently sends only ~20% of its natural gas production abroad. That leaves plenty of room for domestic prices to be pulled toward global markets as exports grow, with European and Asian benchmarks already trading at their largest premium to Henry Hub since early 2023 as Middle East supply remains disrupted and European storage heads into winter ~65% full, the lowest at this point in the season since 2009.
Source: VettaFi Research[/caption]
As exports grow as a share of domestic production, that pull becomes a direct boon for American producers, with Comstock positioned better than almost anyone to capture it. Its acreage sits within ~200 miles of seven of the nine U.S. Gulf Coast LNG export terminals, with four more under construction, putting Comstock directly upstream of the largest concentration of incremental U.S. LNG demand.
The SOCAR partnership adds another layer, giving Comstock access to global LNG marketing operations, trading platforms, and international pricing it never had before.
Beyond the export wave is the surge in power demand coming out of the AI and data center boom. Global data center power consumption is expected to rise ~170% by 2030, with Goldman expecting ~60% of that load to be served by natural gas, a figure BloombergNEF puts even higher at ~69% for new grid-connected facilities.

While investors are busy debating which model, which chip, and which hyperscaler wins, paying prices that assume they’ve picked correctly, every one of those outcomes requires the same thing: natural gas.
You don’t have to know the winner to own the plumbing.
In fact, Comstock’s Western Haynesville was already selected to host the $16B Texas Power Generation Hub in Anderson County, a facility with up to 5.2 GW of dispatchable generation that could take nearly 1 Bcf per day of Comstock gas by 2031.
For all the moving pieces here, the deals, the drilling techniques, the export wave, and the surge in AI-driven power demand, the thesis is actually pretty simple.
Comstock holds 19.3 Tcfe of total reserves across 3,344 net locations, supporting more than 30 years of drilling activity, yet the $5.2B PV-10 value assigns a number to only 7.2 Tcfe of it. The other twelve Tcfe carry exactly zero, which is where our downside protection comes from.
You get the lowest-cost producer in the business, sitting on one of the best-located gas footprints in America, heading straight into an LNG export wave and a power demand boom, now with a repaired balance sheet, an investment-grade partner, and a majority owner writing fresh checks alongside you.
That’s the kind of setup we’re happy to own every day of the week.
Q2 Earnings Breakdown
10 Key Points
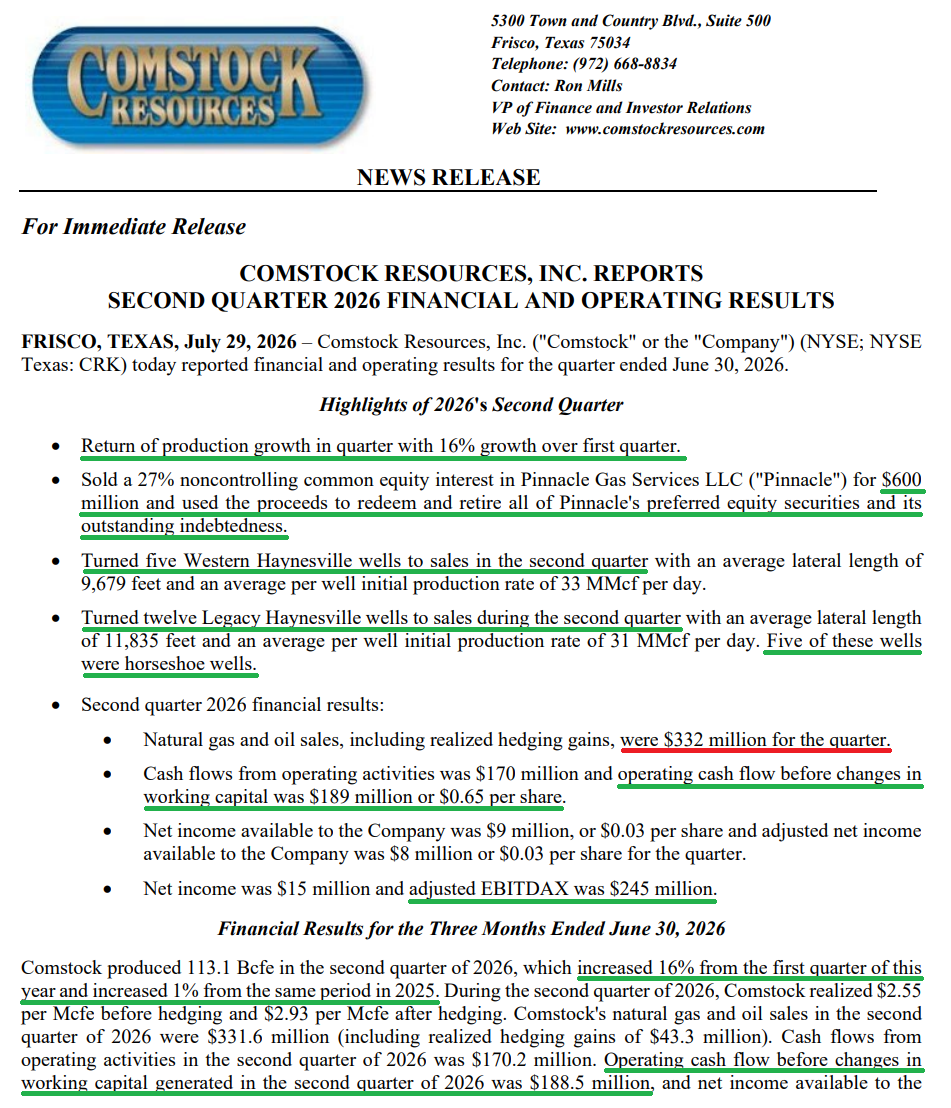
1) Natural gas and oil sales totaled $331.6M in Q2 (-3.7% Y/Y), including $43.3M of realized hedging gains. Production rebounded to 1,243 MMcfe/d (113.1 Bcfe), up 16% sequentially and 1% Y/Y, reversing the weather-driven shortfall in Q1 and topping management's guided 13% to 15% sequential increase. The pre-hedge realized gas price was $2.54/Mcf (-15.9% Y/Y), reflecting a NYMEX settlement average of $2.89 versus $3.44 last year. After hedging, the realized price was $2.93/Mcf (-4.2% Y/Y), with a larger hedge book (63% hedged vs. 56%) absorbing most of the decline.
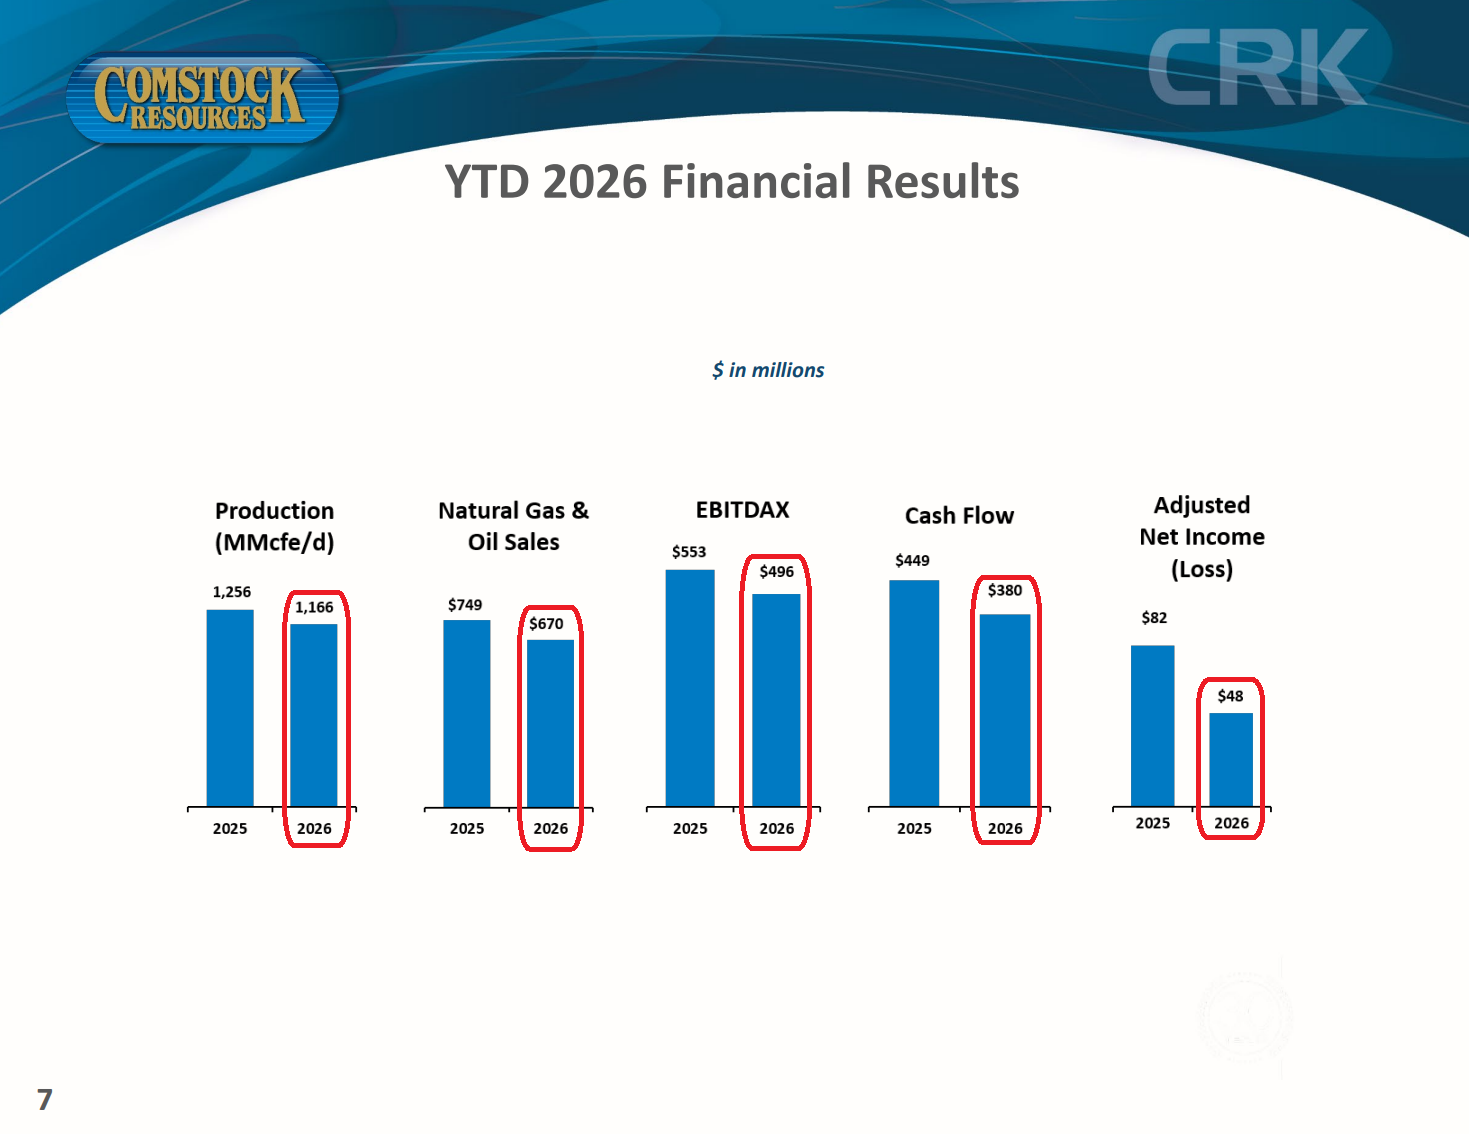
2) Adjusted net income was $8.3M, down from $34.2M last year, or $0.03 per share (-75.0% Y/Y from $0.12), in line with Street consensus of $0.03. Through the first six months, adjusted net income totaled $47.7M, or $0.16 per share, versus $82.1M and $0.28 last year.
3) Adjusted EBITDAX was $244.8M (-5.7% Y/Y from $259.7M), holding up better than the revenue print as unit costs normalized. Production costs averaged $0.77/Mcfe versus $0.80 last year and $0.93 in Q1, consisting of $0.38 gathering and transportation, $0.25 lease operating, $0.06 production and ad valorem taxes, and $0.08 cash G&A. Unhedged operating margin was 70% (-300 bps Y/Y), with hedged margin holding at 74%, keeping Comstock's cost structure ~50% below the peer average and the lowest among gas producers.
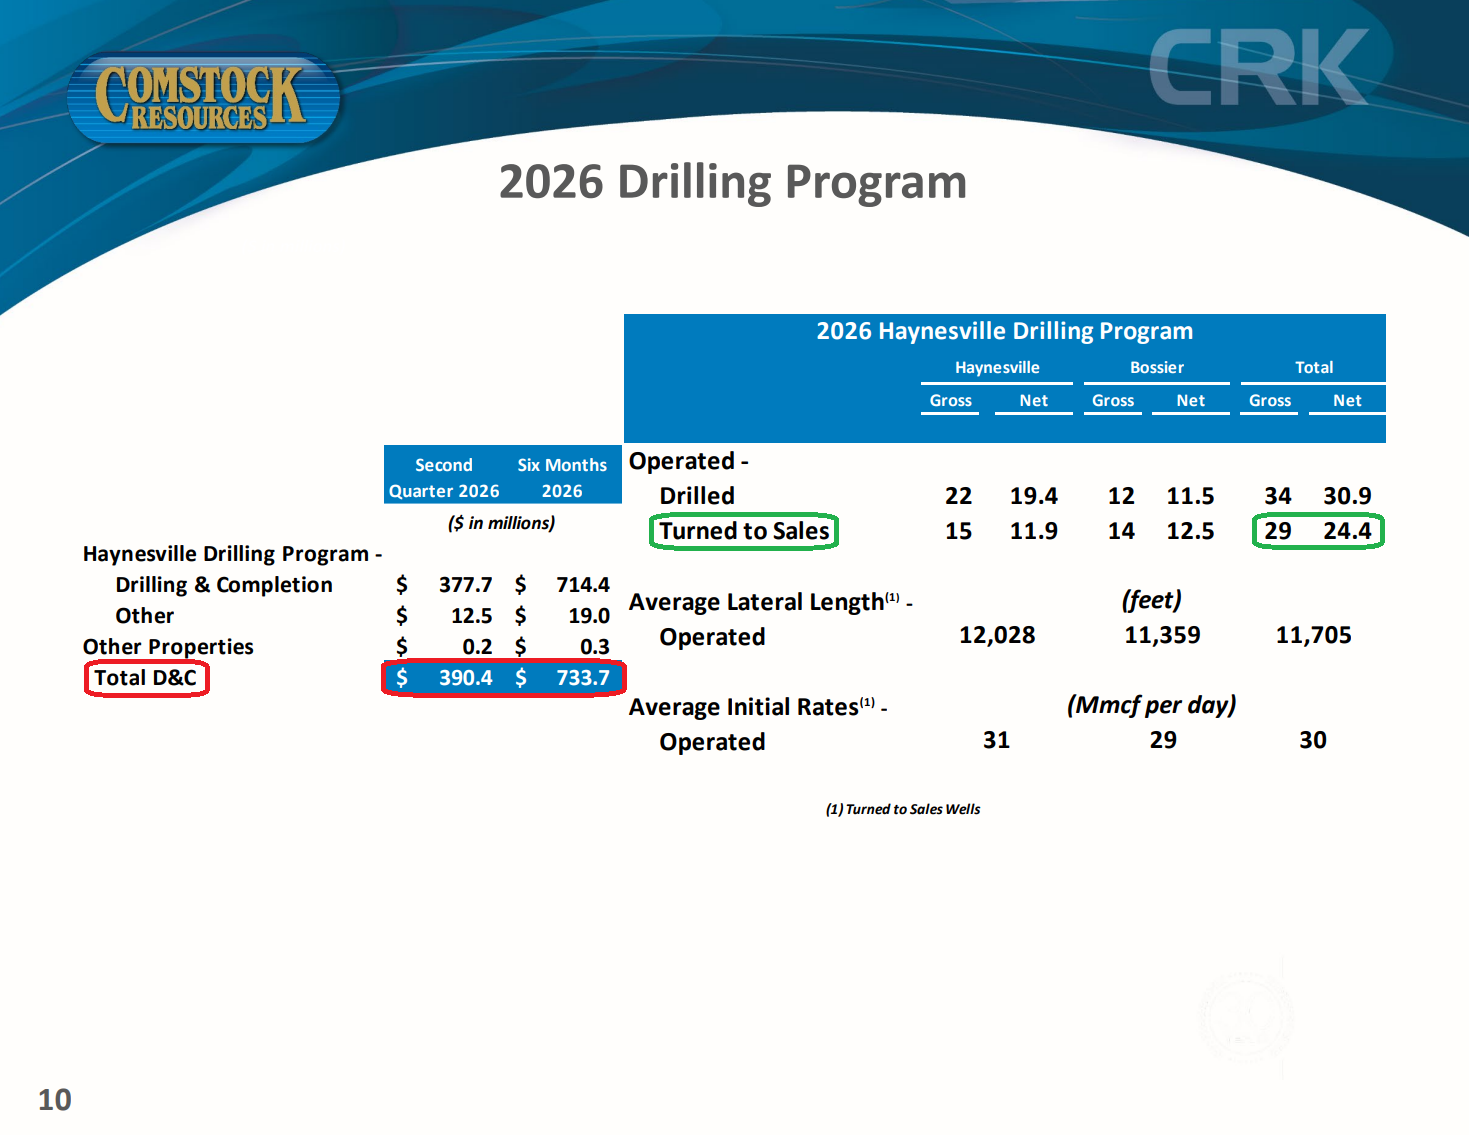
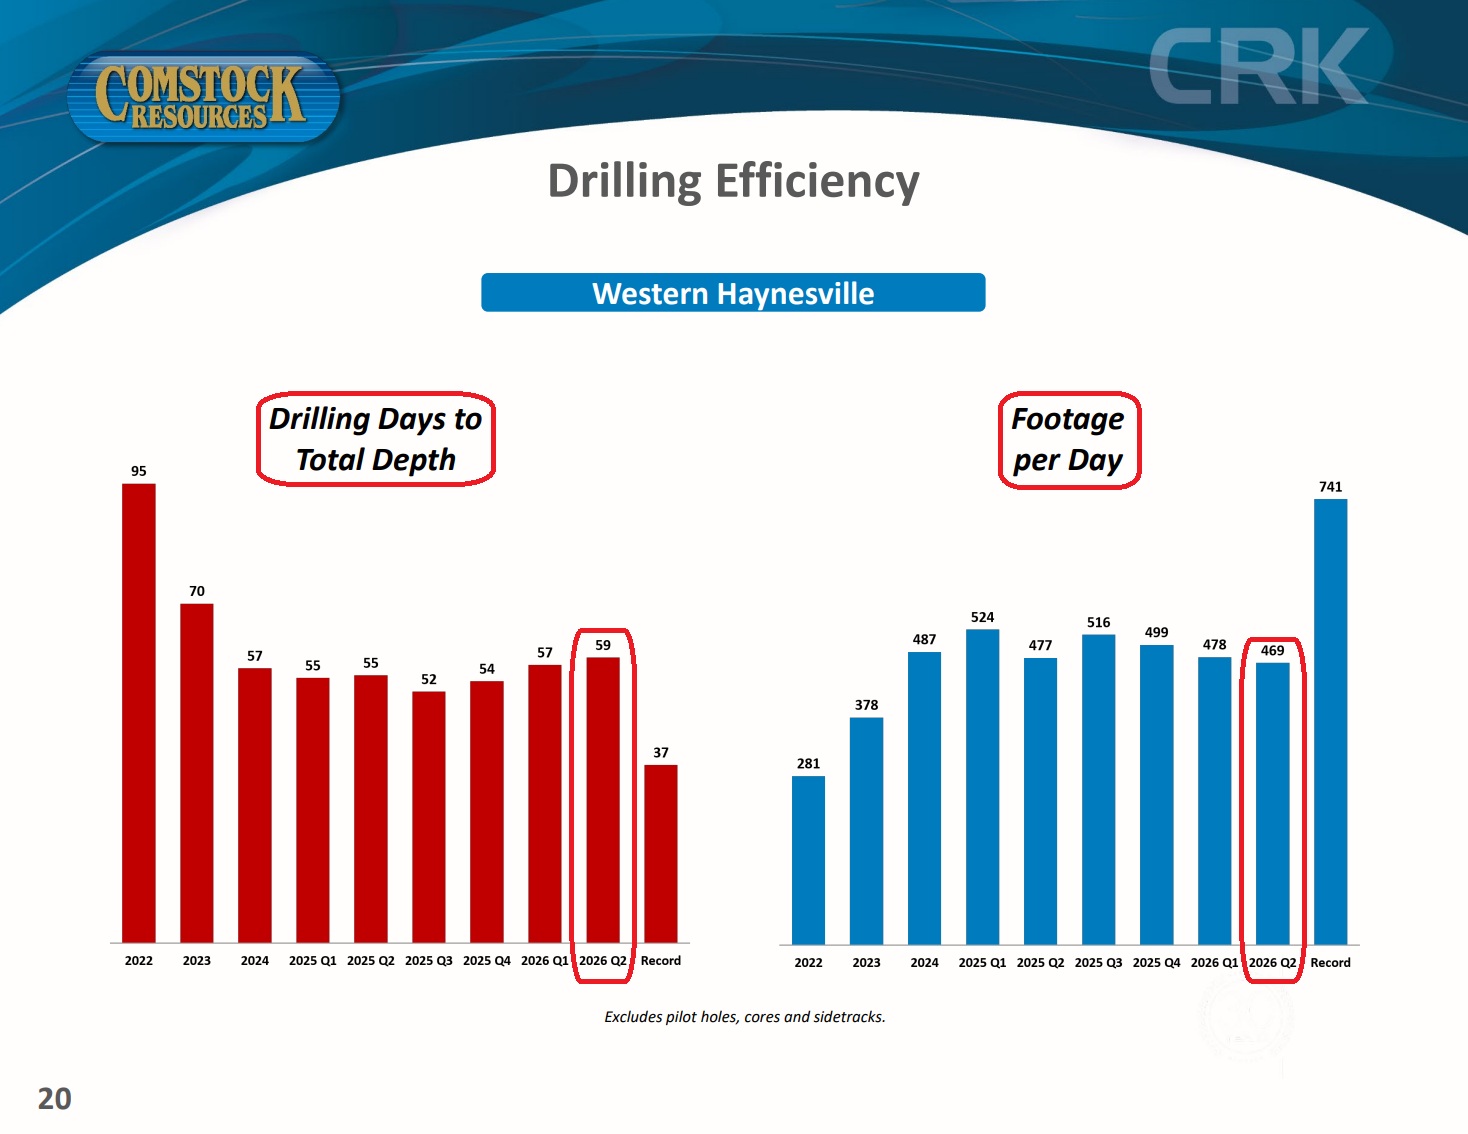
4) The Western Haynesville footprint now stands at 545,190 net acres with 2,528 net operated locations, 41 producing wells, and 50 drilled to total depth. Comstock turned five wells to sales at an average lateral length of 9,679 feet and a 33 MMcf/d IP rate, bringing the YTD total to 11 wells averaging 31 MMcf/d. The quarter's standout was the Dolly Jones, the company's first big-hole lateral, drilled at $1,306/lateral foot, ~25% below the quarterly average and the cheapest of any well Comstock has drilled below 16,000 feet, where costs typically run highest. Quarterly drilling costs rose to $1,738/lateral foot (+13.3% Q/Q) on steering difficulties requiring additional trips, with completion costs at $1,609/lateral foot (+4.7% Q/Q) on higher proppant loading and more single-well pads. Four rigs are active, with 22 wells to be drilled and 21 turned to sales in 2026.
5) Comstock turned 12 operated legacy wells to sales at an average lateral length of 11,835 feet and a 31 MMcf/d IP rate, five of them horseshoe wells, across 264,054 net acres and 717 net operated locations. Drilling efficiency improved, with days to total depth falling to 24 (-7.7% Q/Q) and footage per day rising to 1,017 (+10.4% Q/Q). Drilling costs were nearly flat at $710/lateral foot (+1.4% Q/Q) despite six horseshoe wells versus four in Q1, with completion costs at $680/lateral foot (+4.3% Q/Q) on longer drill-outs and higher flowback costs. The horseshoe program continues to deliver ~35% drilling cost savings ($800/lateral foot vs. $1,240 for short laterals), with 113 locations booked and 19 drilled to date. Five rigs are working the acreage, where management expects to drill 48 wells and turn 48 to sales this year.
6) Management is advancing several initiatives to lower Western Haynesville D&C costs. The big-hole design drills an 8.5-inch lateral versus the standard 6.75-inch slim hole, keeping downhole temperatures lower, which extends tool life and improves steering. Two more are being drilled to confirm repeatability, with roughly a dozen additional wells targeted, and management expects most future Western wells to use the design. Higher temperature-rated motors arrive in two to three months, with the first 10,000 PSI rig deploying in October and all Western rigs eventually upgraded. Management expects lower drilling costs to offset higher completion costs, leaving total D&C flat to modestly lower.
7) On June 15, Comstock closed the sale of a 27% non-controlling equity interest in midstream subsidiary Pinnacle Gas Services to Sixth Street for $600M, implying a ~$2.2B enterprise value. Comstock retains a 73% controlling interest worth ~$1.6B and continues to manage and operate the business under a management services agreement. Proceeds fully extinguished the expensive Quantum preferred units ($445M plus accrued dividends), along with all Pinnacle-level debt, leaving the entity debt-free and cutting fixed charges by ~$40M per year. Comstock's ownership steps to 80.5% once Sixth Street clears certain return hurdles.
8) Operating cash flow before working capital changes was $188.5M, or $0.65 per diluted share (-10.1% Y/Y), with cash flows from operating activities of $170.2M. Free cash flow was a $201.9M deficit versus a $58.6M deficit last year, as lower cash generation met exploration and development spending of $390.4M (+45.6% Y/Y) tied to the Western Haynesville buildout.
9) Comstock ended the quarter with $45.0M of cash and $3.13B of total debt, comprised of $545M drawn on the upstream revolver, no midstream borrowings, $1.62B of 6.75% senior notes due 2029, and $965M of 5.875% senior notes due 2030. Net leverage was 3.0x LTM EBITDAX of $1.02B, within the 3.5x upstream and 4.0x midstream covenants. Liquidity totaled $1.15B, with no maturities until the revolver comes due in November 2027.
10) Management maintained full-year 2026 production guidance of 1,250 to 1,400 MMcfe/d and total capex of $1.45B to $1.55B, plus $100M to $150M for Pinnacle. The range implies growth off FY25 production of 1,234 MMcfe/d, with the midpoint pointing to a ~7% increase. Third-quarter production is guided to 1,300 to 1,400 MMcfe/d, with the third and fourth quarters each expected to grow by a similar sequential amount, putting fourth-quarter production back near the peak levels reached in the first half of 2024.
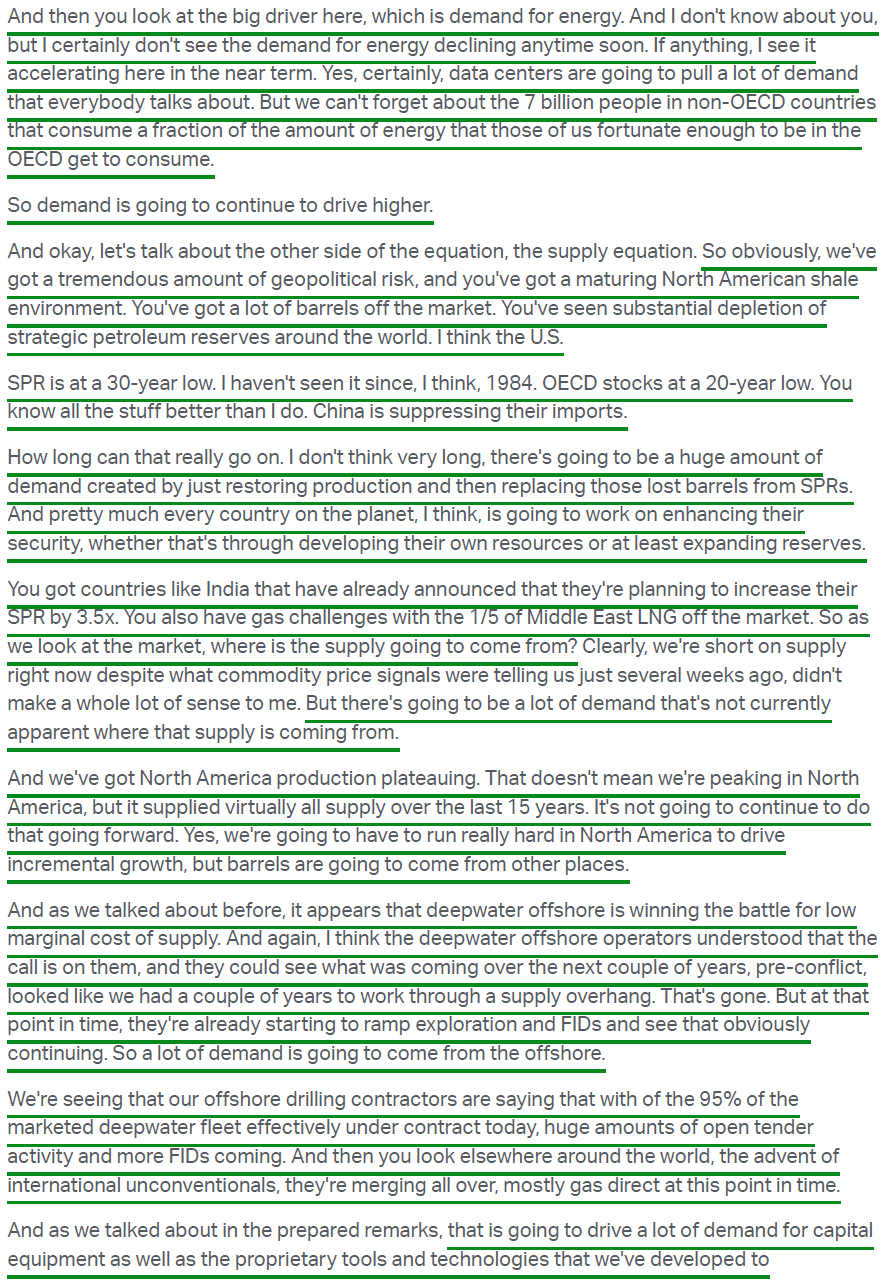
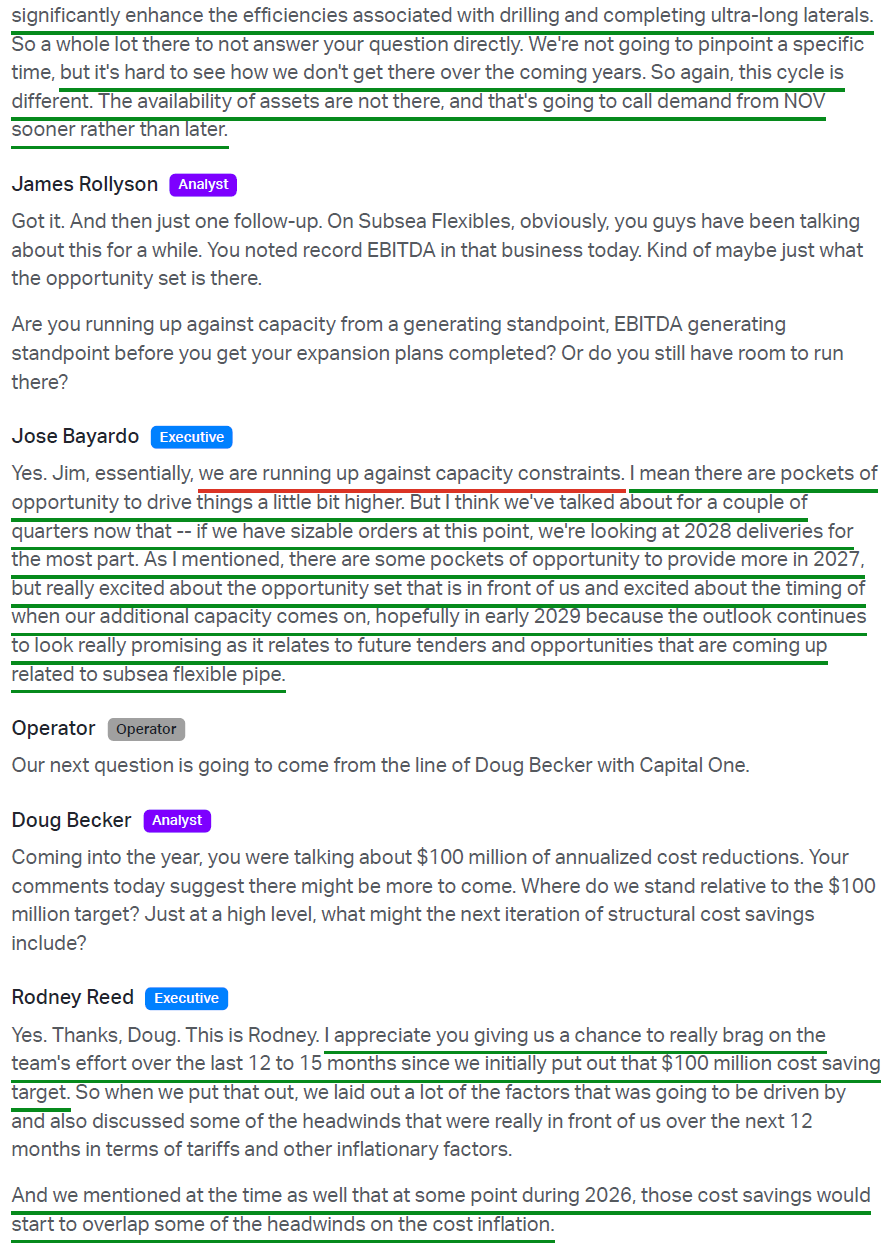
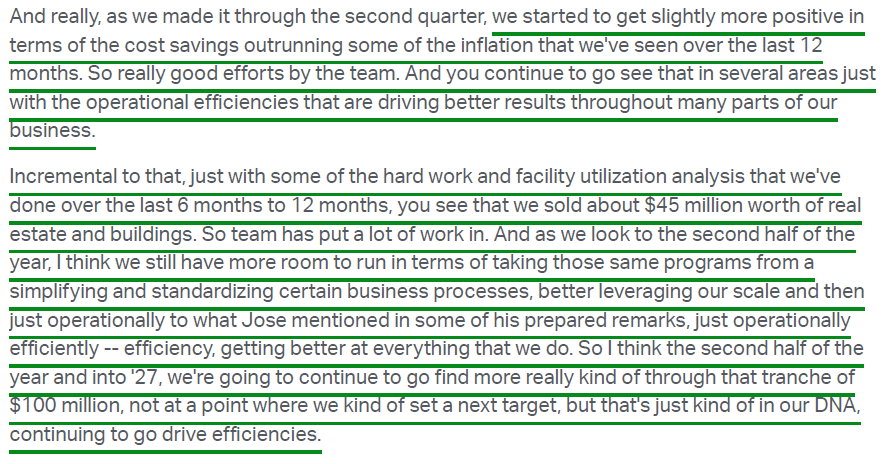
Earnings Call Highlights
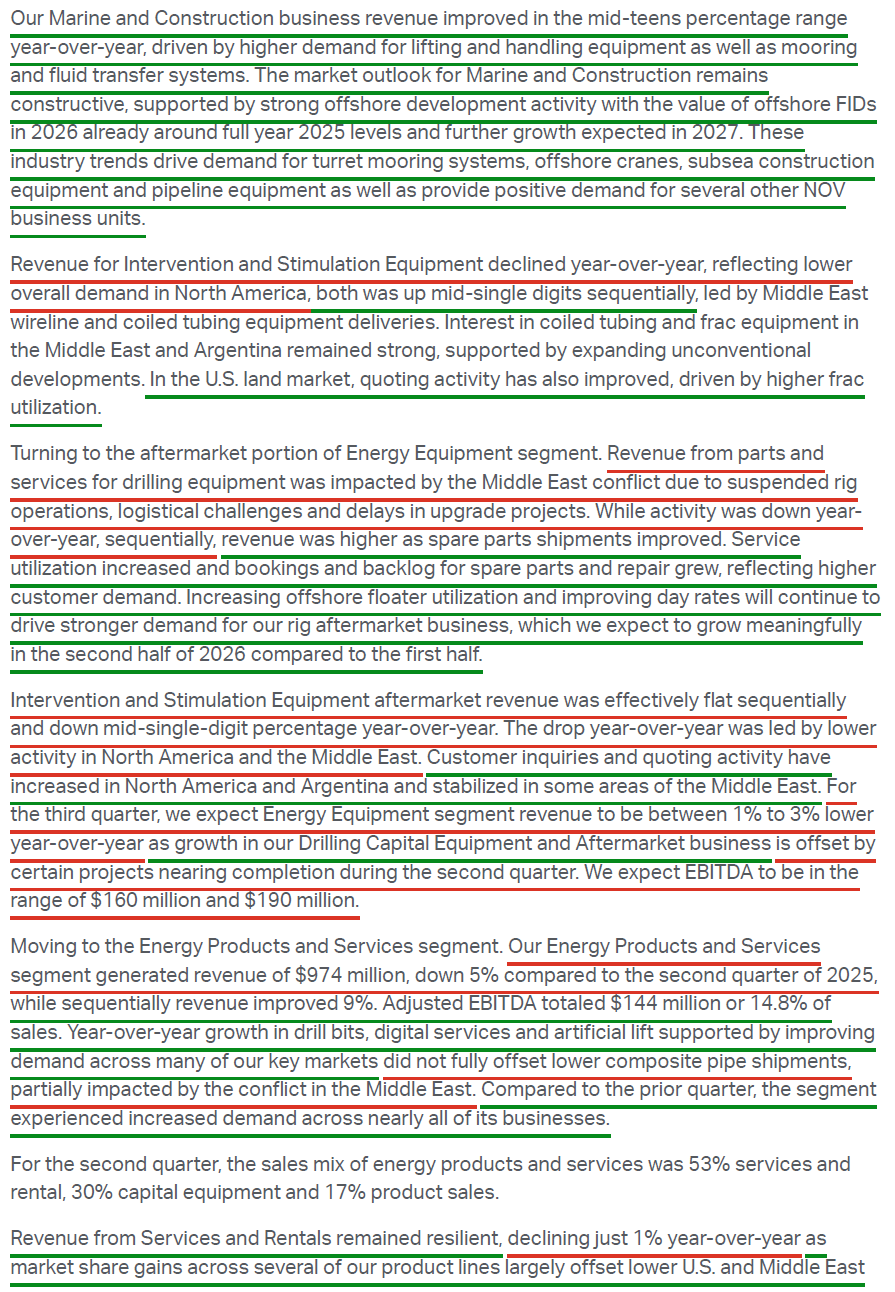
National Oilwell Varco Update
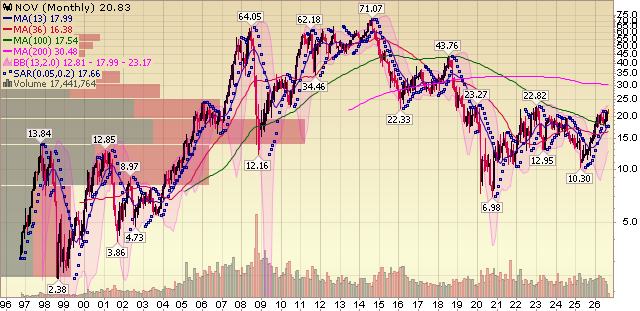
For newer readers, here’s a brief overview of our NOV thesis, a pick-and-shovel oilfield equipment leader positioned for an accelerating energy upcycle as offshore and international reassert themselves after a decade-plus of underinvestment:
NOV | NYSE | Market Cap: ~$7.5B
Pick-and-shovel energy leader with offshore inflection and strong free cash flow
Company Overview
The largest OEM of rig systems and products for onshore and offshore oil and gas drilling. 50% market share in rig equipment for over two decades, with the largest installed base in the industry.
Founded in 1862 — over 160 years of operating history in oil and gas.
Revenue mix: 52% land / 48% offshore and 36% North America / 64% international. Core products: drill bits, tubes, downhole tools, waste management, pipes, composite solutions, and drilling equipment.
High-margin aftermarket services (~22% of total sales) drive recurring revenue from the massive installed equipment base.
Pick-and-shovel exposure to the energy upcycle without heavy direct commodity price risk.
Shale Rolling Over = Return of Offshore + International
U.S. shale drove over 80% of global supply growth from 2011 to 2021, leading to a decade-plus of underinvestment in exploration. Many shale basins are now plateauing, and returns are becoming less economical.
Offshore and deepwater marginal costs are now below U.S. shale (~$40/bbl), making offshore the primary incremental supply source going forward.
~95% of the marketed deepwater fleet is currently under contract, the tightest level since the prior cycle, with day rates and floater utilization improving.
Offshore contracting activity increased 32% sequentially, with customers expecting a sizable pickup in project start dates in late 2026 and early 2027.
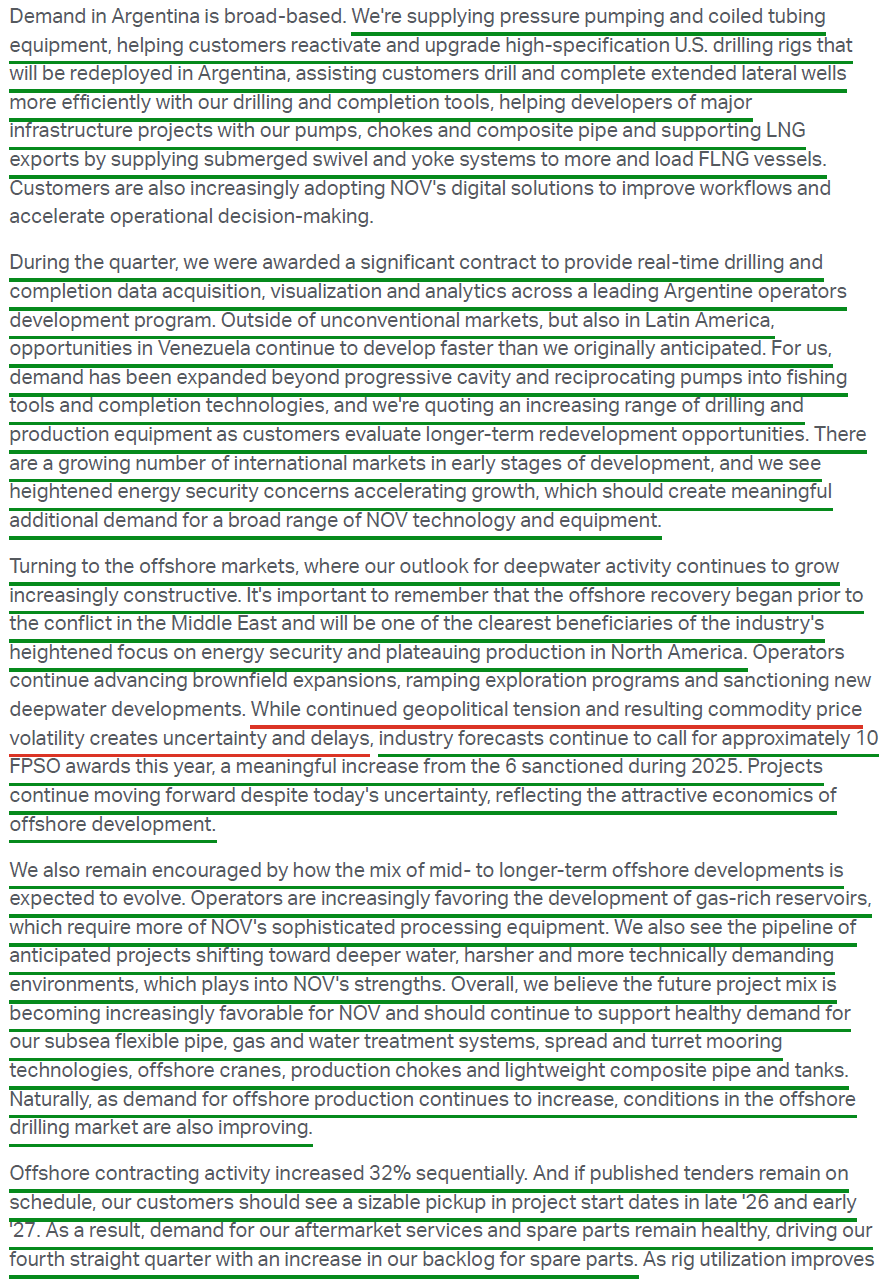
Industry forecasts call for ~10 FPSO awards in 2026, up from 6 sanctioned in 2025, with 6 FPSO FIDs already reached year-to-date and each representing a $100M to $700M opportunity for NOV. NOV has secured meaningful bookings on half of the YTD FIDs and on 11 of the last 24.
The forward project mix is shifting toward gas-rich reservoirs, deeper water, and harsher environments, all of which favor NOV's processing equipment, mooring systems, flexible pipe, and composite solutions.
Subsea flexible pipe posted another record quarterly EBITDA, with a trailing-twelve-month book-to-bill of ~135% and backlog +28% Y/Y now extending into 2028. The business is running against capacity, with sizable new orders slating to 2028 deliveries and the $200M Brazil expansion (roughly doubling capacity) coming online in early 2029. NOV recently delivered a cumulative 1,000 km of flexible pipe from its Brazil facility.
Growth reacceleration expected in 2027, setting the stage for a much more attractive operating environment.
Management sees late 2026 and 2027 as potentially the environment where “all 8 cylinders of NOV's engine can fire.”
International unconventionals are an emerging bright spot, with accelerating activity in Argentina, Algeria, and Pakistan — core bread-and-butter for NOV's product portfolio.
Venezuela Opportunity
World's largest proven reserves (~303B barrels). NOV has a long history in the country dating back to 1949, employing over 450 people before shutting down operations.
Historic peak over 3M bpd, now under 1M bpd after decades of mismanagement, underinvestment, and sanctions — over $100B in infrastructure rebuild needed.
Opportunities continue to develop faster than originally anticipated, with demand expanding beyond progressive cavity and reciprocating pumps into fishing tools and completion technologies, and an increasing range of drilling and production equipment now being quoted as customers evaluate longer-term redevelopment.
Oilfield services are the early and quiet beneficiaries — near-term gains likely services-led (workovers, reactivations, facility repairs, pipes, tubing, rig tech deployment) before majors commit to multi-year redevelopment programs.
Middle East Conflict
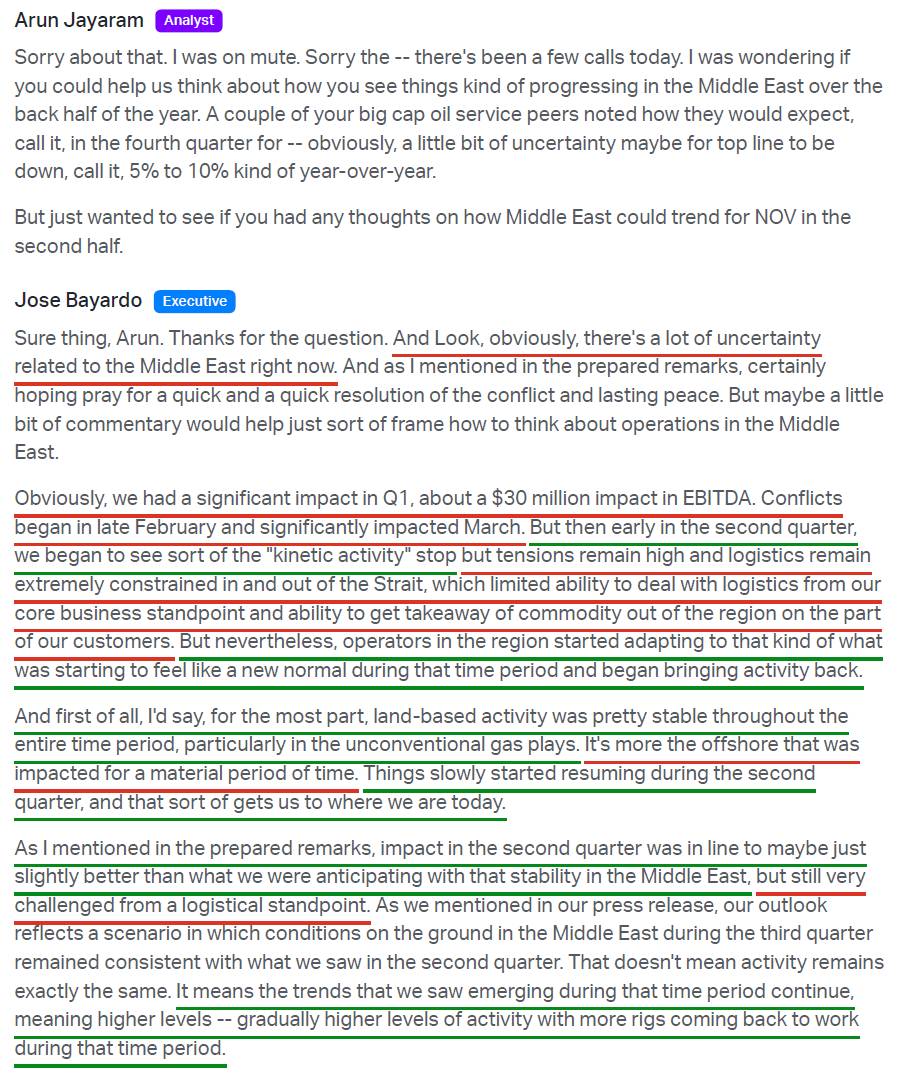
Q1 2026 results were negatively impacted by an estimated $54M in revenue and $32M in adjusted EBITDA. By Q2, the bulk of kinetic activity had ceased and conditions stabilized into what management called a new normal, though logistics remained less predictable and more costly. The Q2 impact came in line to modestly better than expected.
The Middle East represents ~15% of total company revenue. Land activity, particularly unconventional gas, held up throughout, while offshore absorbed the curtailments and deferrals.
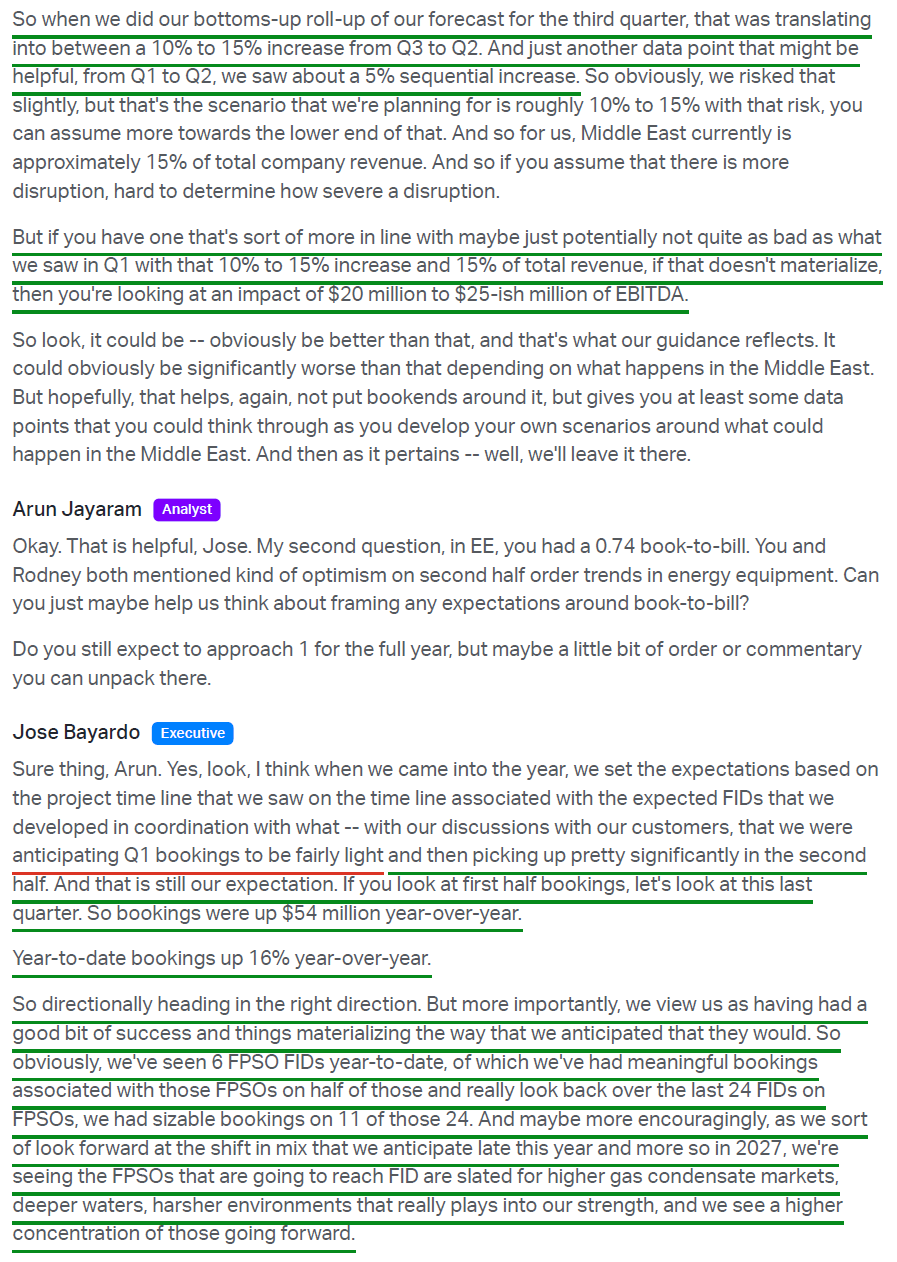
Q3 guidance assumes conditions remain consistent with Q2, implying 10-15% sequential growth in regional activity, with management planning conservatively toward the lower end. A renewed disruption would carry a potential $20-25M EBITDA impact.
The conflict has materially shifted the global oil market outlook, with what was expected to be a 2-3M bpd surplus in 2026 rapidly flipping to a meaningful deficit driven by ~10M bpd of shut-in production.
Industry analysis suggests ~10,000 wells across the region are currently offline, with up to 3,000 requiring meaningful intervention and roughly 1,000 potentially requiring major workovers, and permanent capacity loss potentially ranging from 500K to 2.5M bpd.
Management views the conflict as having accelerated and amplified a meaningful new capital equipment upcycle, with the work required to restore production alone driving elevated activity over multiple quarters and potentially longer.
Key Financials
2025 revenue of $8.74B, down just 1% Y/Y against a 7% decline in global drilling activity. Adjusted EBITDA of $1.03B — third consecutive year above $1B.
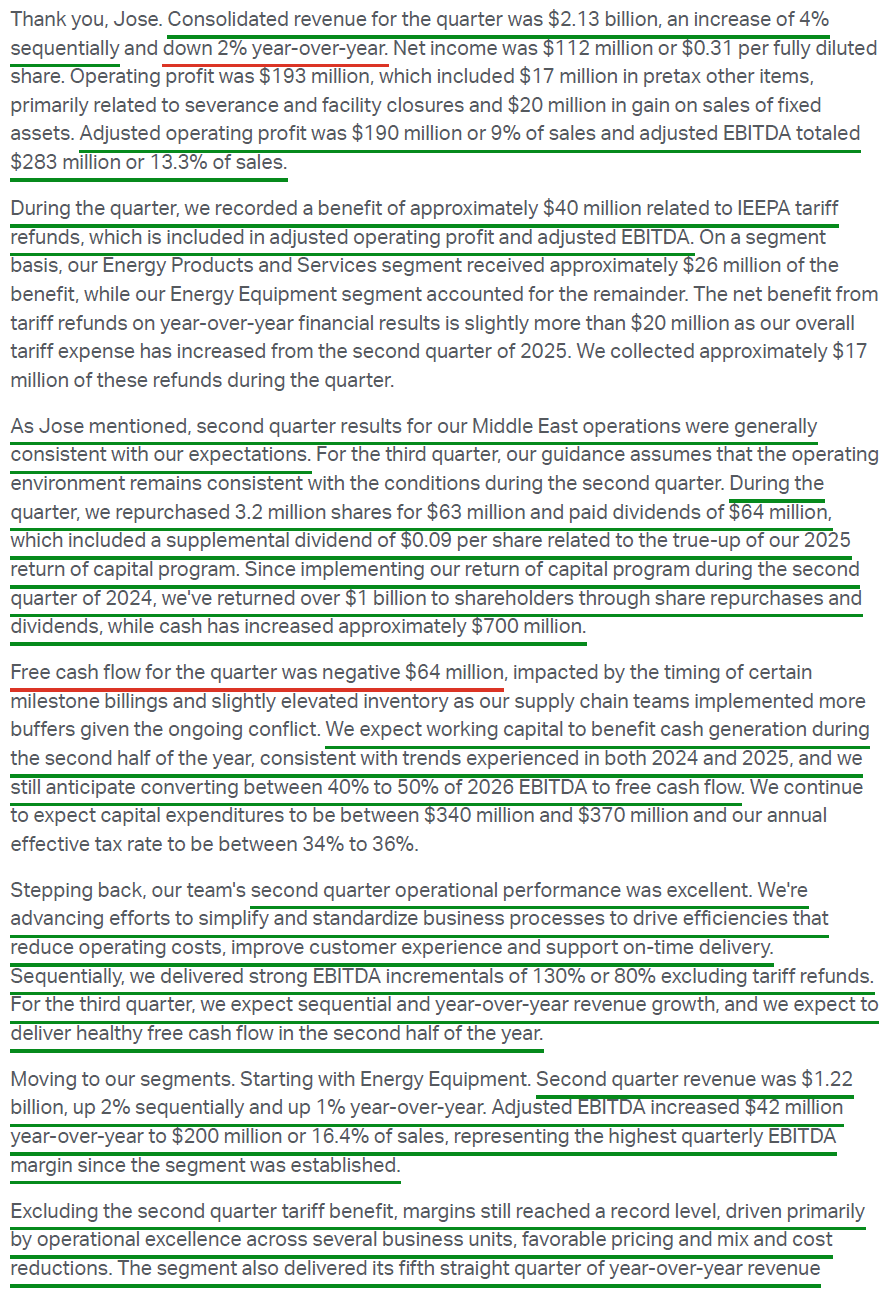
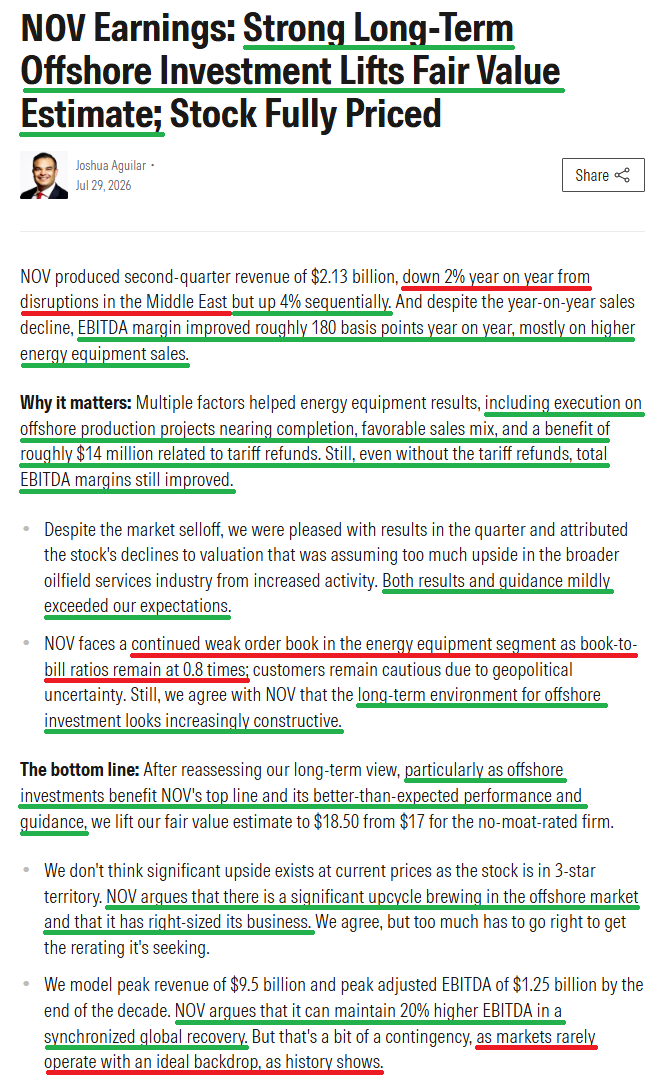
Q2 2026 revenue of $2.13B (-2% Y/Y, +4% sequentially) with adjusted EBITDA of $283M (13.3% margin, +180 bps Y/Y), which included a ~$40M IEEPA tariff refund. Ex the refund, EBITDA was $243M (~11.4% margin).
Incremental margins inflected in Q2, with ~80% of sequential revenue growth converted to EBITDA and Y/Y decrementals held to 17% ex-refund, despite tariff expense rising ~$20M Y/Y to ~$30M.
FCF of ~$876M in 2025 (~12% FCF yield). Second consecutive year of over 85% conversion — the best two-year FCF stretch in over 10 years.
Full-year 2026 EBITDA-to-FCF conversion expected at 40-50%, with the midpoint implying ~$419M of FCF at consensus EBITDA estimates.
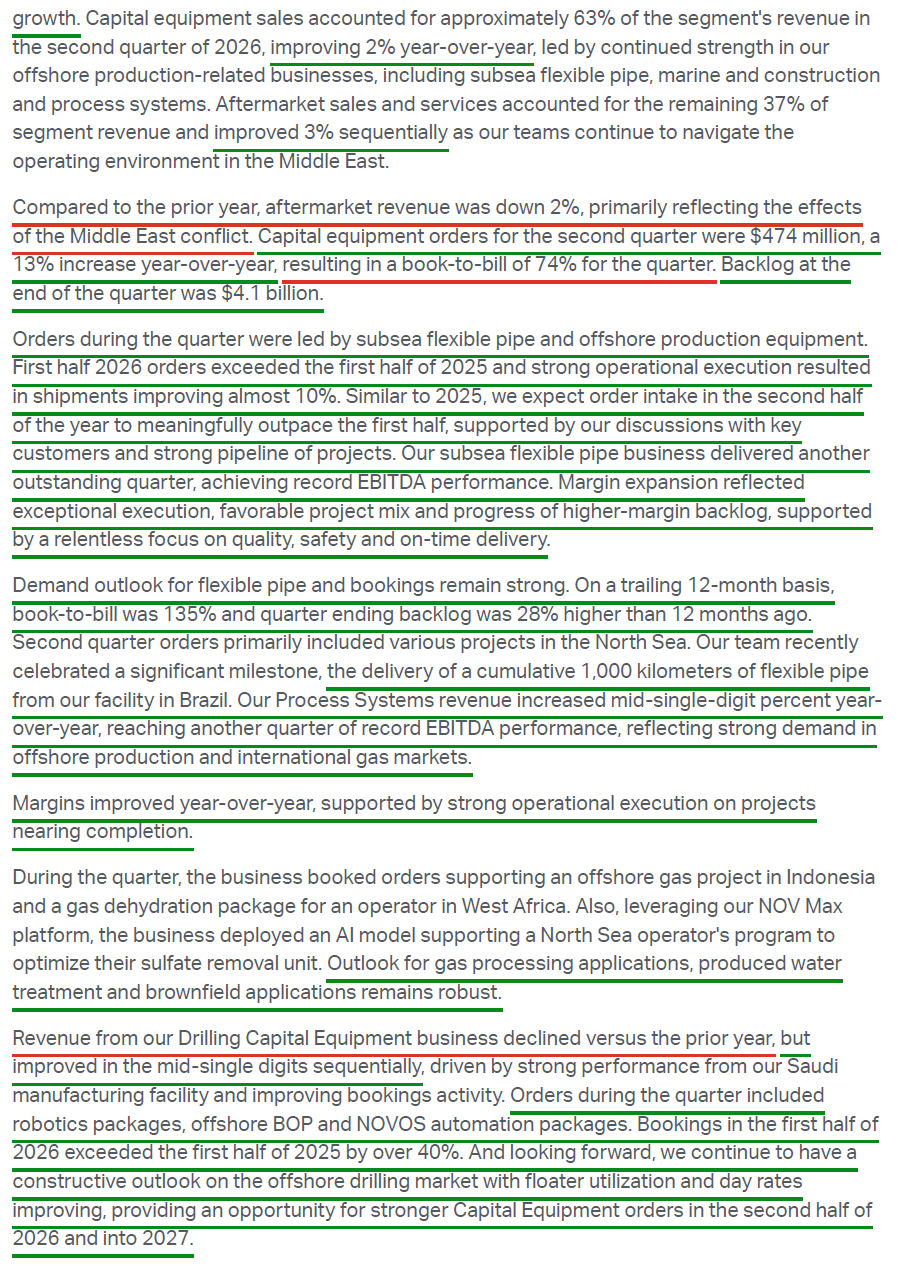
Energy Equipment backlog of $4.08B at end of Q2 2026. Q2 new orders of $474M, +13% Y/Y, for a 74% book-to-bill, with first half orders up 16% Y/Y and shipments up nearly 10%.
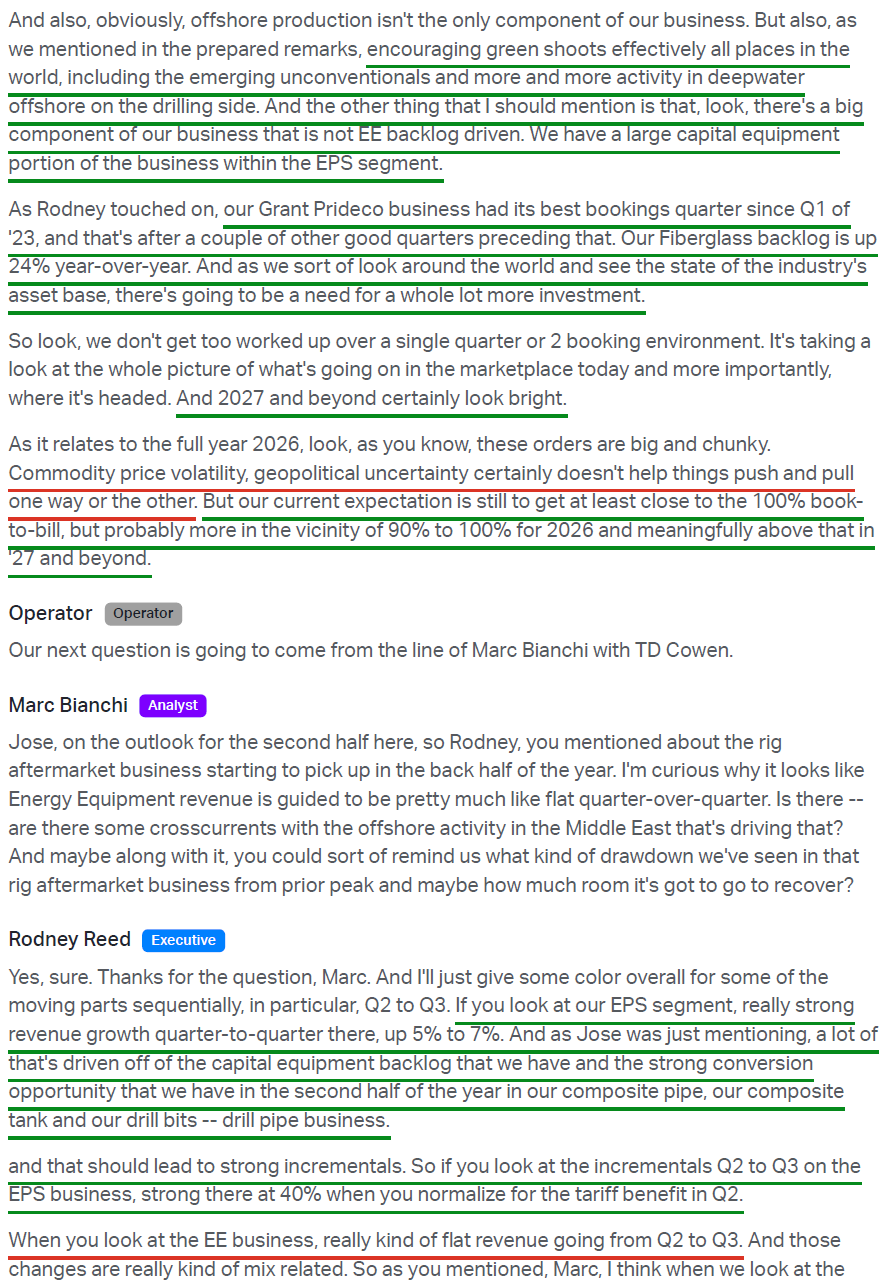
Management expects 2H order intake to meaningfully outpace 1H and full-year book-to-bill in the 90-100% vicinity, moving materially higher in 2027.
Energy Equipment posted record segment EBITDA margins of 16.4% in Q2 (15.3% ex-refund, +220 bps Y/Y), the highest since the segment was established.
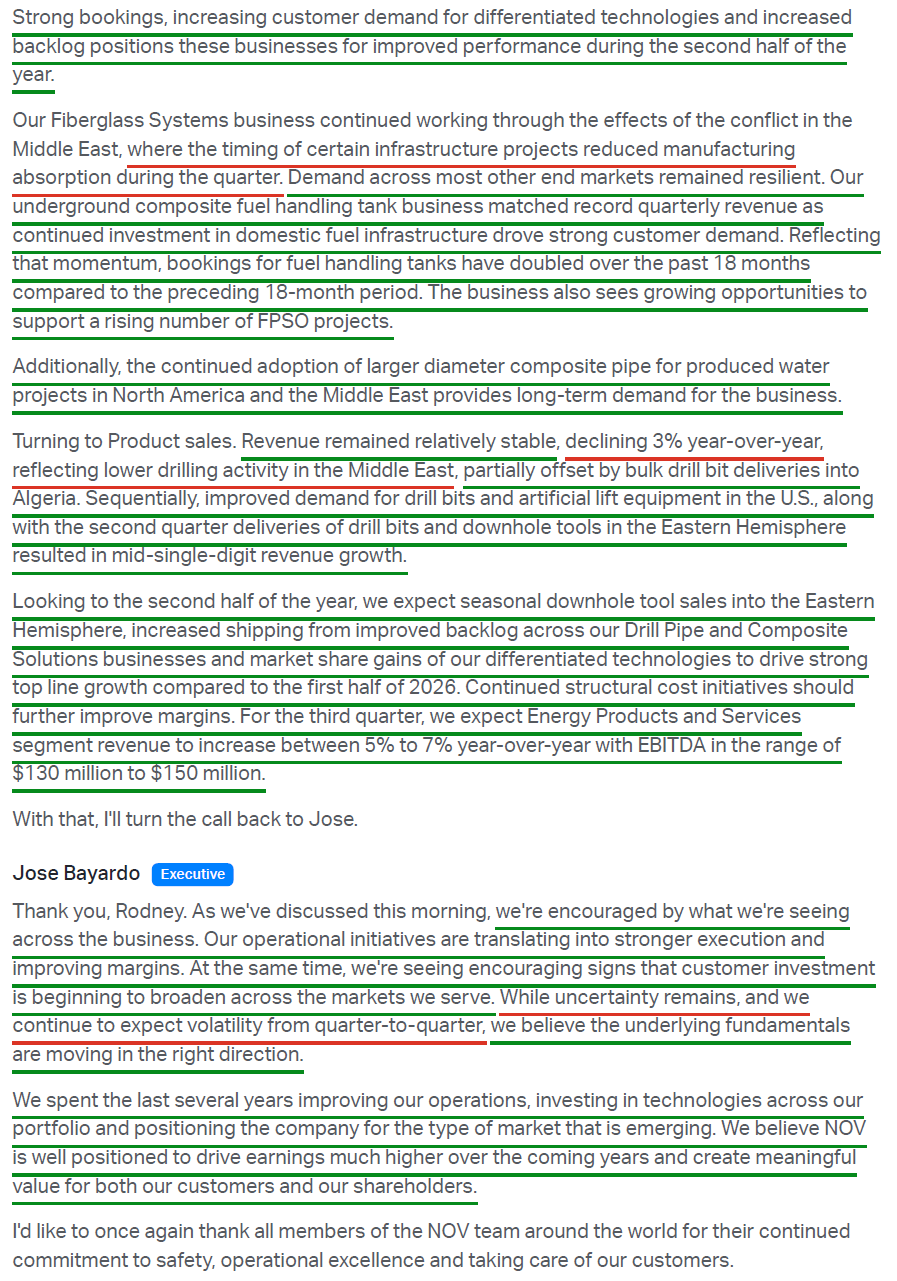
Drill pipe booked its strongest first half in over 10 years with backlog roughly doubling Y/Y, and fiberglass backlog grew ~20% Y/Y, setting up stronger 2H shipments.
Cost savings of >$100M annualized on track for completion by end of 2026, with NOV reducing global headcount by ~8% and exiting more than 40 facilities since Q1 2025. Savings began to outrun tariff and inflation headwinds in Q2, and the team monetized ~$45M of real estate from facility rationalization.
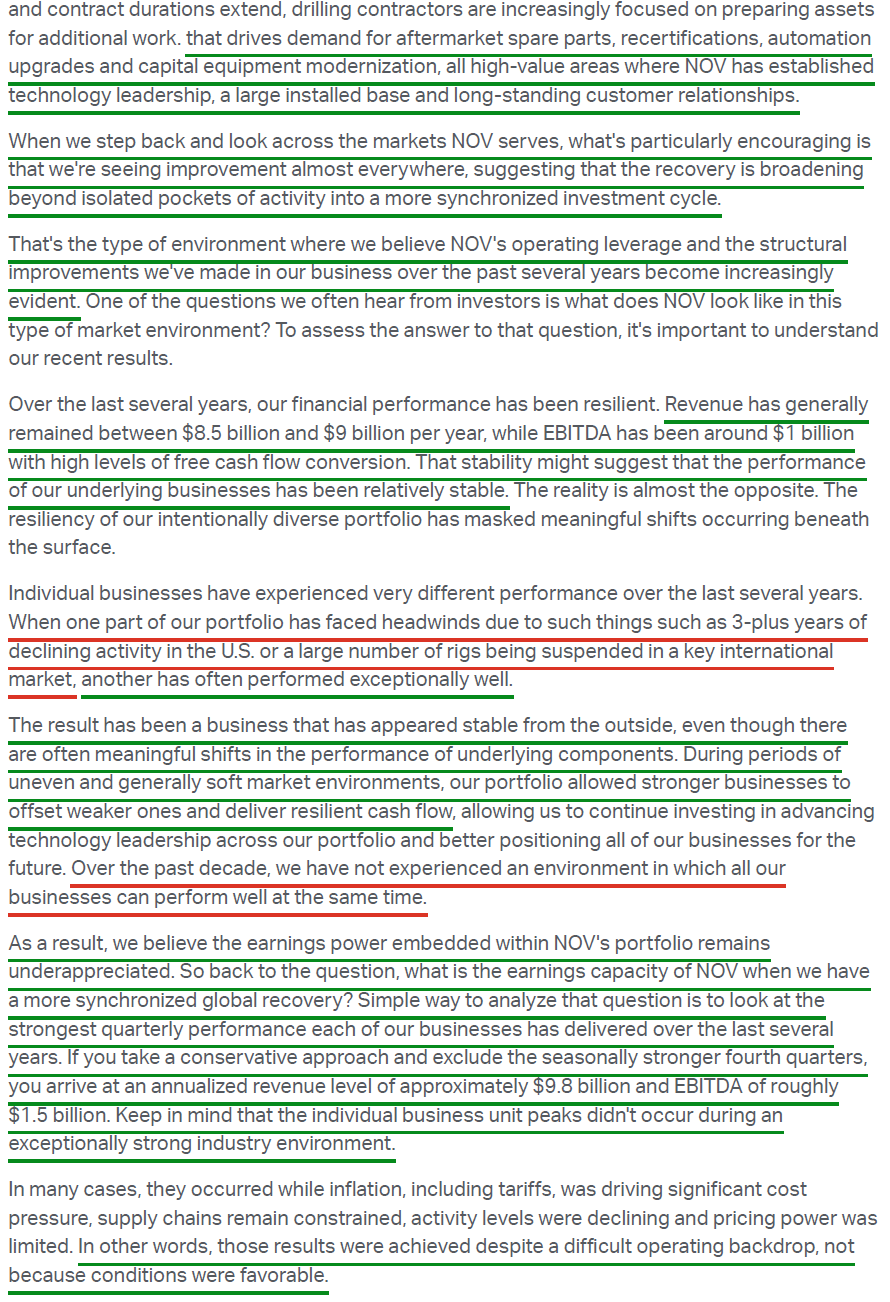
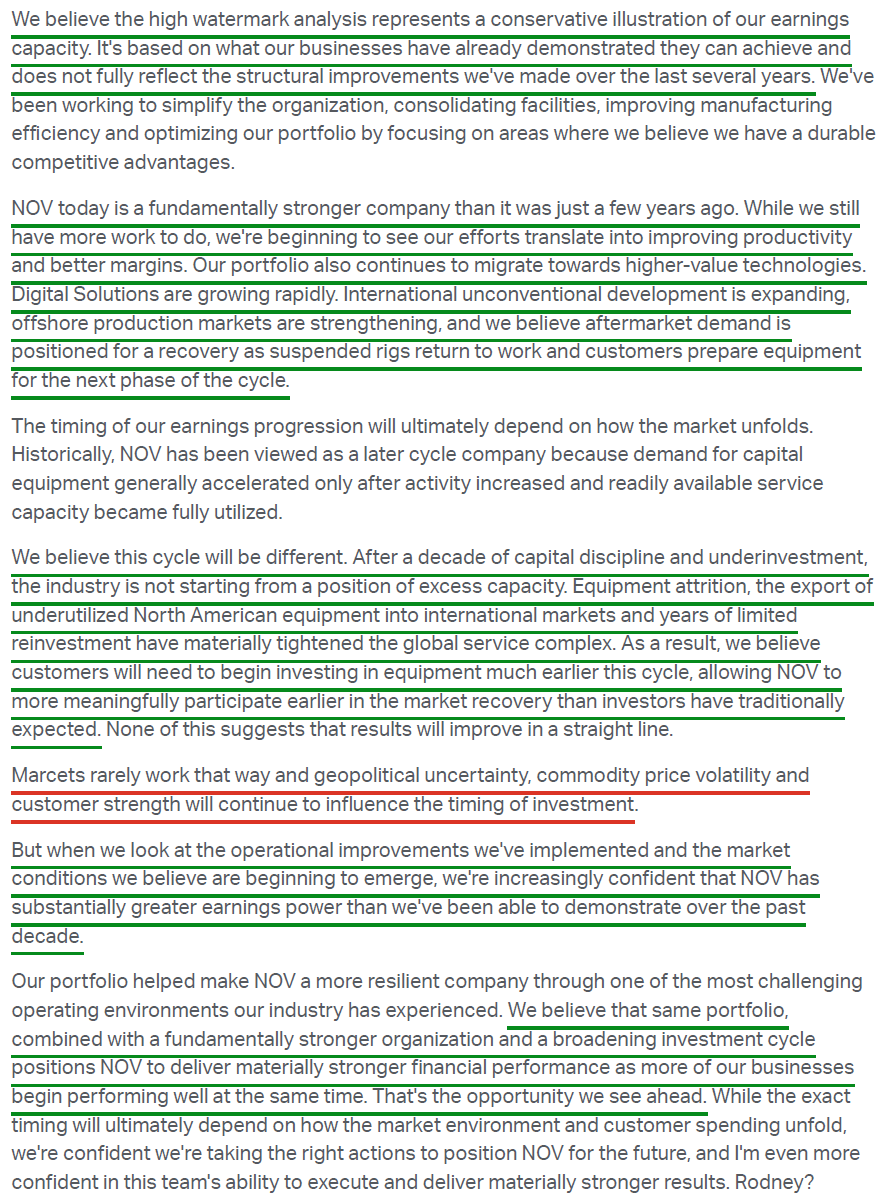
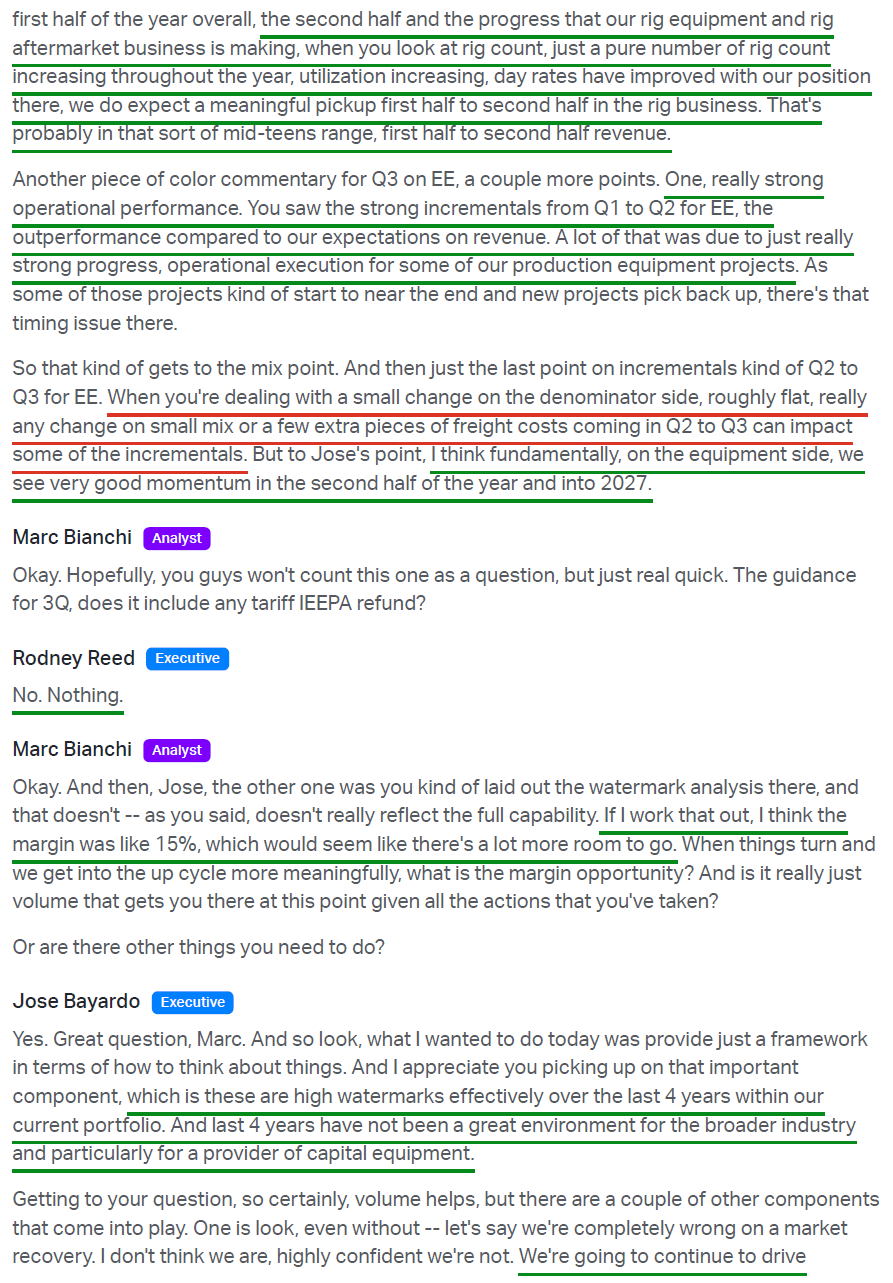
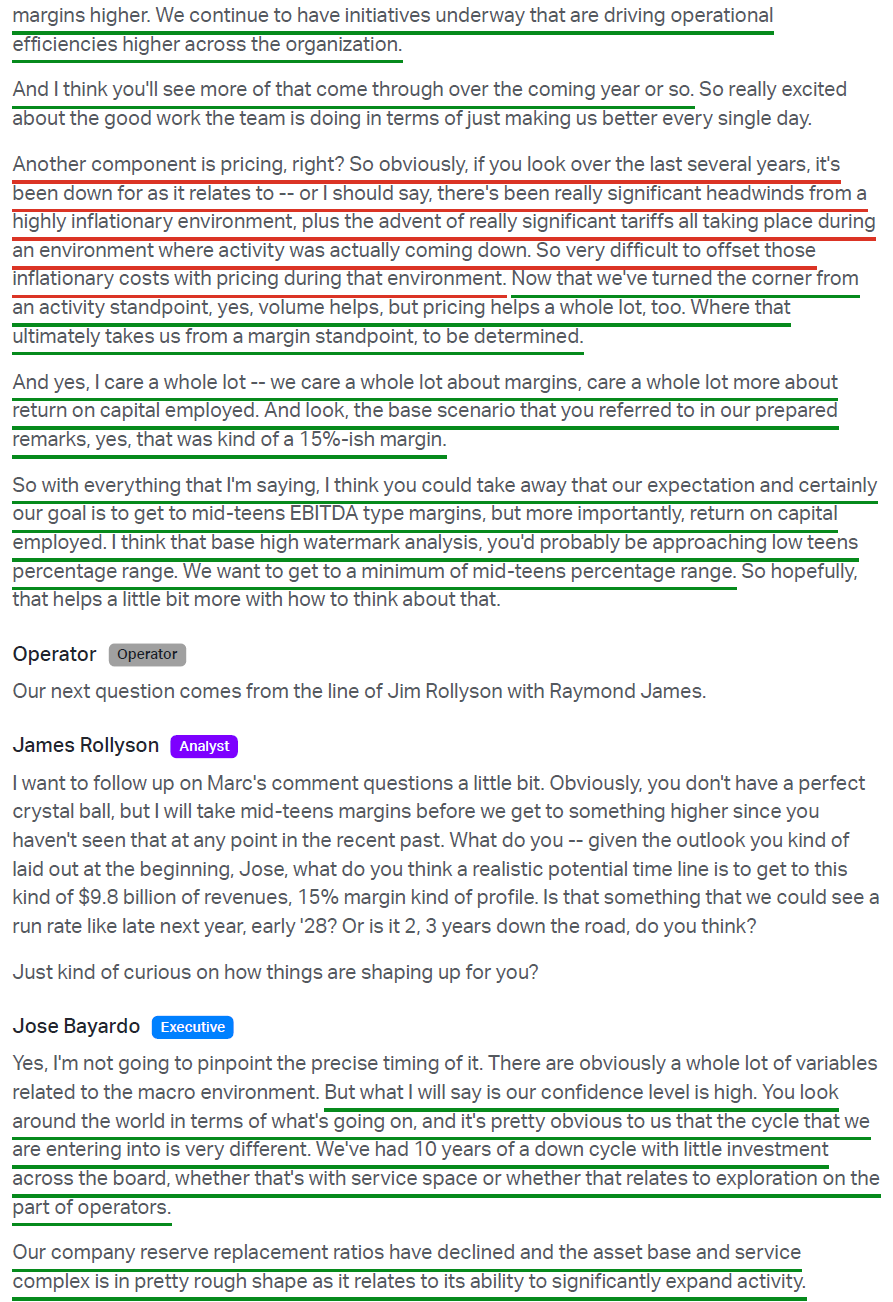
Management's “high watermark” framework, combining each business unit's best recent quarter while excluding seasonally strong Q4s, annualizes to ~$9.8B of revenue and ~$1.5B of EBITDA at a 15.3% margin vs. 11.8% in FY25.
Those peaks were set during declining activity, inflation, and tariffs, with management targeting mid-teens margins and higher returns on capital as the cycle broadens.
Balance sheet: $1.16B cash / $1.71B debt puts net debt at ~$542M, or ~0.5x net leverage and ~1.7x gross on TTM EBITDA. $1.50B available on the revolver. Investment-grade credit rating with no maturities until 2029. Revolving credit facility recently extended one year through 2030.
Dividend + Repurchases
Dividend yield ~2.1%
Returned $127M to shareholders in Q2 2026 through $63M in share repurchases (3.2M shares) and $64M in dividends, the latter including a $0.09 supplemental dividend to true up the 2025 return of capital program. First-half returns totaled $227M.
Since launching the return of capital program in Q2 2024, NOV has returned over $1B to shareholders while growing cash ~$700M.
Committed to returning at least 50% of excess FCF to shareholders annually.
Share count down over 8% in the past three years — the lowest level in 18 years.
Q2 Earnings Breakdown
10 Key Points
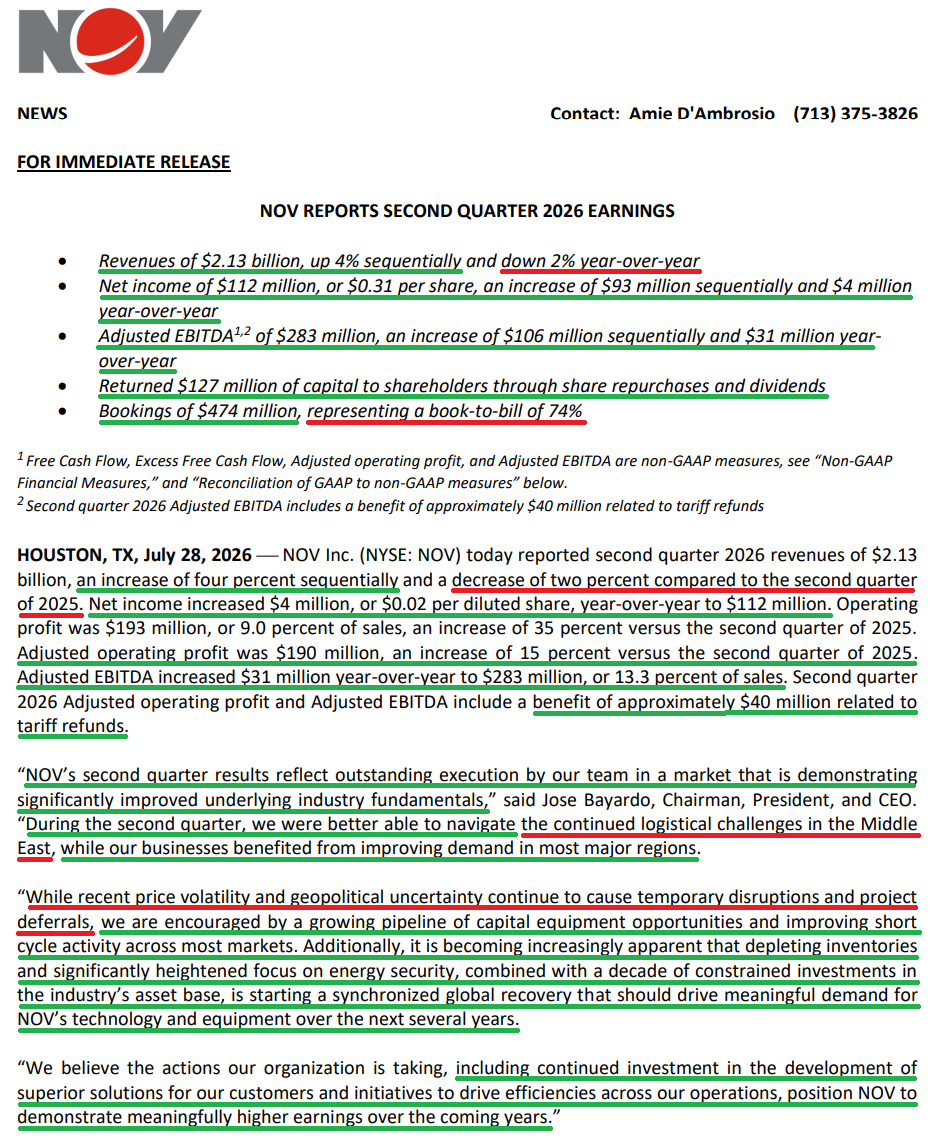
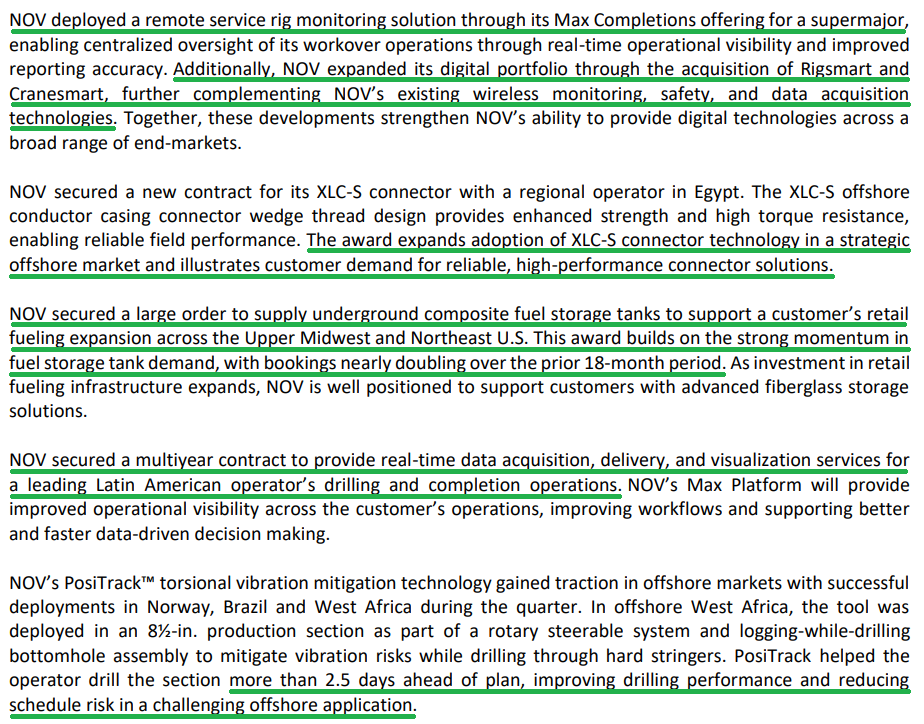
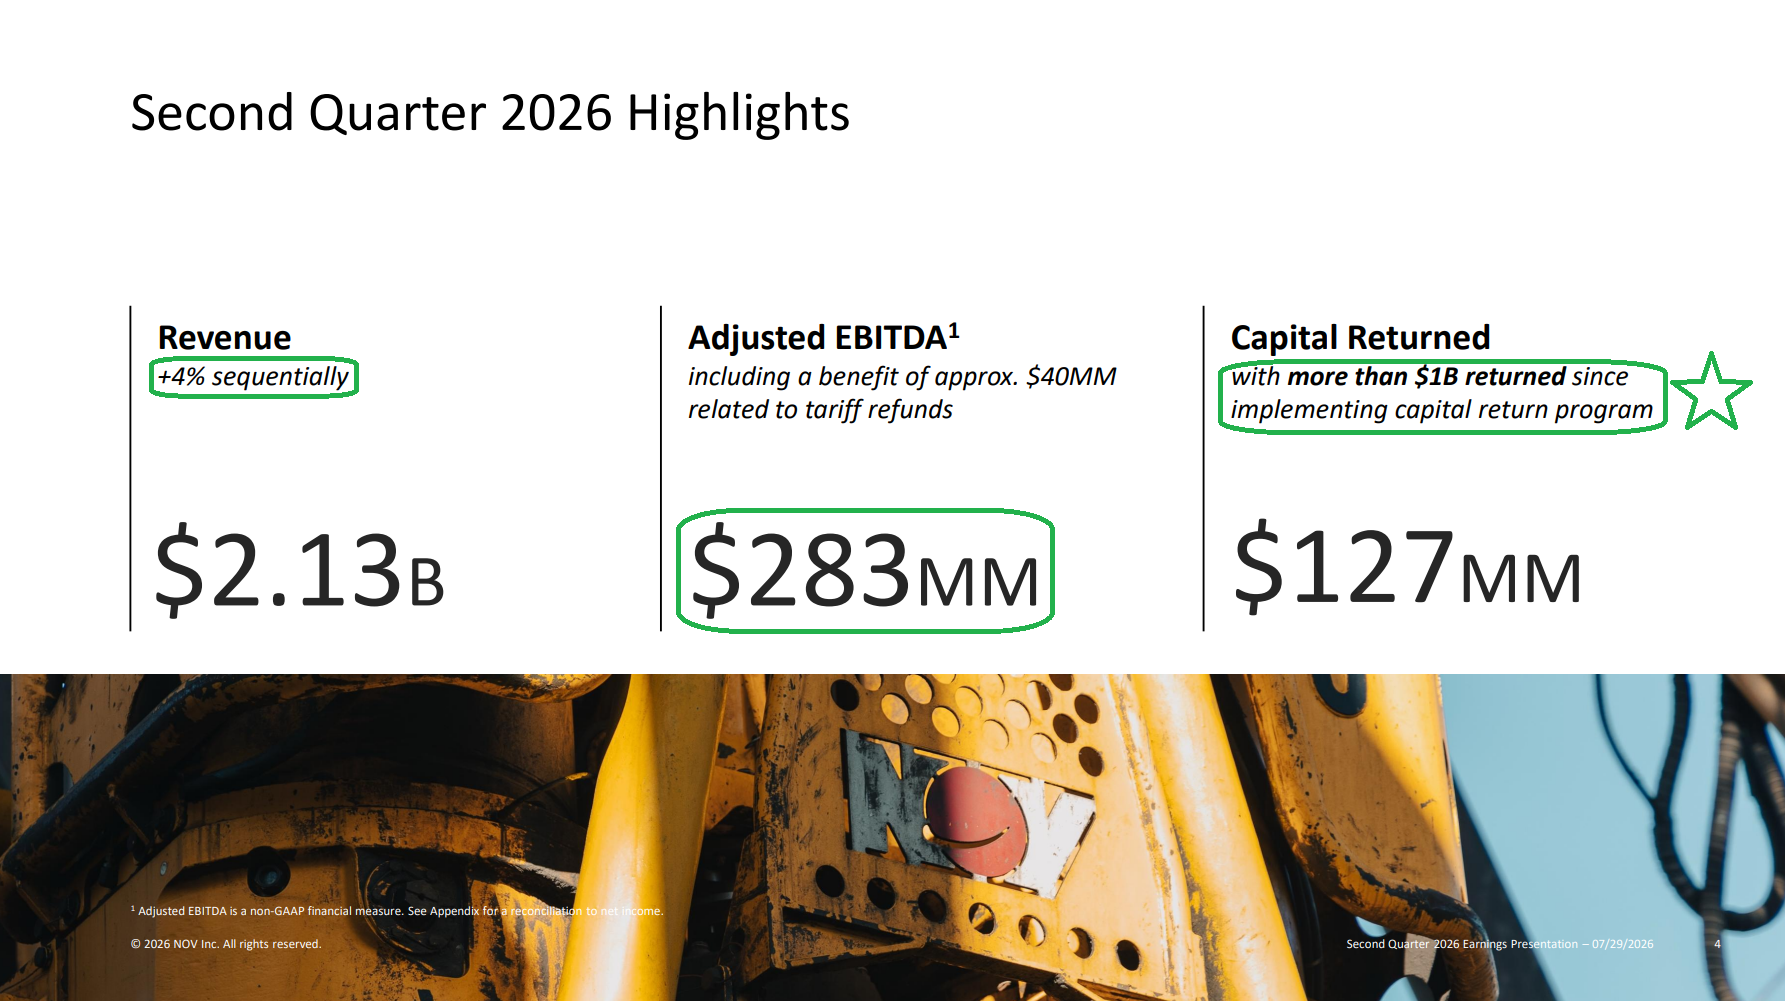
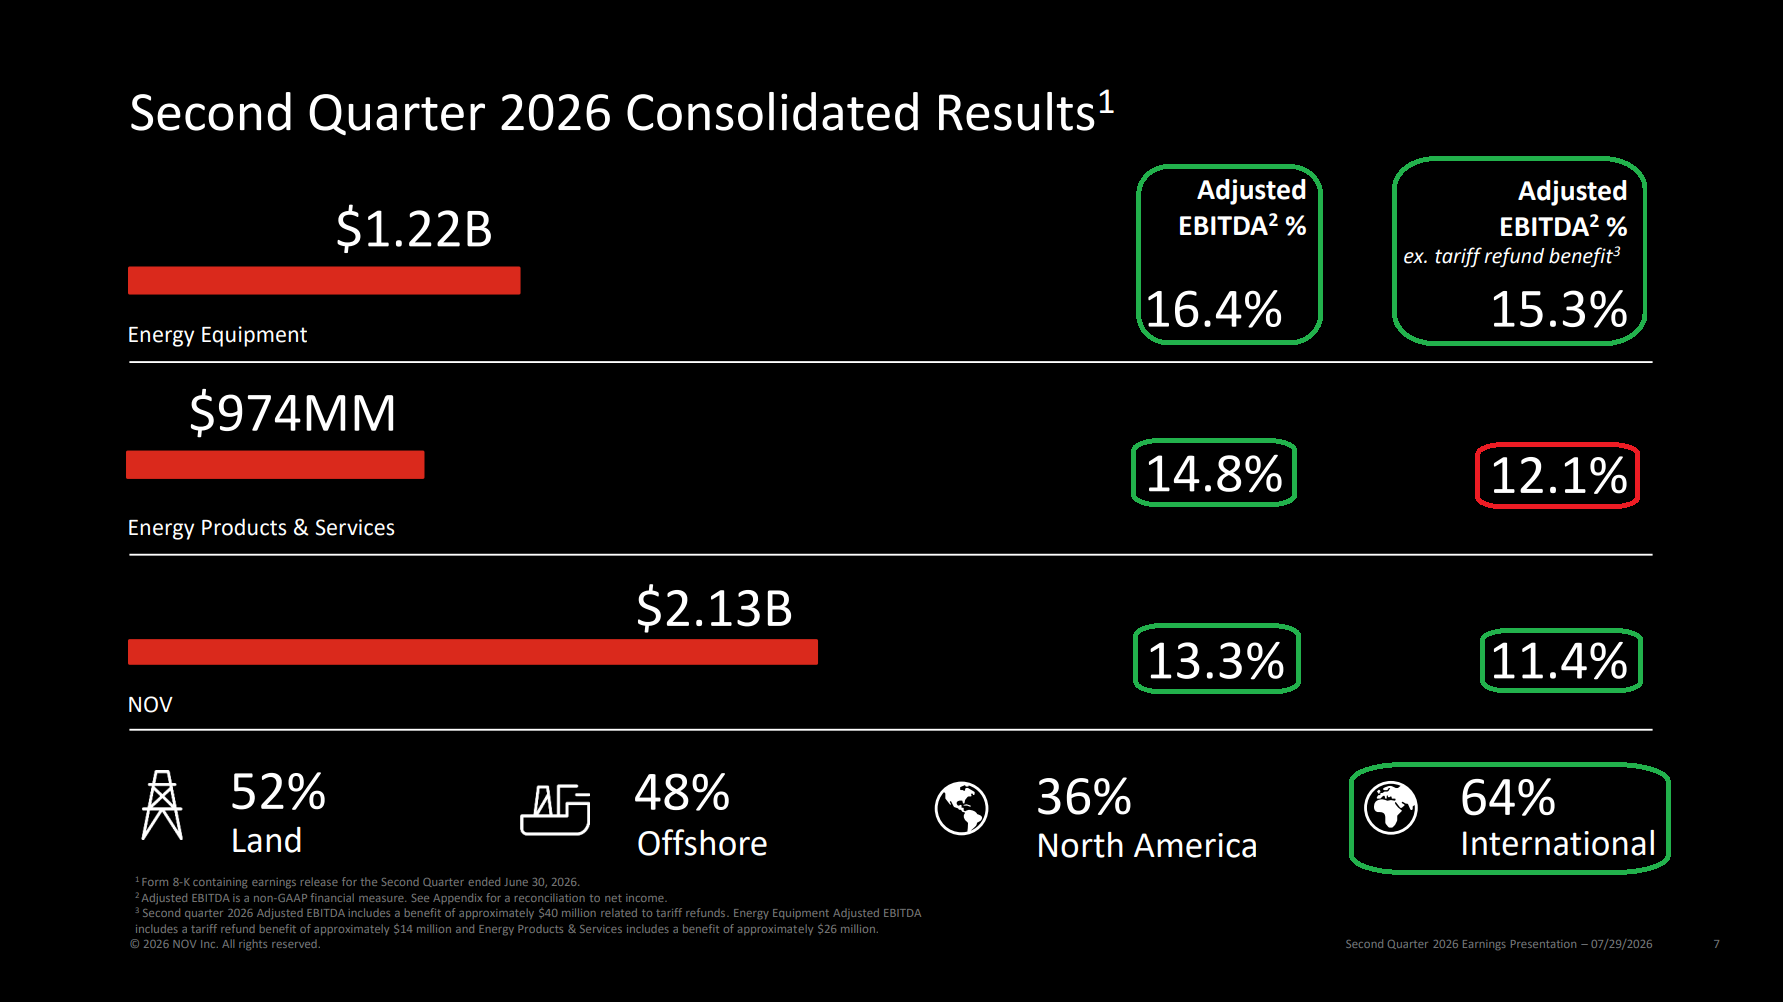
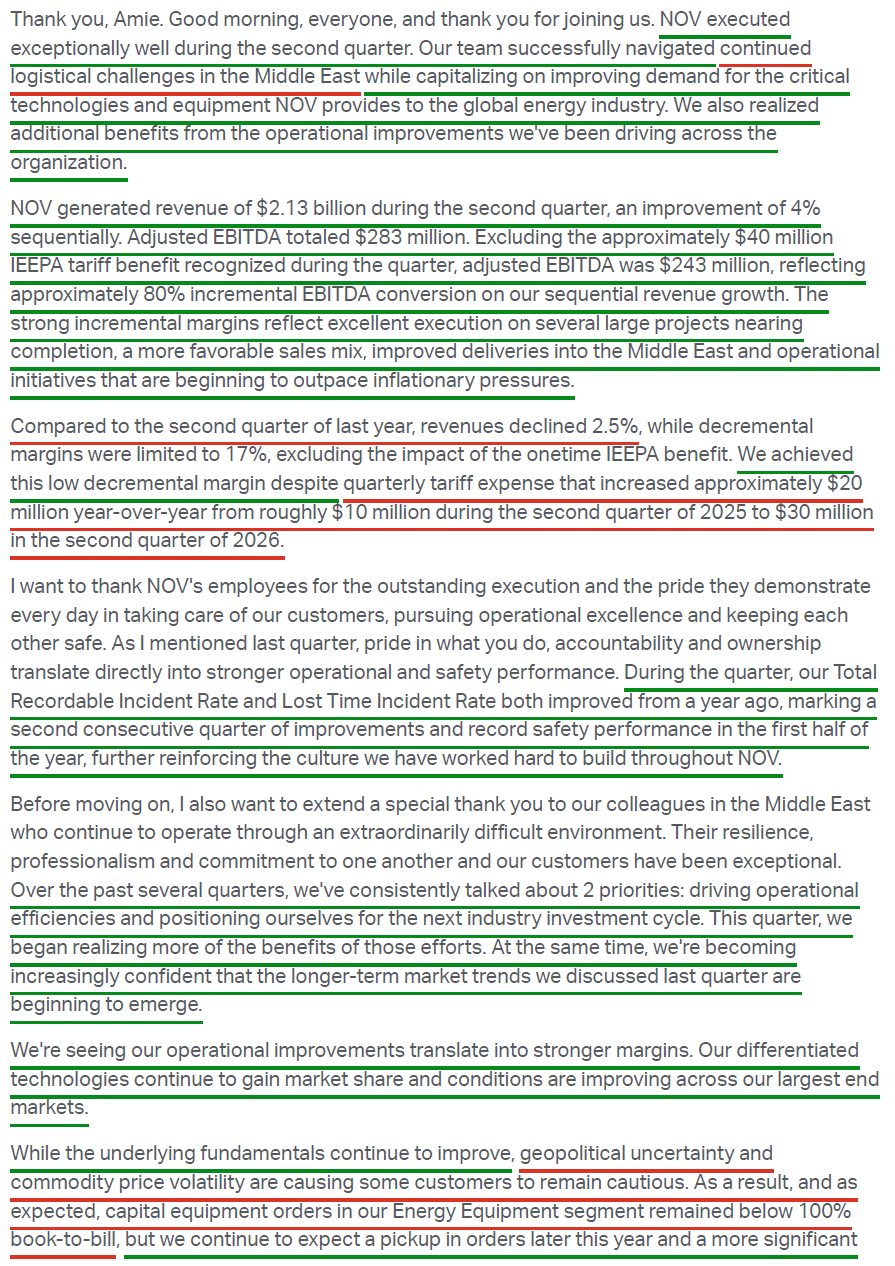
1) NOV reported Q2 revenue of $2.13B (-2% Y/Y and +4% Q/Q), beating consensus by ~$50M. Sequential growth was driven by improved Middle East deliveries as first-quarter delays worked through, a more favorable sales mix, and strong execution on large offshore production projects nearing completion. Revenue mix was 52% land / 48% offshore and 36% North America / 64% international.
2) Adjusted EBITDA of $283M expanded 180 bps Y/Y to 13.3% of sales, improving $31M Y/Y and $106M sequentially, and included a ~$40M IEEPA tariff refund. Excluding the refund, adjusted EBITDA was $243M at an 11.4% margin, still higher Y/Y in dollar terms. Even with tariff expense rising ~$20M Y/Y to ~$30M, NOV converted ~80% of its sequential revenue growth into EBITDA and limited Y/Y decrementals to just 17% on an ex-refund basis, with operational initiatives finally beginning to outpace inflation.
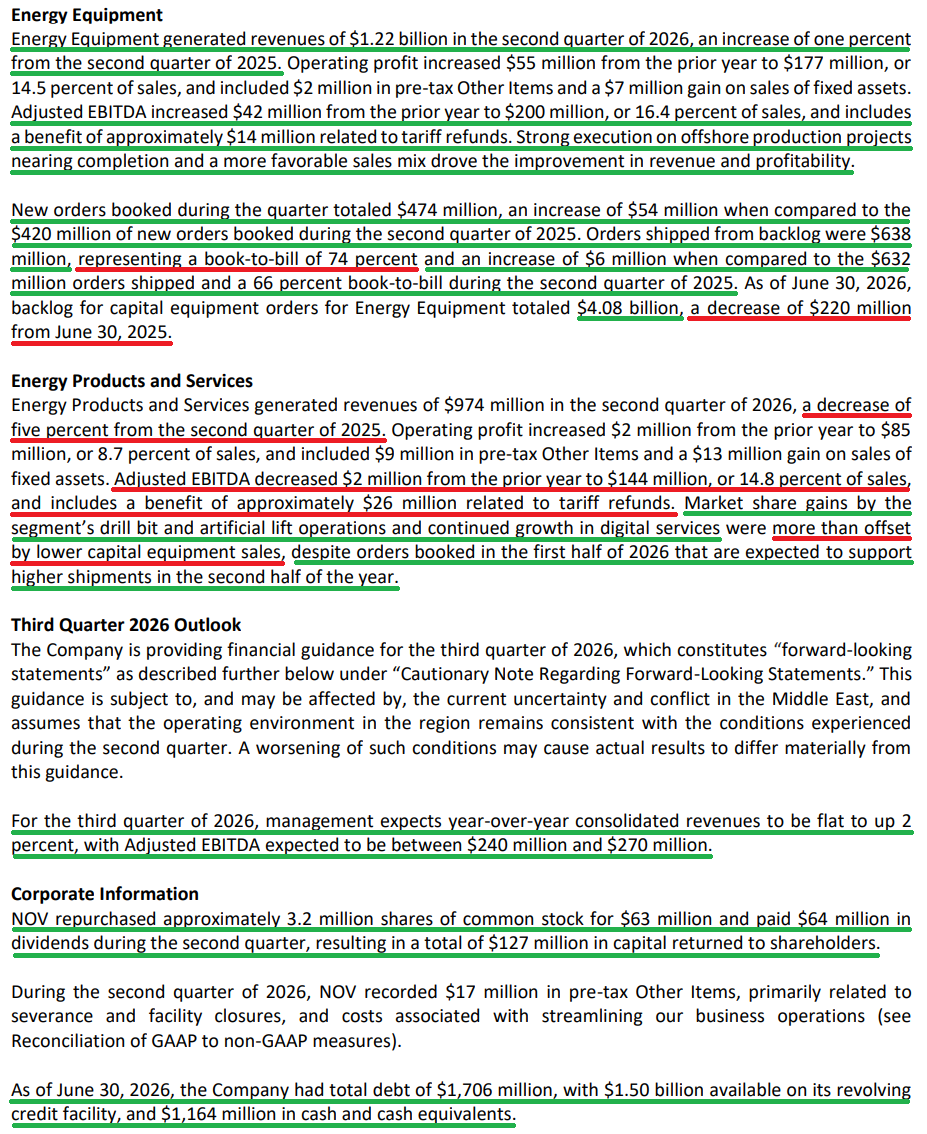
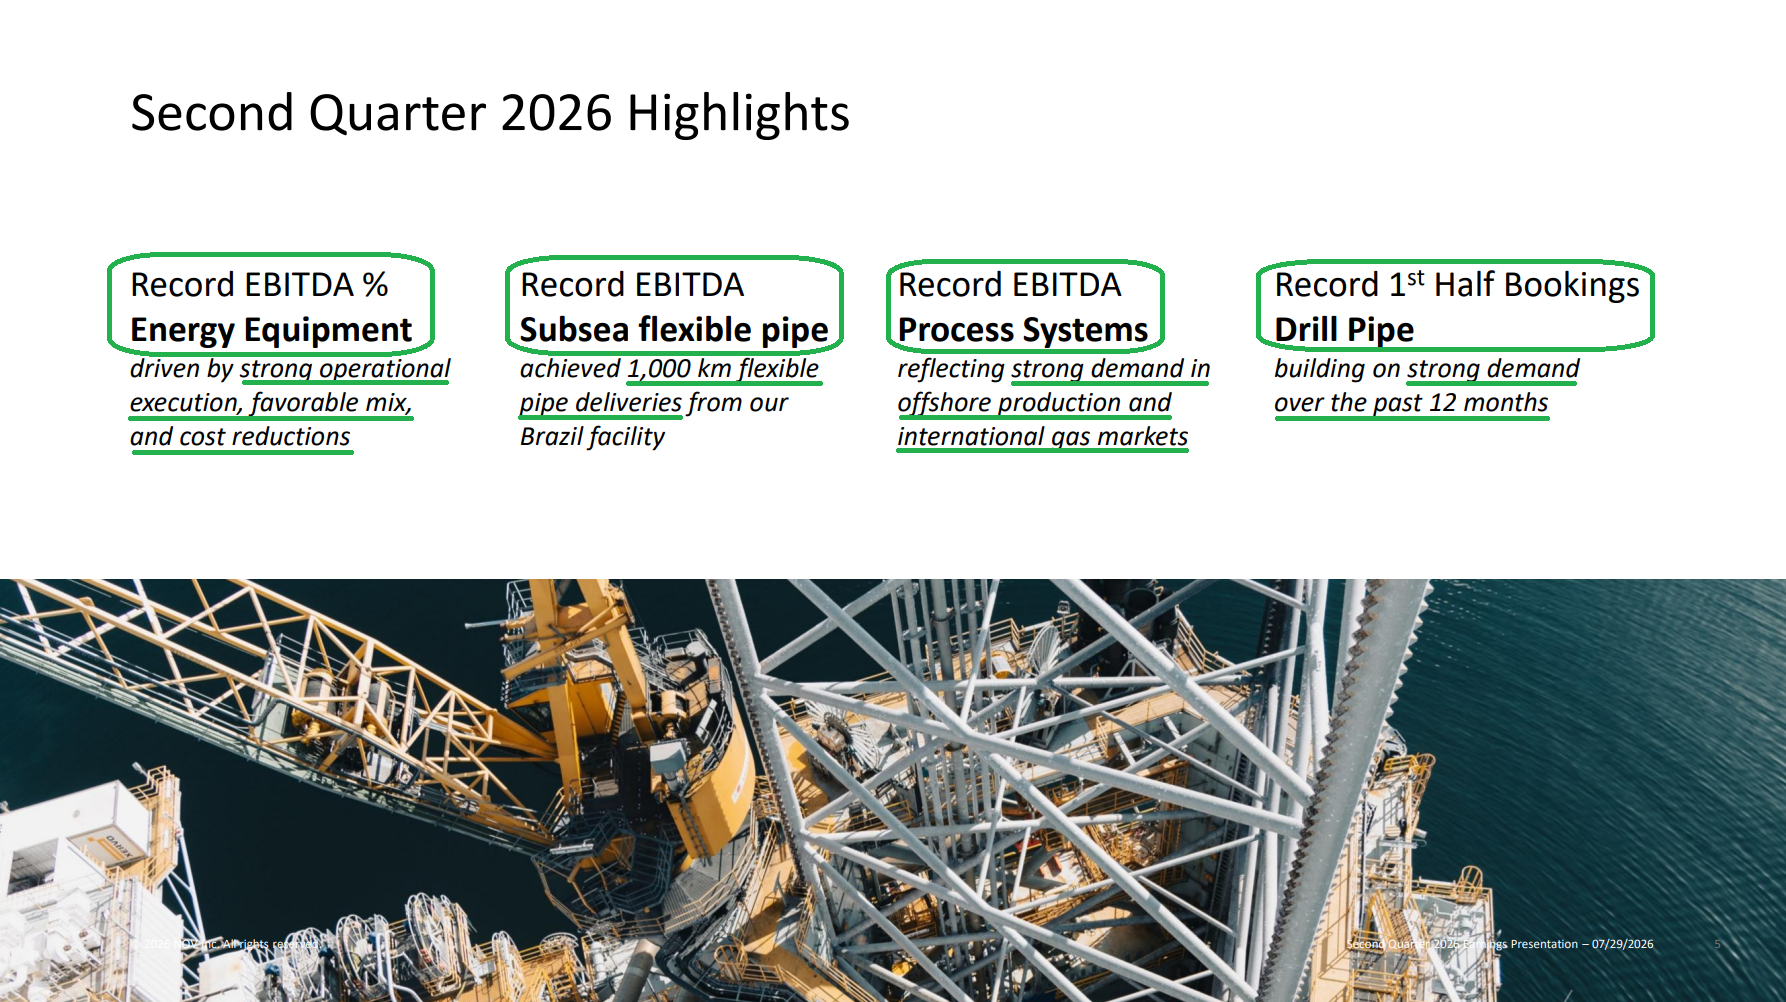
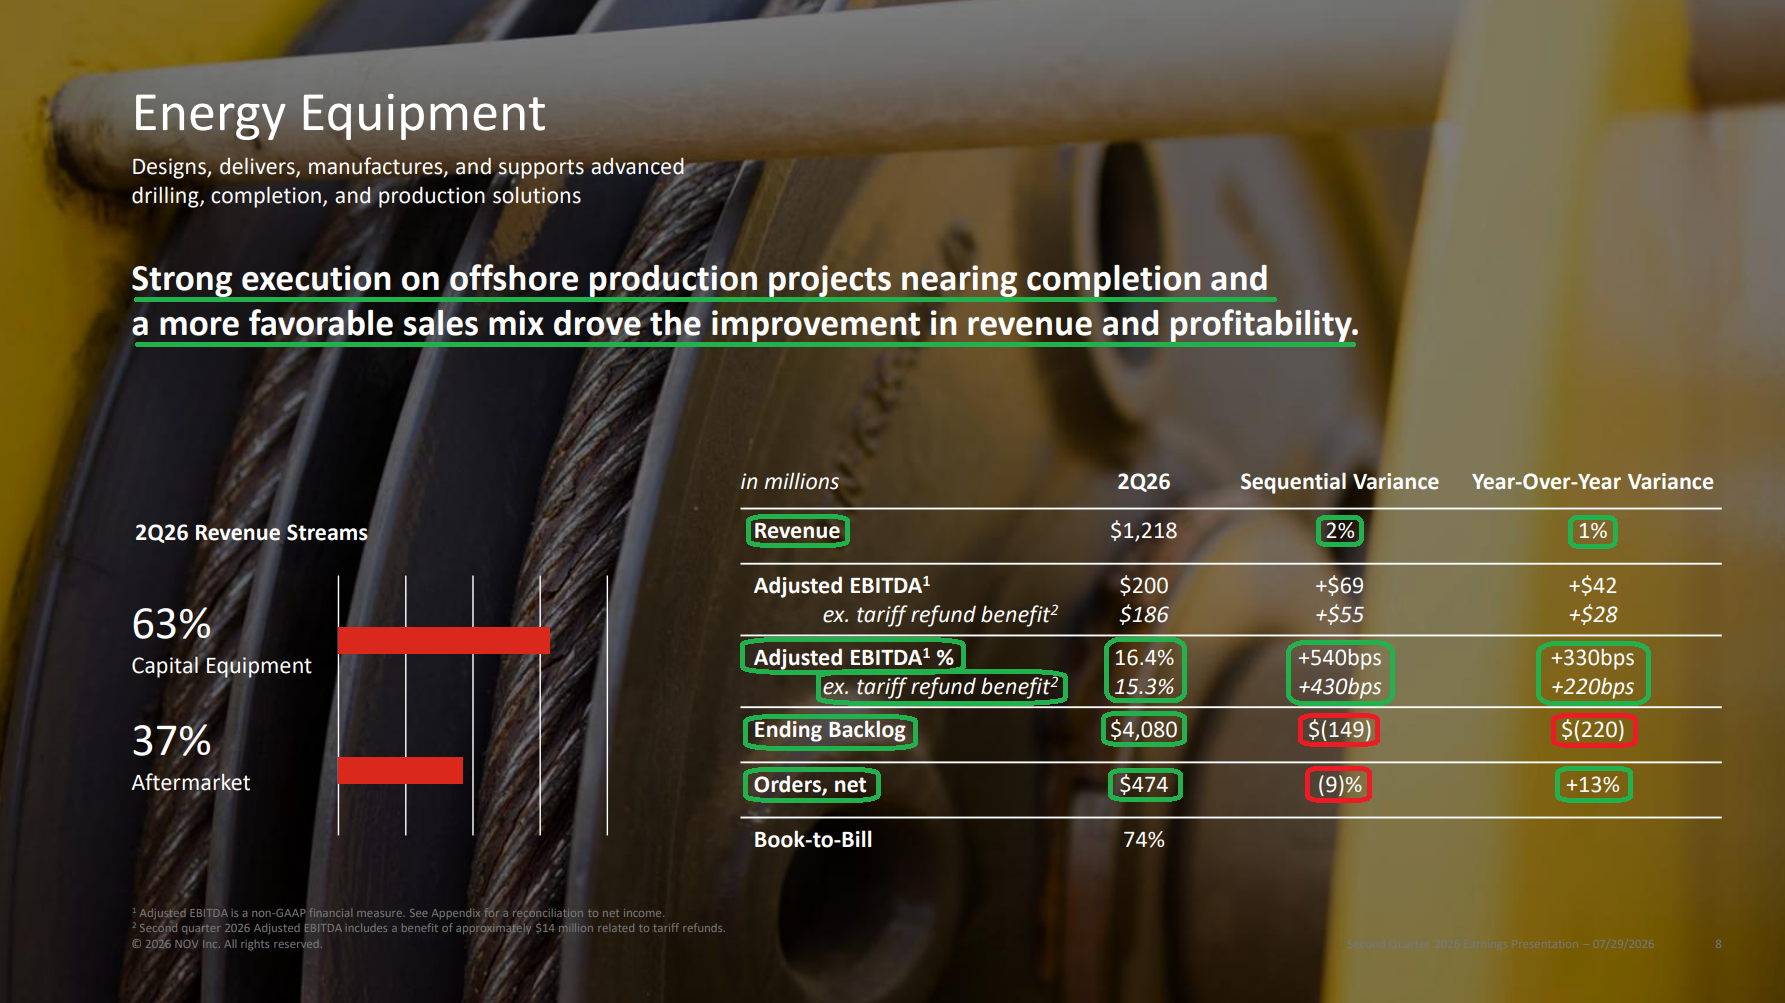
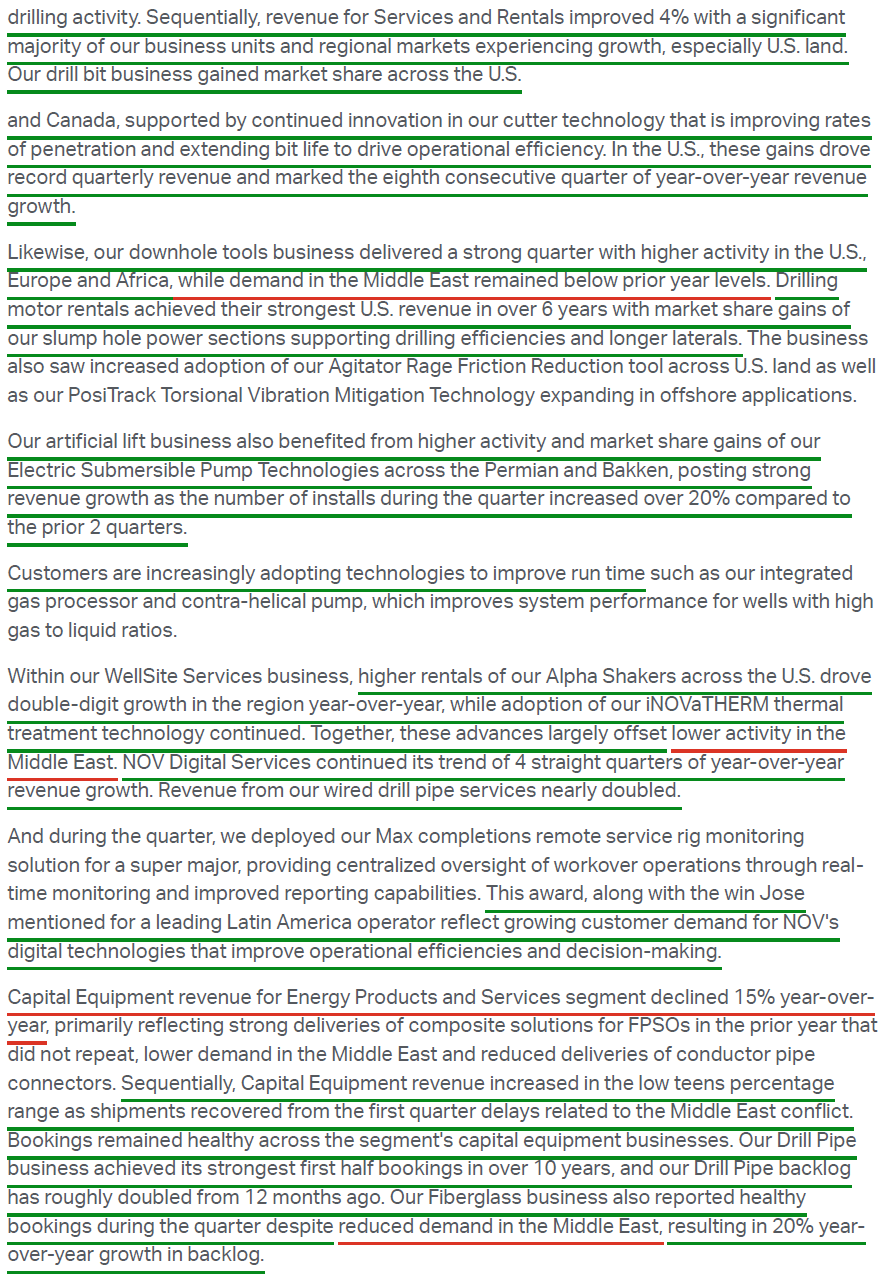
3) Energy Equipment revenue of $1.22B (+1% Y/Y and +2% Q/Q) marked the fifth consecutive quarter of Y/Y growth. Adjusted EBITDA of $200M improved $42M Y/Y, with margins expanding 330 bps to 16.4%, the highest level since the segment was established. Excluding the ~$14M tariff refund, margins of 15.3% still set a record, improving 220 bps Y/Y and 430 bps sequentially on operational execution, favorable pricing and mix, and cost reductions. Capital equipment represented 63% of segment revenue and grew 2% Y/Y, led by offshore production businesses, while aftermarket improved 3% sequentially despite Middle East pressure.
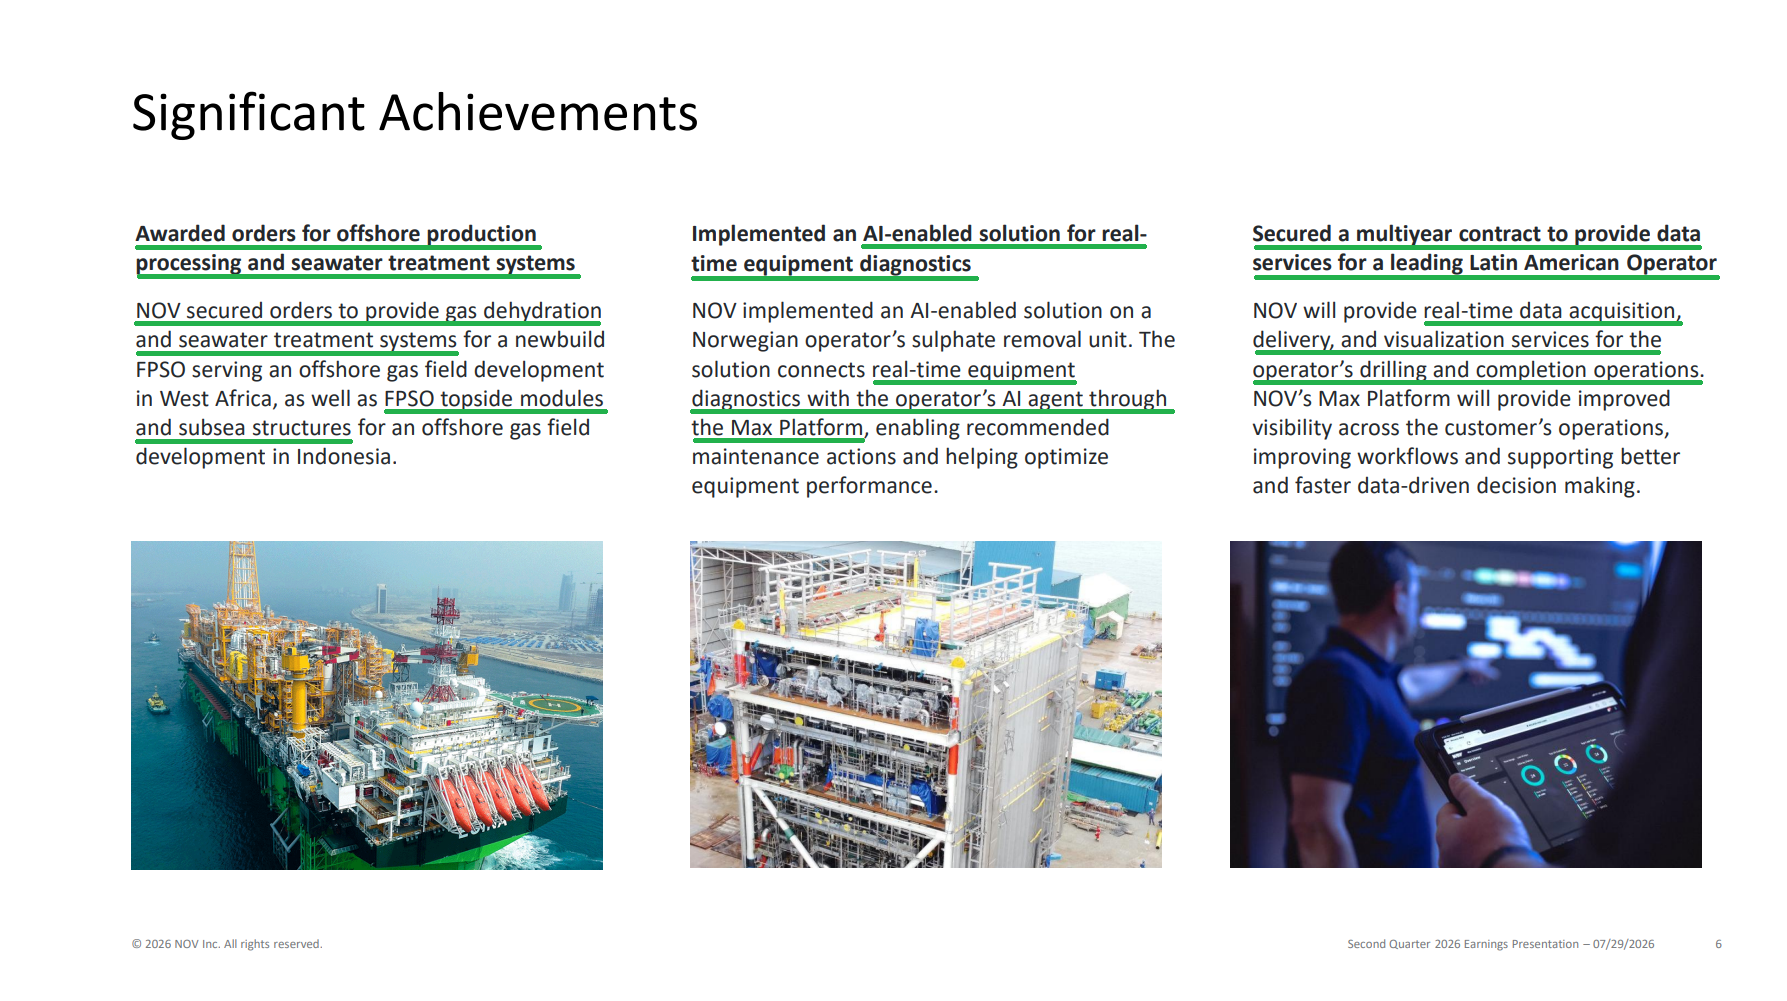
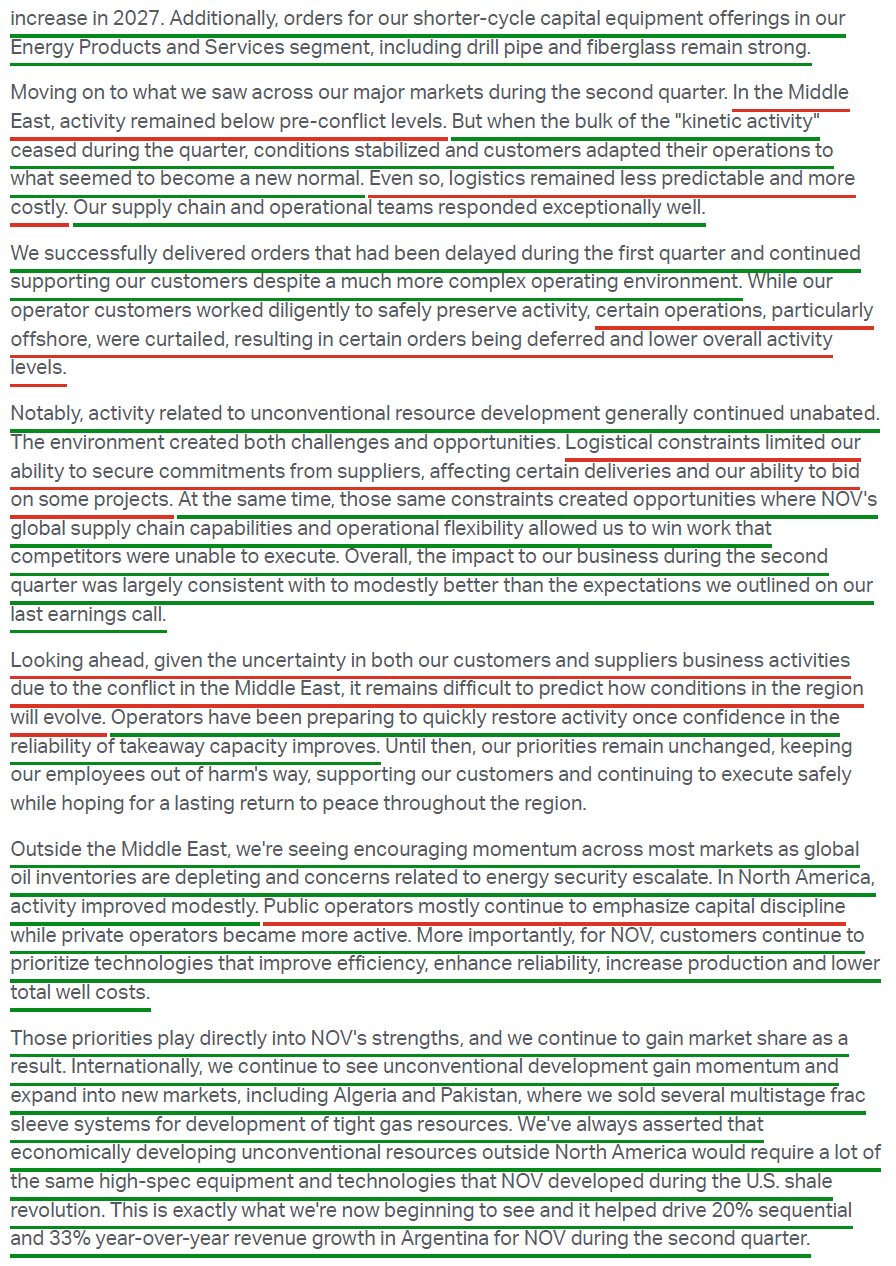
4) New orders in Energy Equipment totaled $474M, up 13% Y/Y, representing a book-to-bill of 74%, with backlog ending at $4.08B (-$220M Y/Y). First-half orders exceeded the prior year by 16% while shipments improved nearly 10%, with management expecting second-half order intake to meaningfully outpace the first half. The subsea flexible pipe business delivered another record EBITDA quarter, with a trailing twelve-month book-to-bill of 135% and backlog 28% higher than a year ago. That business is now running against capacity, with sizable new orders slated for 2028 deliveries and the Brazil expansion coming online in early 2029. Process Systems also posted record EBITDA on offshore production and international gas demand, while drilling capital equipment bookings ran 40% ahead of the prior year in the first half.
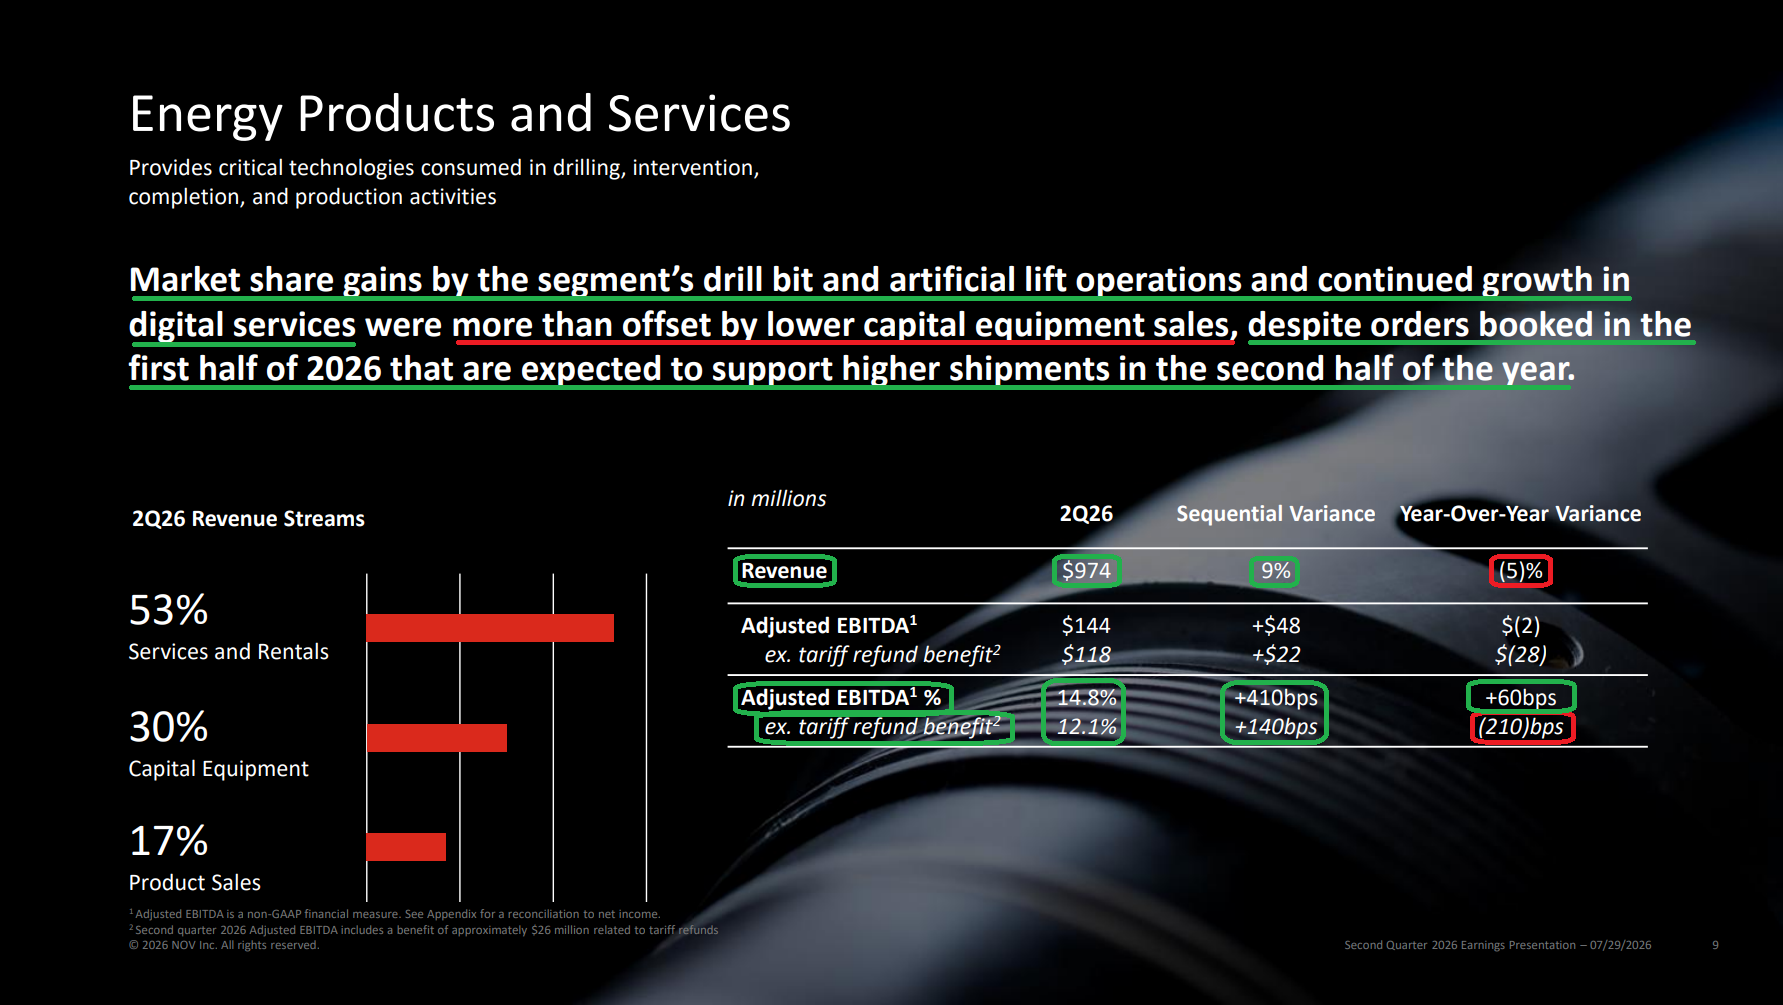
5) Energy Products and Services revenue of $974M declined 5% Y/Y but improved 9% sequentially, with adjusted EBITDA of $144M down $2M Y/Y at a 14.8% margin. Excluding the ~$26M tariff refund, margins of 12.1% contracted 210 bps Y/Y while improving 140 bps sequentially. Services and rentals proved resilient at just -1% Y/Y as market share gains offset lower U.S. and Middle East drilling activity, with the drill bit business setting record U.S. quarterly revenue in its eighth straight quarter of Y/Y growth and artificial lift installs increasing over 20%. Capital equipment declined 15% Y/Y against a difficult comp, though drill pipe posted its strongest first-half bookings in over 10 years with backlog ~doubling Y/Y, positioning the segment for stronger second-half shipments.
6) The Middle East, ~15% of total company revenue, stabilized during the quarter as the bulk of "kinetic activity" ceased and operators adapted to what management described as a new normal, though logistics remained less predictable and more costly. The impact came in line to modestly better than expectations, a clear improvement from the ~$30M EBITDA headwind absorbed in Q1. Land activity held up throughout, particularly in unconventional gas plays, while offshore operations absorbed the bulk of the deferrals. Third-quarter guidance assumes conditions remain consistent with Q2, which implies 10% to 15% sequential growth in regional activity, with management conservatively planning toward the lower end of that range. A renewed disruption would carry a potential $20M to $25M EBITDA impact.
7) The ~$100M+ annualized cost savings program reached an important inflection during the quarter, with savings beginning to outrun the tariff and inflationary headwinds that had masked them for the past year. Management also monetized ~$45M of real estate and buildings as part of ongoing facility rationalization. While no new formal target has been set, management sees continued room to run into the second half and 2027 through simplifying and standardizing business processes and better leveraging scale.
8) Free cash flow was an outflow of $64M during the quarter on operating cash flow of $17M against $81M of capital expenditures, bringing the first half to an outflow of $155M compared with an inflow of $159M in the prior year. The shortfall was driven by the timing of certain billings and elevated inventory as supply chain teams built buffers around the ongoing conflict. Management expects working capital to turn into a source of cash in the second half, consistent with the pattern in both 2024 and 2025, and continues to guide full-year EBITDA-to-FCF conversion of 40% to 50%, with the midpoint implying ~$447M of free cash flow at consensus EBITDA estimates.
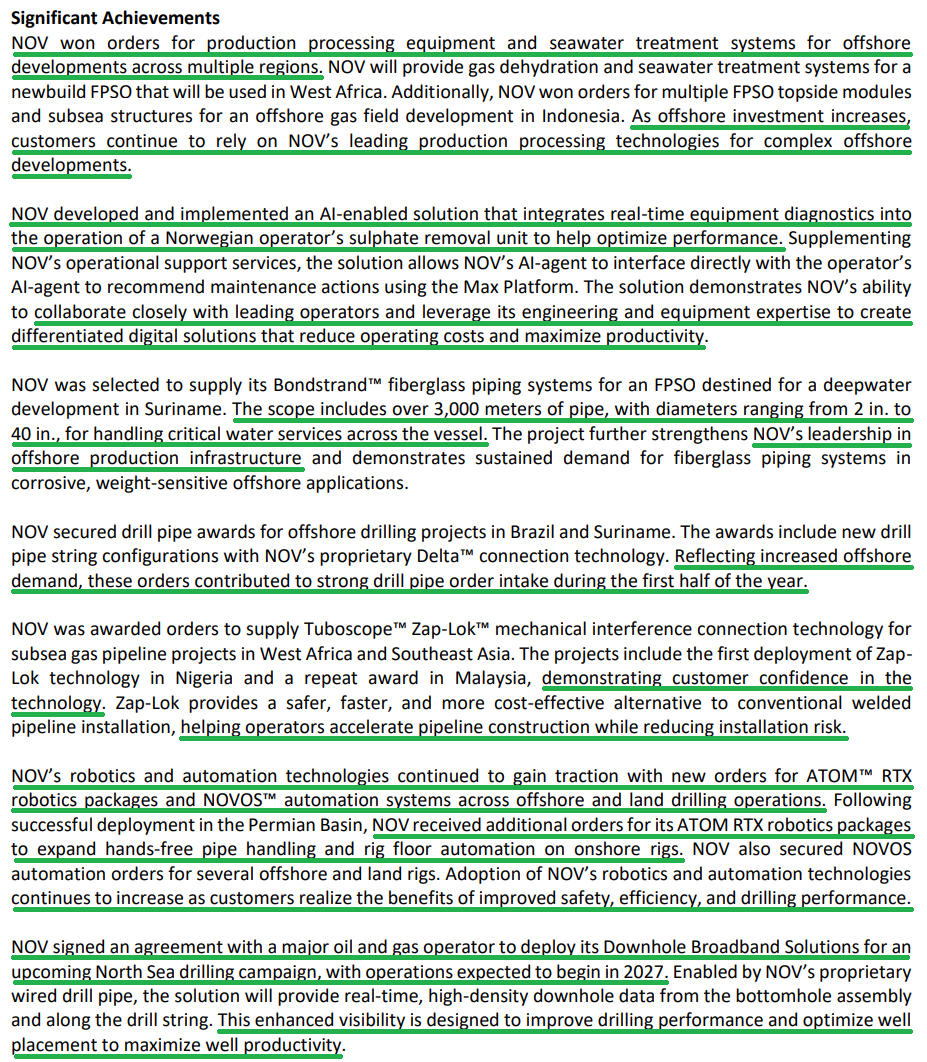
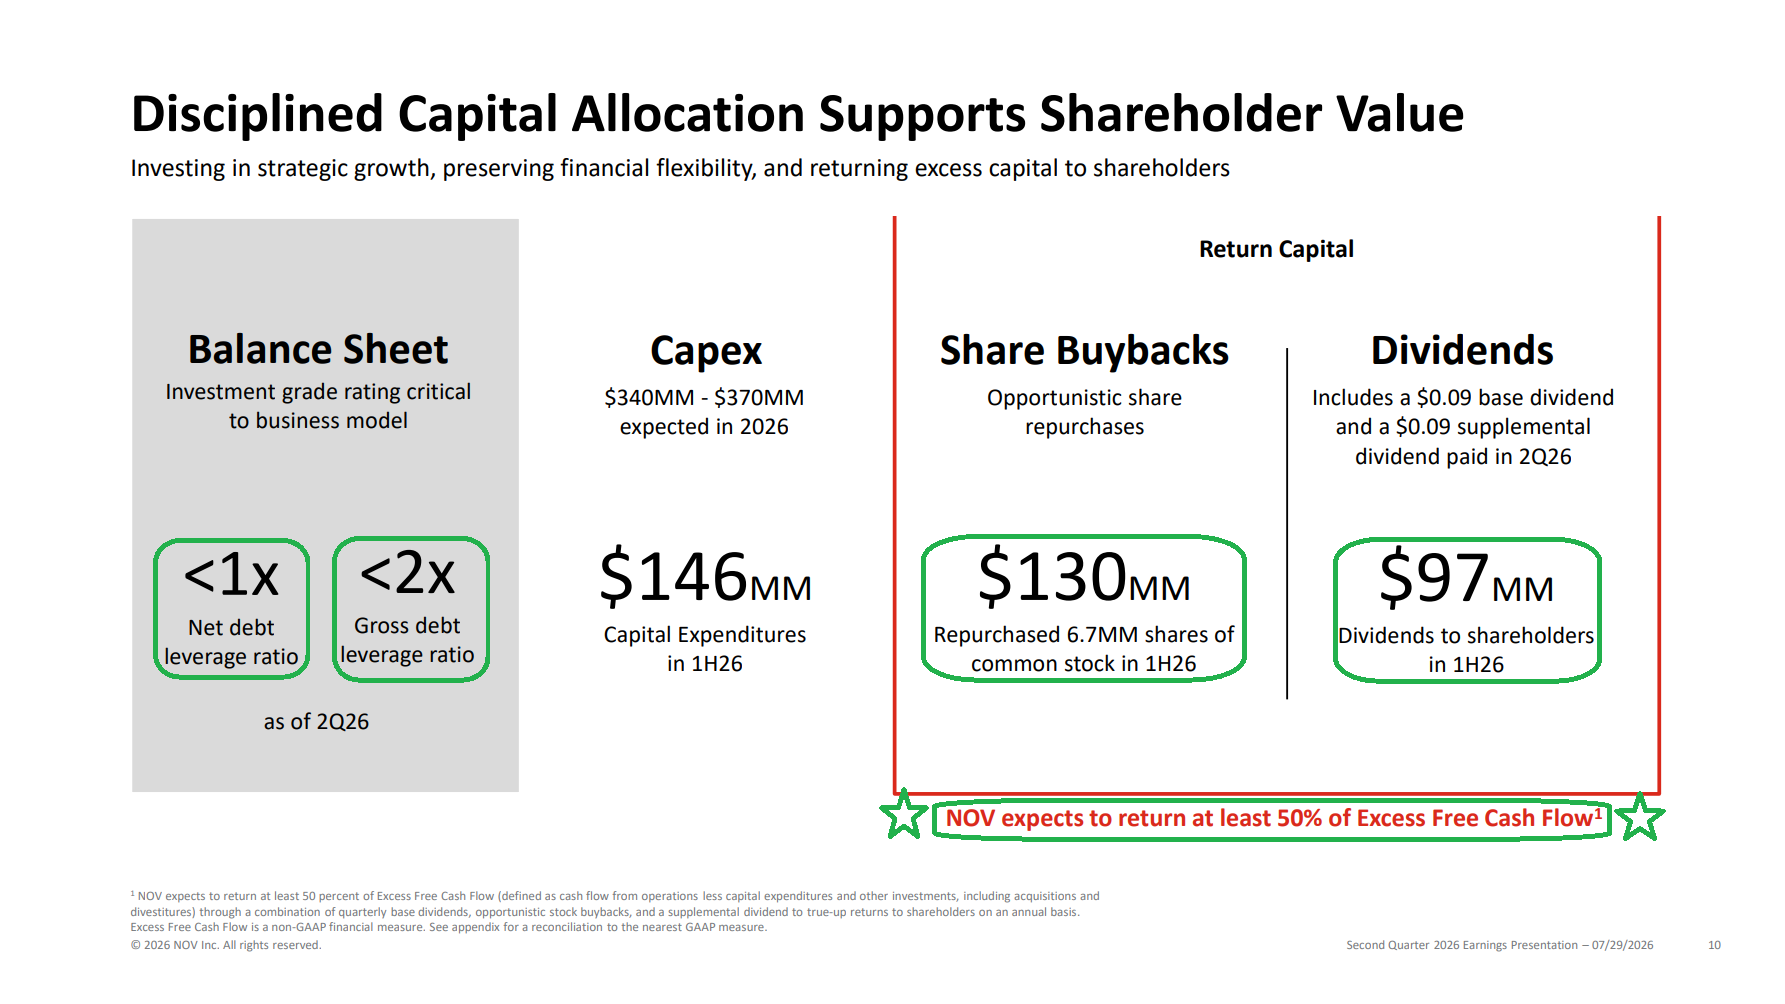
9) NOV returned $127M of capital to shareholders during the quarter through $63M of share repurchases (3.2M shares) and $64M of dividends, the latter including a $0.09 supplemental dividend to true up the 2025 return of capital program, bringing first-half returns to $227M. Since implementing the program in Q2 2024, NOV has returned over $1B to shareholders while growing its cash balance by ~$700M, with the commitment to return at least 50% of excess free cash flow unchanged. The balance sheet remains rock solid, with total debt of $1.71B against $1.16B of cash, putting net debt at ~$542M, or ~0.5x net leverage and ~1.7x gross on TTM EBITDA, alongside $1.50B available on the revolving credit facility.
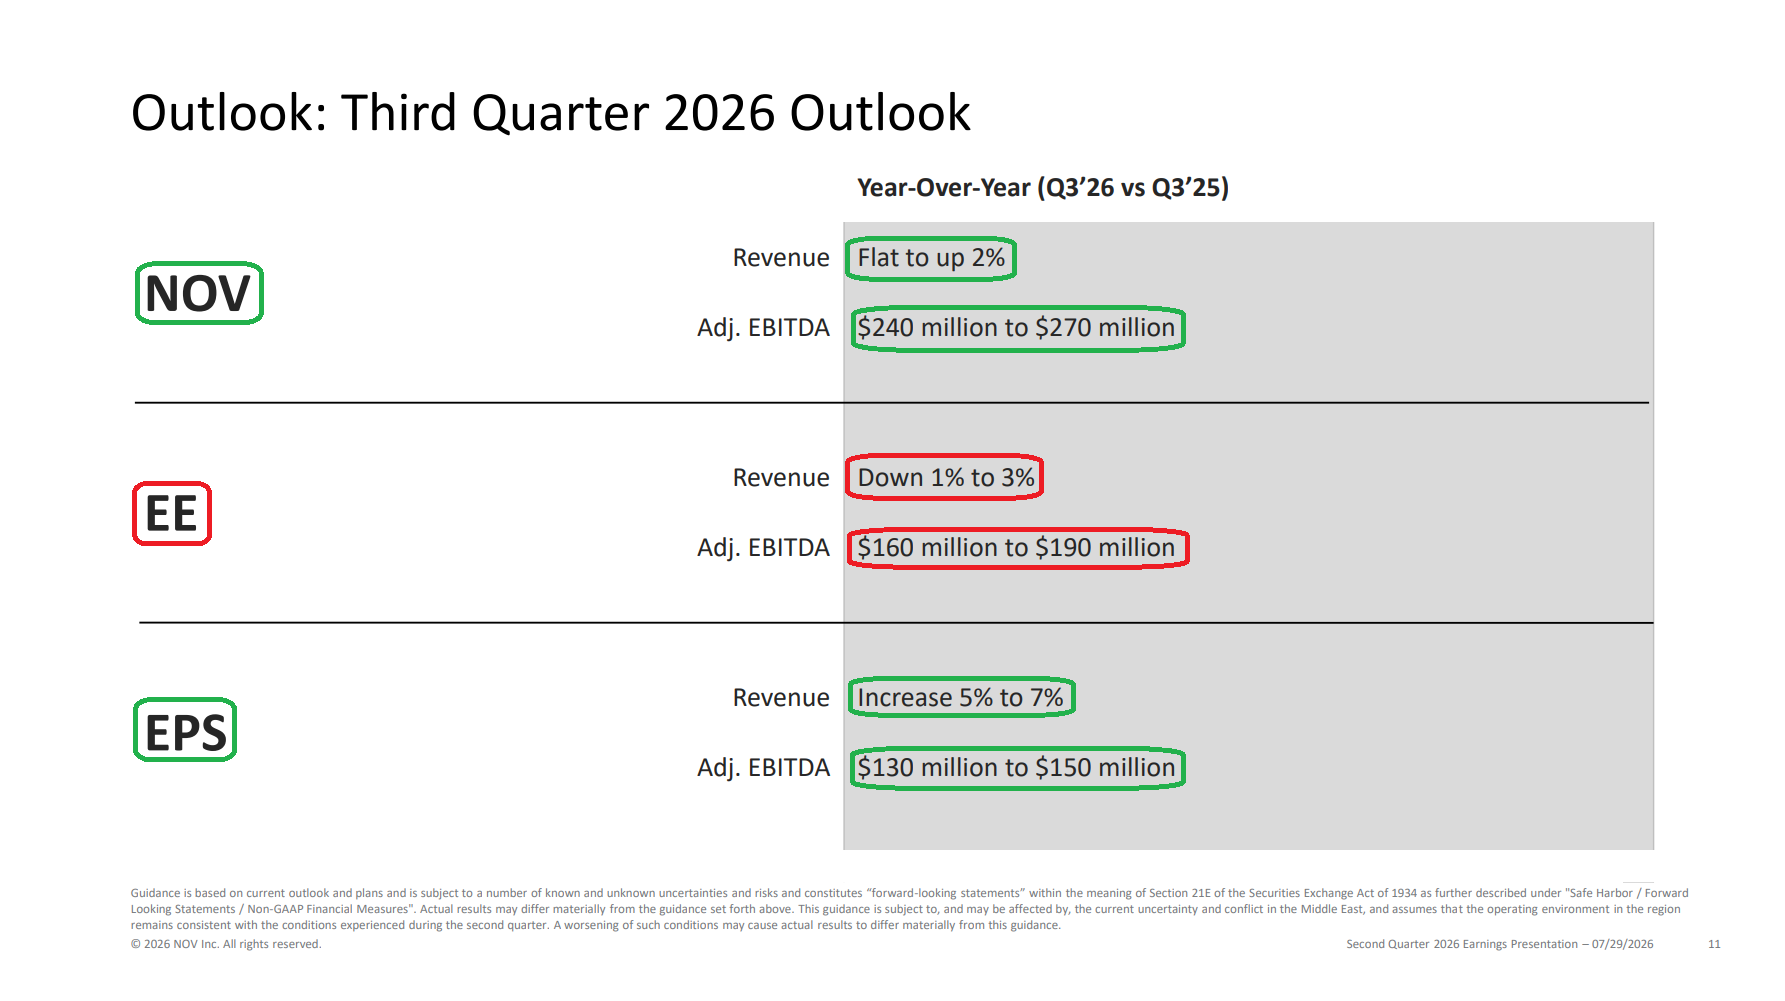
10) For Q3, management expects consolidated revenue flat to up 2% Y/Y, with adjusted EBITDA of $240M to $270M against $258M in the prior year, with no tariff refund assumed. Energy Equipment revenue is guided down 1% to 3% Y/Y with EBITDA of $160M to $190M as production projects roll off, while Energy Products and Services revenue is guided up 5% to 7% Y/Y with EBITDA of $130M to $150M on backlog conversion. Full-year book-to-bill remains expected in the 90% to 100% vicinity, moving materially higher in 2027. More importantly, management laid out a "high watermark" analysis to frame normalized earnings power, combining each business unit's best recent quarter while conservatively excluding seasonally strong fourth quarters, which annualizes to ~$9.8B of revenue and ~$1.5B of EBITDA at a 15.3% margin versus 11.8% in FY25. Those peaks were set during a stretch of declining activity, inflation, and tariffs, and predate the structural work completed since, with management targeting mid-teens EBITDA margins and higher returns on capital employed as the cycle broadens over the coming years.
Earnings Call Highlights
Morningstar (MORN) Analyst Note
General Market
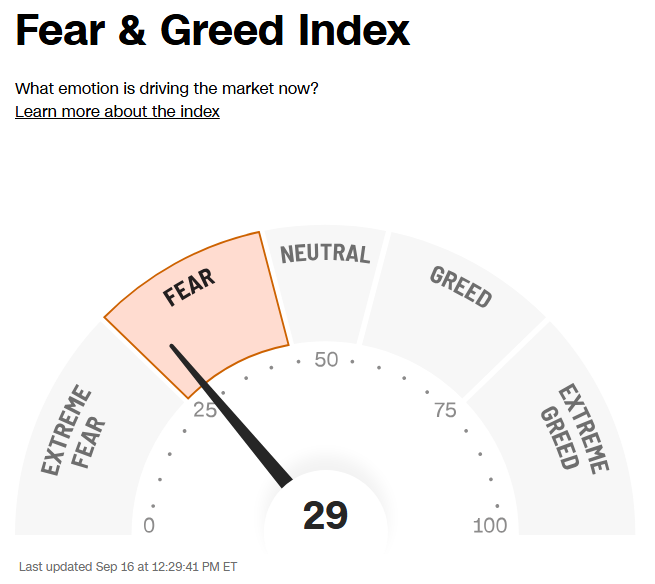
The CNN “Fear and Greed Index” ticked down to 29 this week from 42 last week. You can learn how this indicator is calculated and how it works here: (Video Explanation)
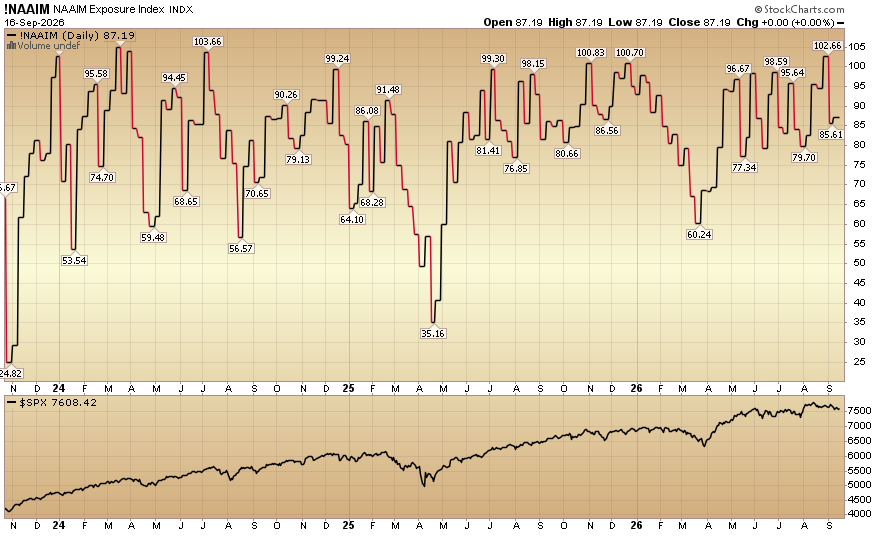
The NAAIM (National Association of Active Investment Managers Index) (Video Explanation) ticked up to 87.19% equity exposure this week from 85.61% last week.

Comments
Log in or sign up to join the conversation.