

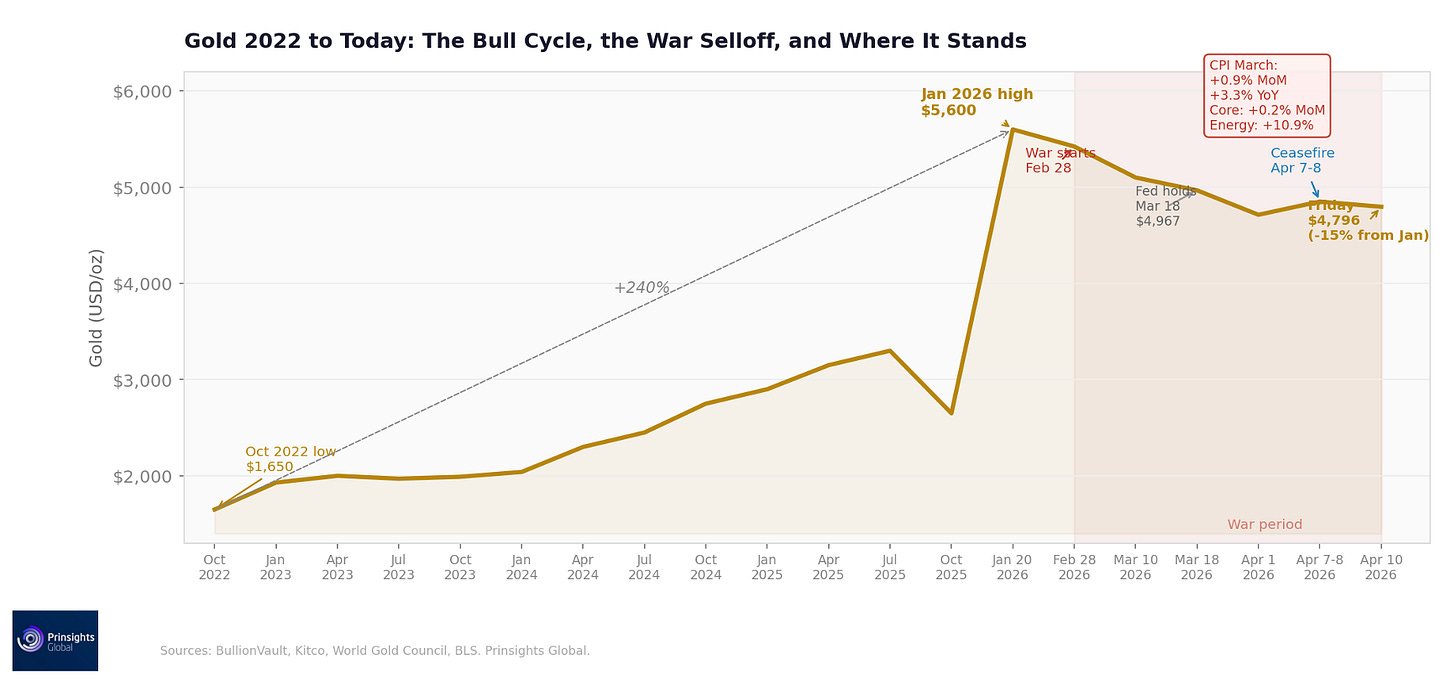
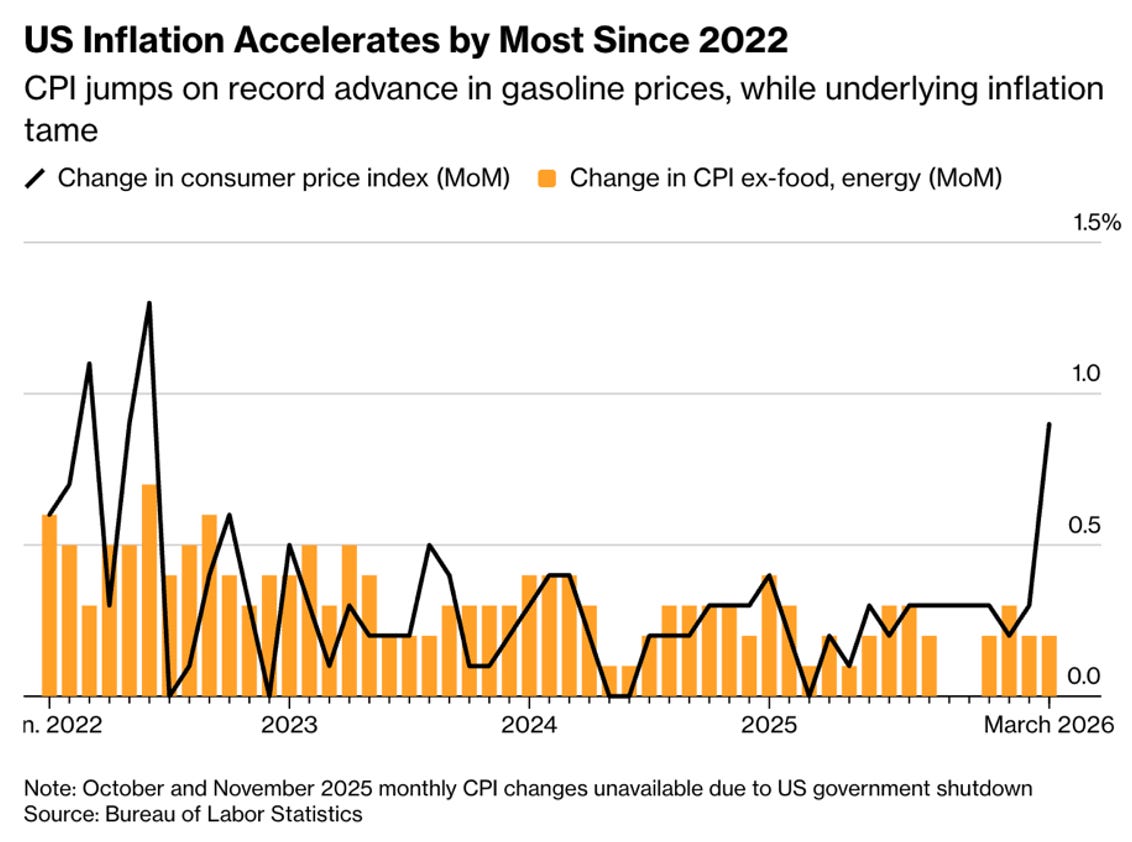
Friday’s March CPI release showed headline inflation rising 0.9% in a single month, the largest monthly jump since June 2022, pushing the annual rate from 2.4% in February to 3.3%. The gasoline index rose 21.2%, its largest monthly increase on record, and accounted for nearly three quarters of the total monthly increase.
Core inflation, which strips out food and energy, rose 0.2% for the month and 2.6% year-over-year. The monthly core rate was identical to February.
In a month where gasoline rose 21%, the underlying price structure of the U.S. economy moved by the same amount it moved the month before the war. That is the most important number in the March report, and it is the one most of the media coverage flashing in the wake of the report missed.
The War Hit Oil Prices, It Didn’t Hit the Whole Economy
When we strip out gasoline, the March CPI tells a very different story. Shelter, which has been the most persistent driver of core inflation over the past two years, is decelerating. Owners’ equivalent rent rose 3.1% year-over-year in March, down from 3.2% in February. Rent of primary residence came in at 2.6%, down from 2.7%.
Meanwhile, supercore, which is core services excluding shelter as well as the measure the Fed watches most closely for demand-driven inflation, rose 0.3% for the month, lower than February’s 0.4%. Medical care, personal care, and used cars all fell.
The inflation the war created is sitting almost entirely in energy. So far, it has not bled into services nor fed into shelter. It has also not shown up in wages spilling into prices.
The channels that turned the 2021-2022 energy shock into a broad inflation problem have not been triggered. That is because this is not a demand shock. Instead, it is a supply disruption from a six-week conflict that now has a loose ceasefire in place.
When looking to WTI, which is a measure that’s often compared with Brent crude and has its pricing influenced by global supply, the benchmark fell more than 16% in a single session when the ceasefire was announced on April 8. It was trading at around $97 on Friday, down from its extreme $118 war peak.
The gasoline prices that drove the March print are already coming down. The reality is that move will not show up in CPI data until May. The April report will capture prices after the ceasefire. March is the peak of the war’s impact on inflation data (so far), but the peak is entirely in one item.
What You Should Know
The Fed knows the difference between a war-driven energy spike and a structural inflation problem. And Fed Chair Powell said it directly on March 18: nobody knows what the full economic effects will be. The FOMC left the median rate projection unchanged at 3.4% even as it revised inflation forecasts higher.
As Chair Powell noted in March, “You can have a series of these supply shocks and that can lead the public generally – businesses, price setters, households – to start expecting higher inflation over time. Why wouldn’t they?”
That is a central bank holding and waiting, not seeking to tighten. Meanwhile, core CPI sits at 2.6% with a decelerating trajectory – giving the central bank policymakers room to keep waiting.
Why Gold Sold Off and What the Data Changes
Gold peaked at $5,600 in January. When the war started on Feb. 28, it was at $5,423. As of Friday, it was at $4,787, around 15% below its January high. And while gold sold off during a war, a move that is seemingly counterintuitive on the surface, it really isn’t after working through the mechanism.
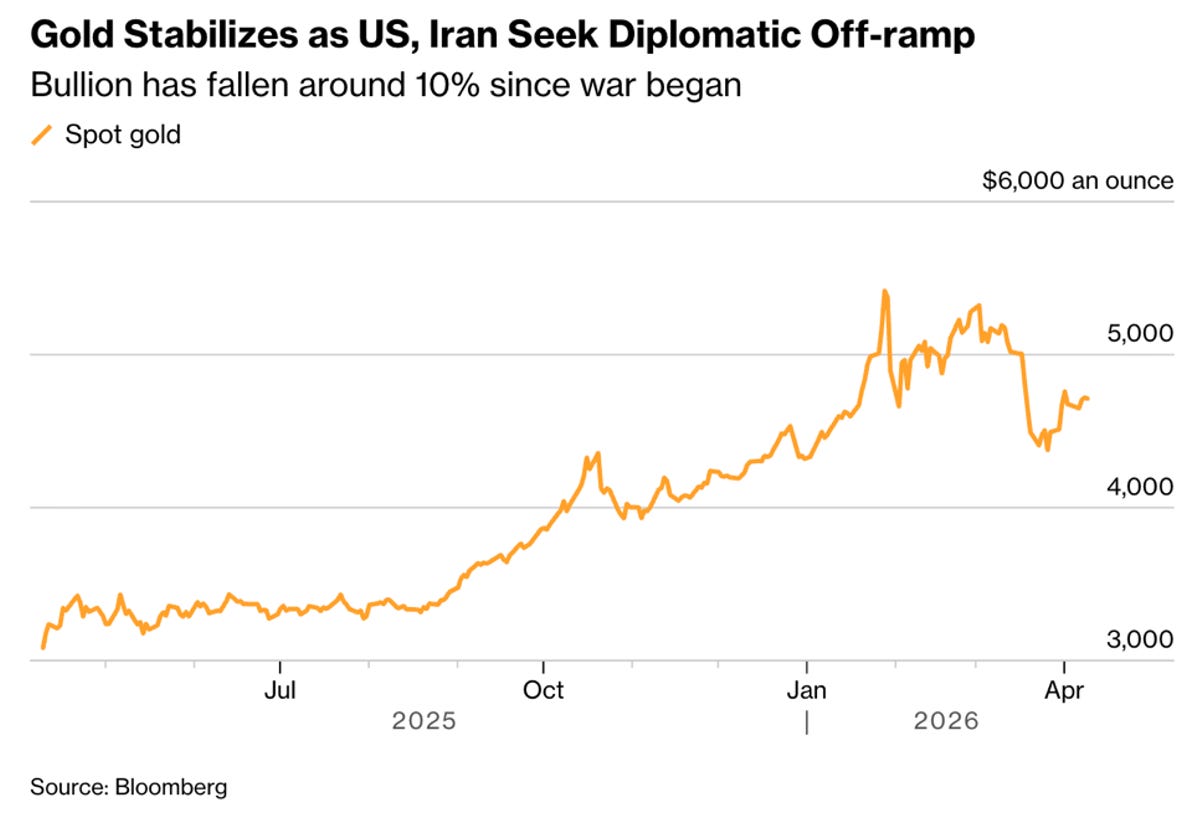
The oil shock pushed inflation expectations higher, which delayed rate cut expectations, which strengthened the dollar. All of that saw gold sell off as a result. The market was pricing in an energy shock that would spread more vigorously into everything else. The data says it did not.
Core CPI moved 10 basis points year-over-year from February to March. The monthly core rate was unchanged. The shelter disinflation that was underway before the war started is now continuing. The transmission from oil to broad prices that the market was already pricing in has not materialized in the six weeks that brought the worst energy shock since the 1970s.
All of these items, when put together, are significant factors given that gold has not yet fully been priced in.
The structural buying that has driven gold through this entire cycle did not pause during the war. Central banks, which have been net buyers for three consecutive years, only continued accumulating. The de-dollarization flows running through this bull cycle have not been reversed by the six-week conflict (so far). The Fed’s balance sheet expansion, restarted in December at $40 billion a month in Treasury purchases, is still in place.
All of the forces that drove gold from $1,650 in late 2022 to $5,600 in January are still in place. The price is not reflecting them because a shorter-term macro dynamic has dominated the narrative for the last six weeks.
What Comes Next for Gold and Gold Miners
Based on our analysis, the March CPI is the war peak in the inflation data. What we expect is that the April CPI report will reflect oil at roughly $96 a barrel, not the $117 level it hit at the war’s peak. Based on what happens after the ceasefire heads news and, if prices continue to reverse, the inflation fears that pushed rate cut timing out will start coming back in. That could even reverse the conditions that drove gold lower.
In our March 20 analysis, we outlined four historical parallels going back to 1973, each time an oil shock initially suppressed gold before a sustained recovery that far exceeded the selloff. The pattern was consistent across 1973, 1979, 2020, and 2022. The energy shock created the initial selloff and the gold price correction was weeks to months. What history shows is that the recovery lasted years and had far exceeded what was lost in the selloff.
Our 2026 gold target remains the $6,000 mark. The March CPI, when read correctly, is not a threat to that target. As we’ve detailed, it is a confirmation of why the current price is where it is and why that gap is temporary.

Comments
Log in or sign up to join the conversation.