


When markets navigate the type of volatility in the geopolitical space that we have seen so far in July, price action alone rarely tells the entire story.
Behind every major movement we can find a set of structural, policy-driven trends. We’ve seen this unfold largely in real-time in areas ranging from trade tariffs and central bank liquidity moves to sovereign debt pressures.
All of this combine can quietly dictate when, where and how investment capital flows. That is why we continue to step back from the headlines and examine the bigger picture through visual data.
Below, we examine five critical charts shaping today’s markets. These charts with analysis detail what the key signals emerging around the world mean for strategic investors right now.
5 Macro Charts to Watch Now
I. New Round of Tariffs Span the Globe
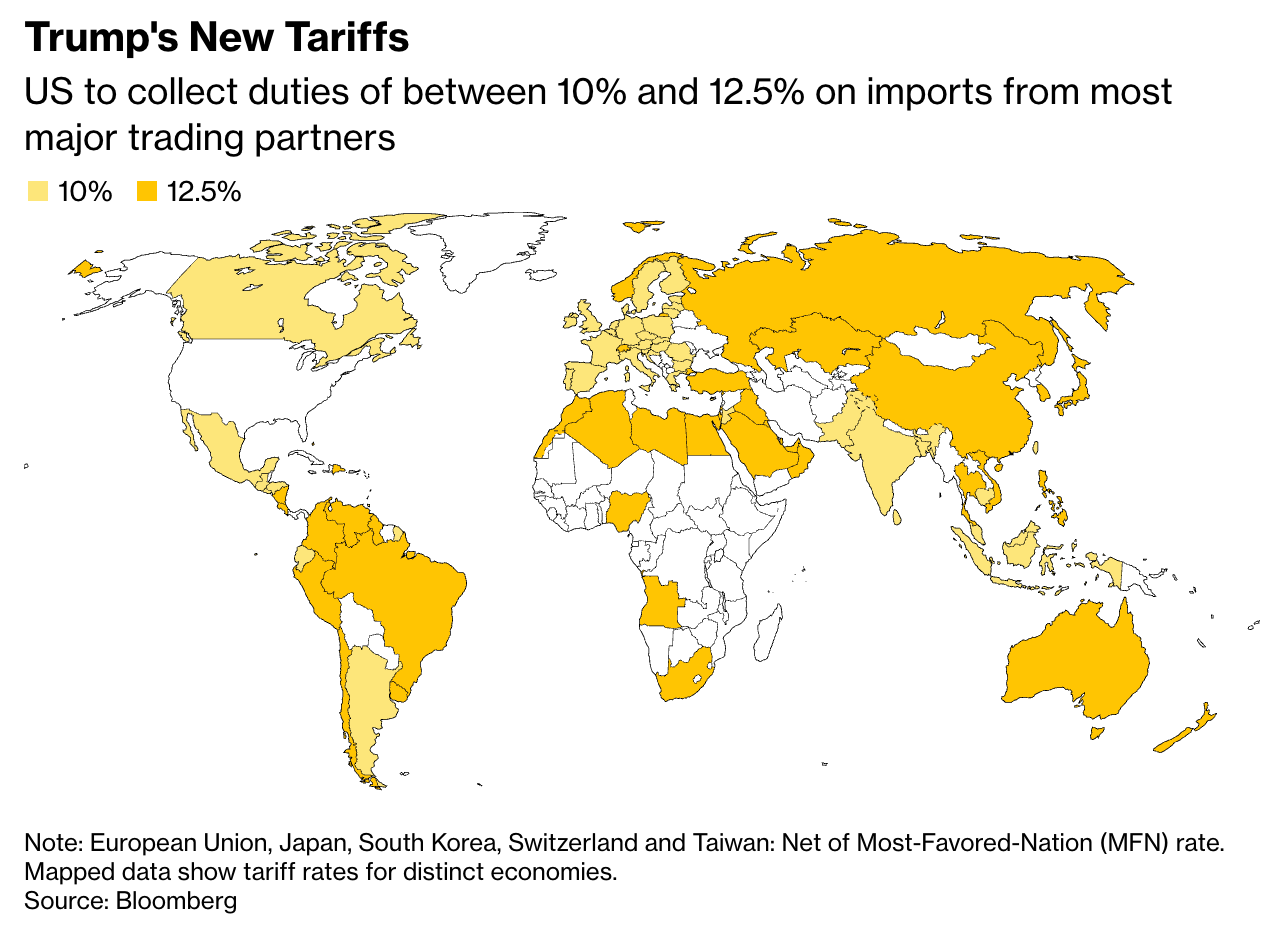
The White House announced a fresh wave of import duties, slapping baseline tariffs ranging between 10-12.5% to almost all major trading partners. The tariffs cover an estimated 99.4% of U.S. imports, though exemptions remain in place for critical sectors including oil and gas, fertilizers and select food items.
While major U.S. trade partners have largely disputed (or flat out rejected) U.S. allegations for the cause of the tariffs, the markets have been relatively contained so far.
What this means for strategic investors: Broad-based tariffs like these can add greater upward pressure to import costs and U.S. domestic inflation. We’ll continue to monitor supply-chain-sensitive equities and build on our macro thesis that real assets will provide hedging as global trade barriers solidify.
II. Chinese Rare Earth Exports to U.S at Record Lows
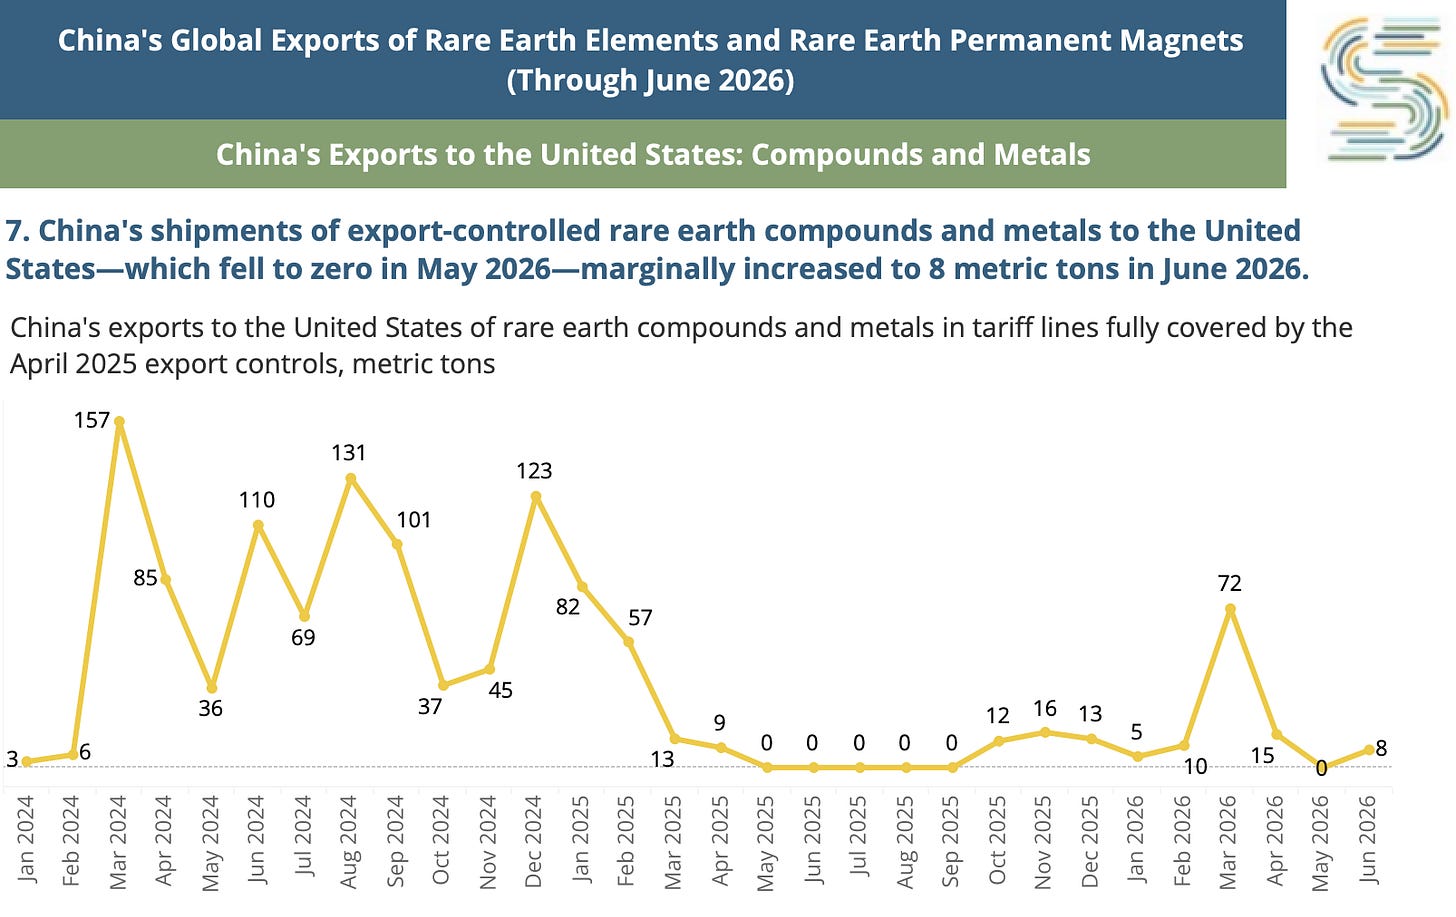
China’s exports of critical and rare earth metals to the U.S. remain near historical lows under strict export controls that were established in April 2025. After those volumes crashed to zero metric tons in May 2026, U.S.-bound shipments only registered a small recovery to 8 metric tons in June.
Taking a further step back, by comparison, you can see that monthly shipments reached 157 metric tons in early 2024, which is drastically higher. This extended lull reflects supply restrictions that are based on more than the recent U.S-China friction, and constitute a deliberate and sustained tightening of critical supply chains.
What this means for strategic investors: Extended restrictions on critical materials are signaling the strategic importance of Western and non-Chinese critical mineral supply chains. That’s because they create tailwinds for domestic producers and processing infrastructure. Seeking opportunities that are building out new supply chains and new rare earth alternatives will be key.
III. Gold ETF Flows Signal Optimism
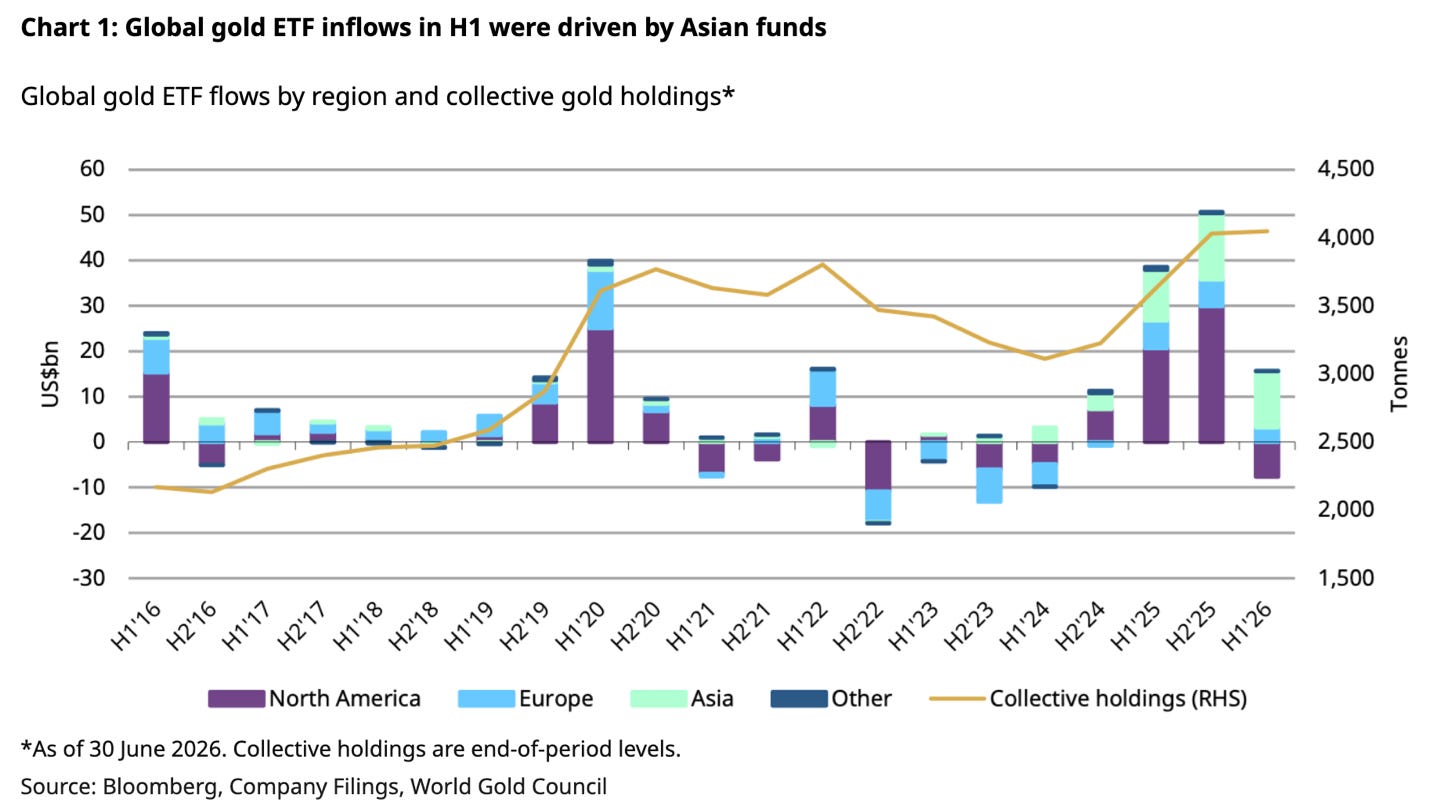
Despite experiencing nearly $9 billion in outflows during June (driven largely by liquidations in North America), global gold-backed ETFs finished the first half of 2026 with net positive inflows of $8 billion. As the chart shows, Asia led the buying spree, recording their strongest H1 inflows on record, while European demand remained steady as well.
Although total assets under management (AUM) declined slightly alongside short-term price adjustments, collective physical holdings increased overall by 18 tonnes during the six-month period.
What this means for strategic investors: Strong regional action in Asian markets underlines the relentless demand for precious metals around the world as central bank monetary reserves and portfolio hedges continue. This supports our thesis for long-term allocations to hard assets.
IV. WSJ: “The Long Bond Is Making People Nervous”
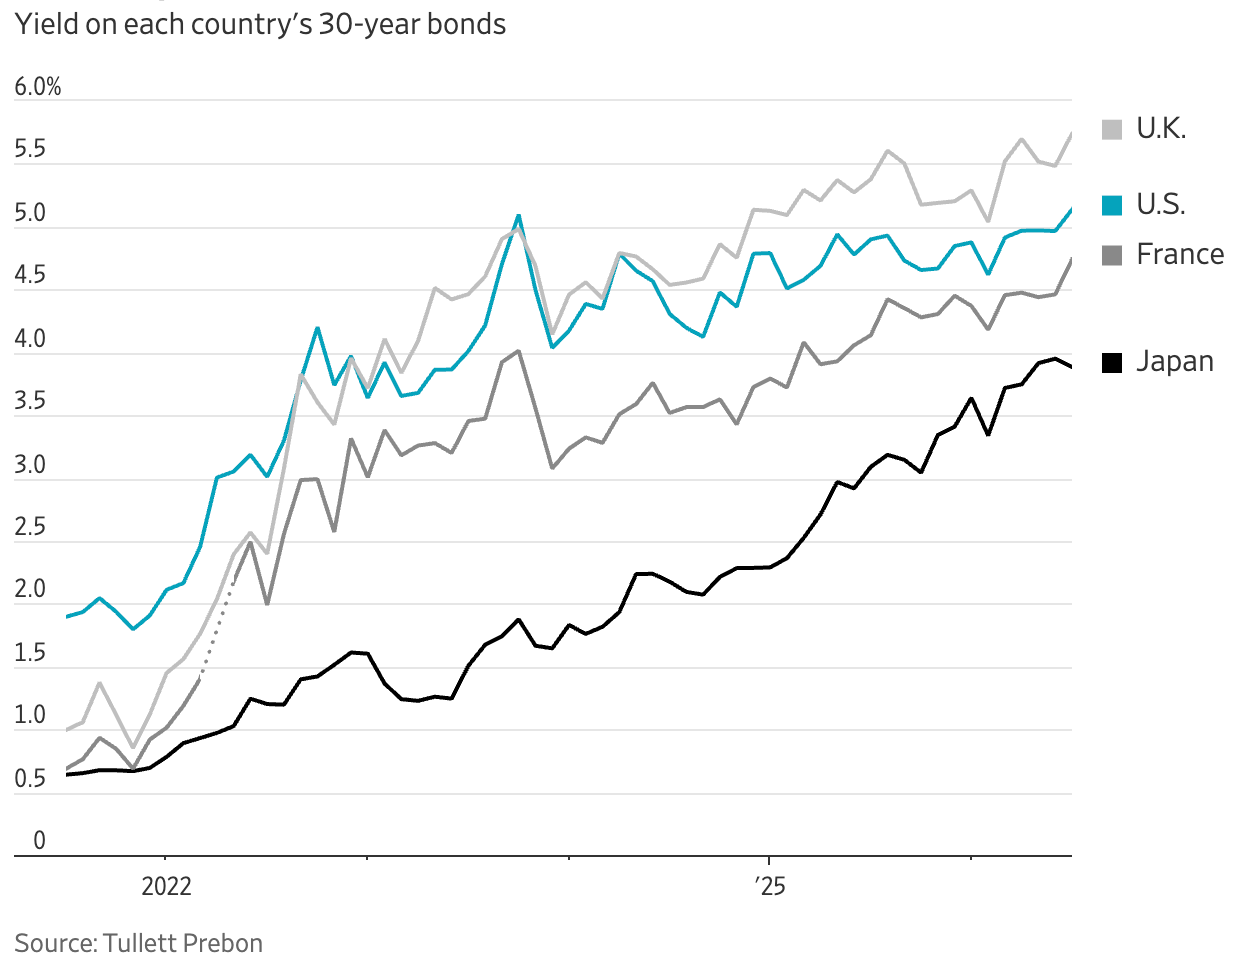
Yields on 30-year sovereign bonds in major developed countries, including the U.S., U.K., France, and Japan, continue creeping upward. This reflects growing investor concerns over long-term fiscal spending trajectories and rising inflation.
As the Wall Street Journal detailed, “The long bond isn’t as closely followed as the 10-year note... But it’s in some ways more informative because its price is so sensitive to changing economic assumptions. The message it’s sending lately isn’t an encouraging one for Wall Street or for Washington.”
What this means for strategic investors: Climbing 30-year bond yields point to higher structural borrowing costs and fiscal pressure, reinforcing the trend of savvy investors diversifying out of pure paper assets and into hard asset plays.
V. Metals and Mining Shares Set for Potential Breakout
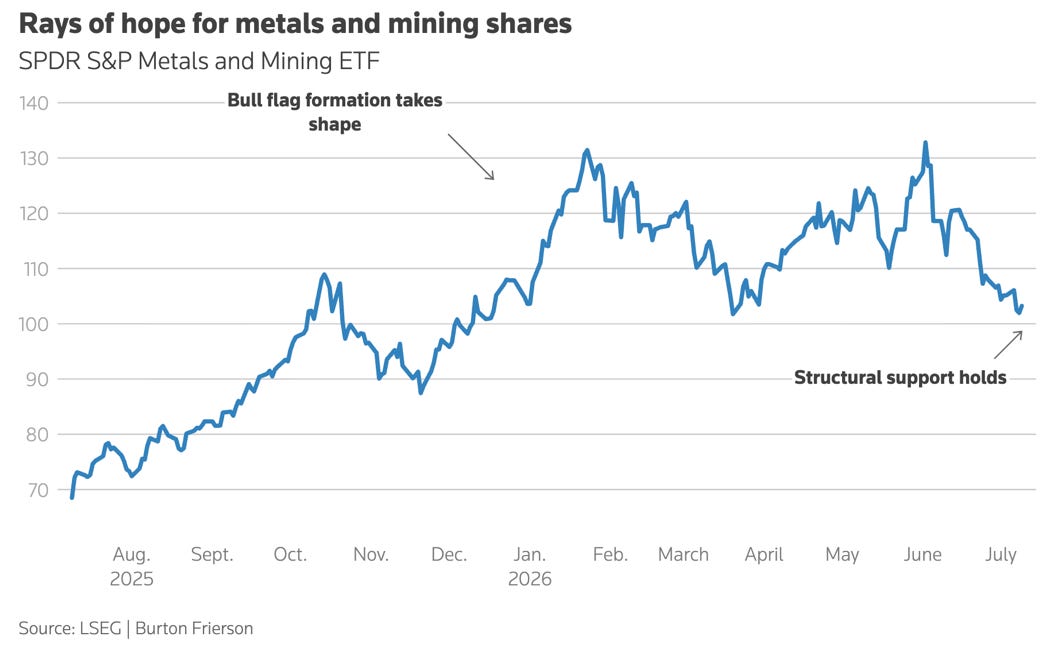
The SPDR S&P Metals & Mining ETF (XME) has held steady above key structural support following an extended bull flag pattern that Reuters honed in on in the chart above. Even in the face of global headwinds, including broad tariffs and geopolitical tensions, the metals and mining sector is benefiting from catalysts such as the AI infrastructure buildout and demand for critical resources.
From a technicals standpoint, the Relative Strength Index (RSI) has turned upward, signaling that selling momentum is offering a chance for buyers to re-enter the market.
What this means for strategic investors: The bullish momentum indicators suggests a potential entry or expansion window for investors into hard assets and mining equities. The opportunity for a broader commodities supercycle to take off remains in play.


Comments
Log in or sign up to join the conversation.