

The worlds of monetary policy, macroeconomics and geopolitics are all moving at a pace that would typically take months, if not years, to transpire, and are now unfolding in real time. We are at a point of convergence where situational awareness is both crucial for those in the markets, and where being strategic and tactful can mean opportunity.
On March 18, the Federal Reserve held interest rates steady at 3.5-3.75% to make its second consecutive hold.
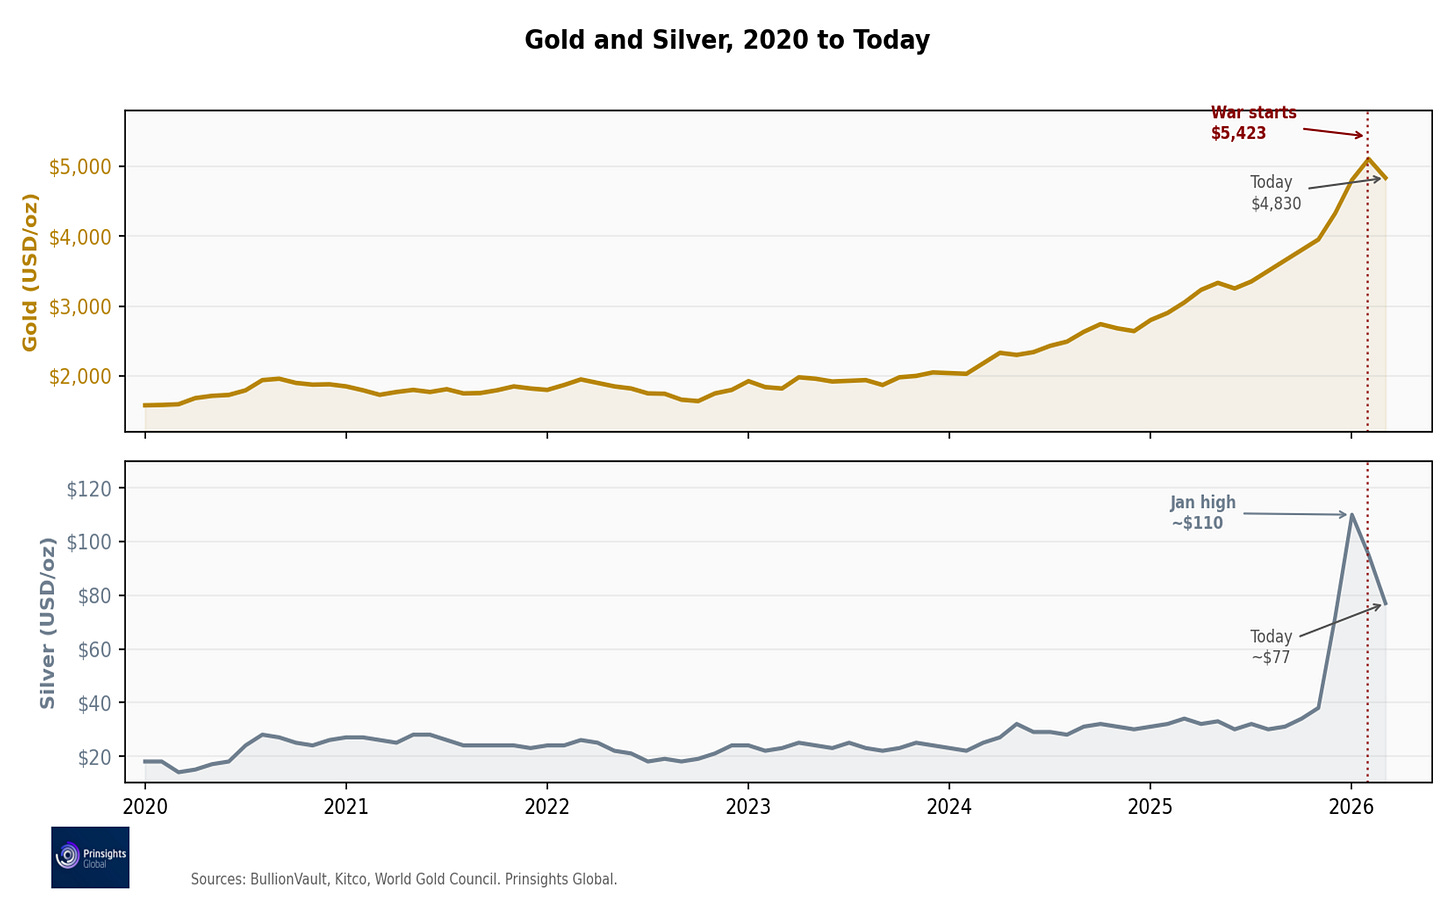
Oil remains near $100. The 10-year Treasury yield rose to 4.21%. And the dollar index crossed back above 100. Meanwhile gold, which surged to $5,423 when the war started on February 28, has spent the past three weeks selling off. It touched $4,967 after the FOMC announcement this week, its lowest level in a month. Silver has fallen more than 35% from its January all-time high.
In theory, a regional war and oil spiking should push gold higher. Yet precious metals are selling off. That’s because the oil shock is raising inflation expectations, which has pushed rate cuts further out – the move has served to strengthen the dollar relative to gold, silver and other hard assets. The very event that should spike safe-haven buying is currently delaying the monetary easing that would amplify it.
The dynamic unfolding is that higher fuel costs could temper mining and processing activities, which in turn could drive their equity prices down by more than the metals themselves.
With so much unfolding, turning to history can often give us context and an outline for what could play out once again. The reality is that we have been in a similar situation before. Four times since 1973, a similar sequence played out, and each time, the underlying structural case and upside trend for gold and silver held.
The Four Historical Parallels and Pivot Points
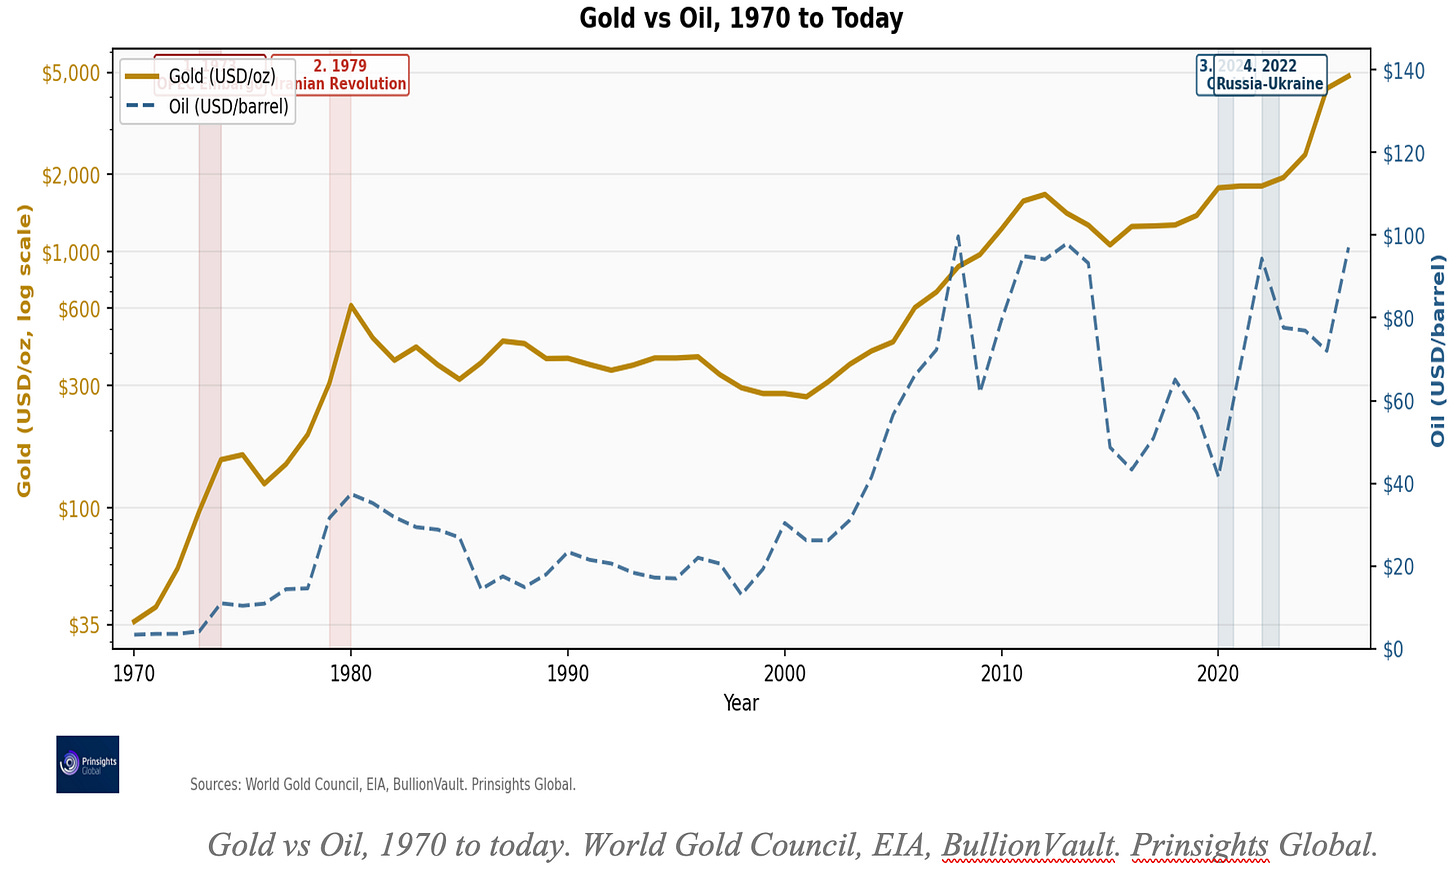
1. 1973. OPEC Oil Embargo: Oil Quadrupled, Gold Followed
In October 1973, Arab oil-producing nations cut off exports to the United States during the Yom Kippur War. Oil quadrupled from $3 a barrel to $12 almost overnight. Gold was suppressed initially.
What drove gold prices up then was the weakening dollar, an inflationary environment that the Fed was slow to contain, and a recession that pushed policymakers toward growth instead of tightening. Gold rose from around $35 in 1970 to $195 by the end of 1974, pulled back, then climbed to $850 by January 1980, a 2,328% gain over the decade.
2. 1979. Iranian Revolution: Second Oil Shock, Gold Rose More Than 300%
In January 1979, the Shah of Iran was overthrown. Iranian production collapsed, and crude oil prices went from around $13 a barrel in early 1978 to over $34 by 1980. Gold responded by surging from around $200 in mid-1978 to $850 per ounce in January 1980, a more than 300% gain in roughly 18 months.
Again, what lifted gold was a weakening dollar, an oil shock from Iran, inflation already elevated before the shock hit, and a Fed caught between fighting inflation and protecting economic growth. All four of those conditions are present today.
3. 2020. Covid Panic. Everything Sold. Gold Hit an All-Time High.
In March 2020, when lockdowns began globally, everything sold, including gold. It dropped to $1,472 on March 17. Silver crashed to $12. Oil briefly went negative in April as demand collapsed. The Fed responded by cutting rates to zero and launching roughly $3 trillion in QE within weeks, the largest and fastest monetary expansion in its history.
By August, gold had reached $2,067, a 40% gain in under five months. Silver rocketed from $12 to $29 in the same window, or more than 140%. The crisis was the trigger for initial shock-related movement, but the monetary policy response was what boosted the metals.
4. 2022. Russian Invasion of Ukraine: Oil $130, Gold Fell then Rose 225%
Russia invaded Ukraine on February 24, 2022. Within two weeks, oil crossed $130 a barrel, and gold had climbed to $2,039 by March 8, an 8.5% gain. Then the Fed began hiking rates at the fastest pace in decades to fight the inflation the energy shock had amplified.
Gold pulled back to below $1,650 by October 2022, nearly 20% off the war high, even as oil held above $80 through most of that year. Silver dove from $27 to $18. Meanwhile, the structural supply issues hadn’t changed. Gold climbed from that $1,650 low to as high as $5,423 before the recent pullback, a gain of more than 225%. Silver leapt from $18 to $72 by the end of 2025, a 300% recovery, rose over $100 in late January and is now at the late 2025 levels.
Using history as our contextual index, this is the closest structural parallel to today. We are facing an uncertain war, supply chain disruptions, geopolitical jockeying, an energy shock, Fed hesitation – all as the dollar strengthens while rate cuts get pushed back.
Gold rallied on the initial Iran war moves, then pulled back as rate expectations shifted but is seemingly holding strong. Silver, which is always more volatile than gold, is showing characteristic turbulence relative to gold – but we expect it to do the same.
The Part the Market Is Missing
The FOMC’s March 18, projections penciled in one more cut for this year. At the press conference that followed its announcement, Chairman Jerome Powell straddled both sides of the fence while underscoring his current uncertainty by saying, “The thing I really want to emphasize is, nobody knows. The economic effects could be bigger, they could be smaller. We just don’t know.”
For a Fed chair who has spent years treating inflation as the central priority, that is a notable posture. It signals that the Fed is already holding space for the possibility that growth concerns outweigh inflation concerns, which is historically when policy loosening follows.
The Fed also shapes long-term yields through balance sheet operations and bank regulation. On March 19, the Fed announced that in April 2026, they would implement new rules reducing capital requirements for the largest banks, another form of monetary loosening.
In December 2025, the Fed also restarted its balance sheet expansion or QE operations, buying $40 billion a month in Treasury bills. If the Iran war persists and growth weakens, the pressure for more QE and other regulatory easing will grow. What matters for gold and silver is the dollar weakness that this monetary expansion produces.
What This Means Right Now
Our Prinsights 2026 gold target remains at $6,000, and our silver target remains at $120. The structural forces that have driven this commodity bull megacycle, including central bank buying, de-dollarization, fiscal stress, and supply chain deficit have not reversed.
If anything, the war has added to our conviction that commodities facing long-term structural deficits, and miners in neutral jurisdictions, are solid long-term investments – even under the duress of short-term volatility.
History shows us that these hard commodity corrections lasted weeks to months. The recoveries played out over years, and were far more profitable.
These remain our core objectives in our Pulse Premium and Founders+ research and model portfolios, where we continue to track the structural forces and opportunities behind these moves.


Comments
Log in or sign up to join the conversation.