

Concerns about the potential impact of coronavirus have triggered a sharp sell-off in global markets over recent days. Nobody knows for sure how the situation will evolve going forward, and the future is always a matter of probabilities as opposed to certainties. However, we don't need a crystal ball to do well in the markets over the long term.
Market conditions always change, and nobody can predict the future with precision. But having a solid and consistent plan, and executing this plan with discipline, can make all the difference in the world in terms of optimizing performance and controlling for downside risk.
The Market Was Overbought To Begin With
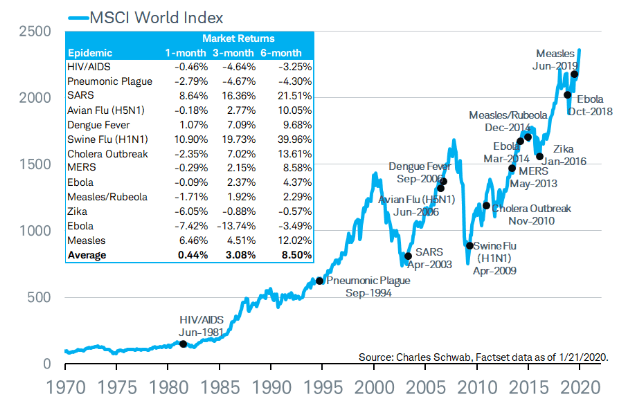
The chart below shows how the stock market has performed during the previous epidemics fears in the past. It is fair to say that markets have generally suffered some kind of pullbacks during these episodes, but the overall impact on prices has been rather moderate.
(Click on image to enlarge)
Source: Schwab
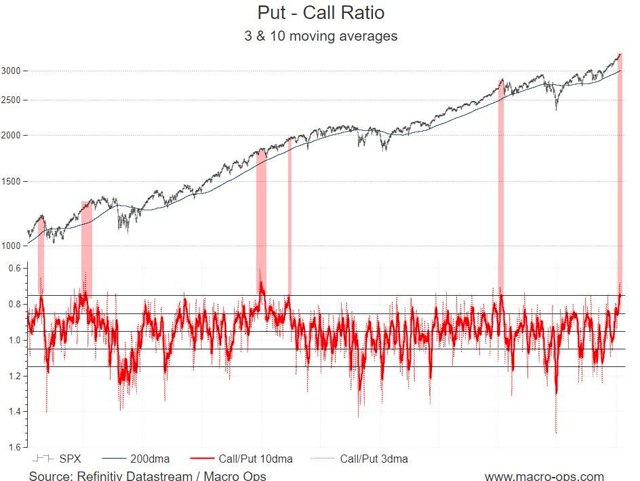
Importantly, market sentiment was getting quite extended even before coronavirus became a major problem for markets. The chart from Macro-ops shows that the put-call ratio reached extreme optimism levels in recent weeks. When this happens, the market generally has some kind of correction.
(Click on image to enlarge)
Source: macro-ops
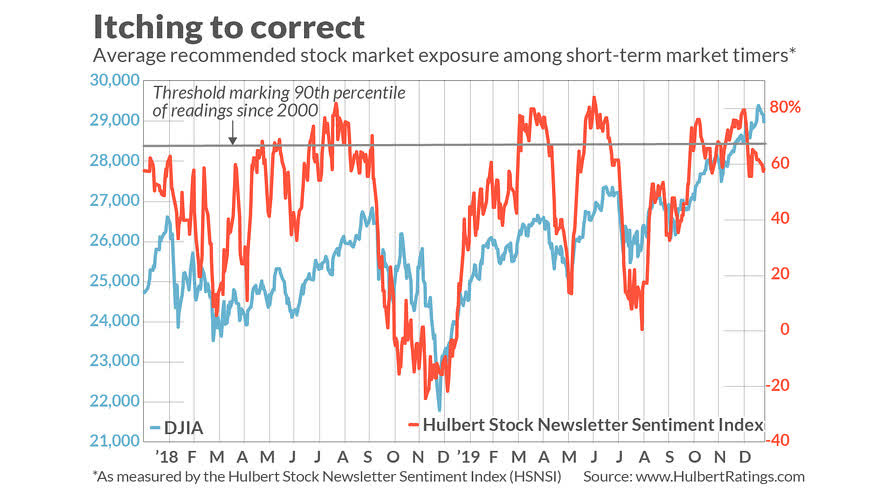
The chart from Mark Hulbert shows how short-term market timing newsletters have been exceptionally optimistic about the market in recent months. Again, this tends to happen before corrections more often than not.
(Click on image to enlarge)
Source: Mark Hulbert via Marketwatch
You never know for sure when the pullback will come or what the trigger for the correction will be, but you know that prices tend to correct after reaching overbought levels in a context of generalized market optimism. This time, it is coronavirus, but it could have been any other uncertainty driver.
The Long-Term Trend Remains Innocent Until Proven Guilty
It is important to differentiate between the short-term market conditions and the main long-term trends in the market. A short-term pullback in a long-term uptrend is generally a buying opportunity. On the other hand, a trend reversal can be remarkably damaging, and investors should run for the exits as quickly as possible when facing one.
There are many weak spots in the global economy nowadays, but it is fair to say that the economy is not in a recession broadly speaking. At the same time, the Fed and other central banks remain largely flexible. This economic environment of slow economic growth and accommodative monetary policy has been quite supportive of equity markets over the past decade.
The economic cycle is quite extended, so we need to keep a close eye on the data in case the indicators start showing that the expansion is coming to an end. But that is not the case right now, and trying to forecast the economy can make more harm than good. In fact, many investors, even renowned asset managers, have missed most of the gains in recent years by trying to forecast recessions and economic crises.
Importantly, sometimes market prices start anticipating economic problems before those problems are visible in the economic data. For this reason, we need to keep an eye on both the fundamental indicators and market behavior.
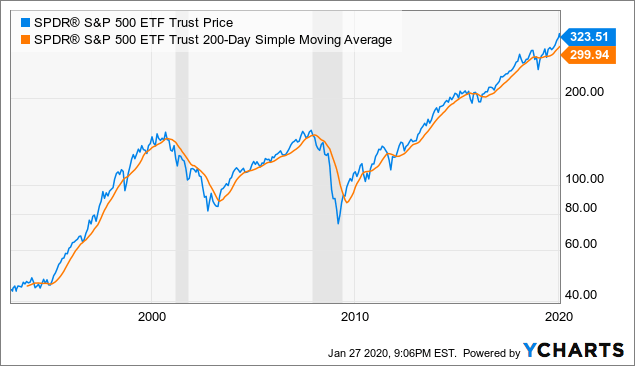
The chart below shows the SPDR S&P 500 (SPY) and the 200 days moving average as a long-term trend indicator. There have been some false signals over time, but the indicator has been quite effective at signaling major turning points and the big bear markets that tend to happen during recessions.
(Click on image to enlarge)
Data by YCharts
One of the main strategies that I monitor to measure market trends is the Asset Class Rotation Strategy. This strategy rotates between 9 ETFs that represent some key asset classes.
- SPDR S&P 500 (SPY) for big stocks in the U.S.
- iShares Russell 2000 ETF (IWM) for small U.S. stocks
- iShares MSCI EAFE (EFA) for international stocks in developed markets
- iShares MSCI Emerging Markets (EEM) for international stocks in emerging markets.
- Invesco DB Commodity (DBC) for a basket of commodities
- SPDR Gold Trust (GLD) for gold
- Vanguard Real Estate (VNQ) for REITs
- iShares 20+ Year Treasury Bond ETF (TLT) for long-term Treasury bonds
- iShares 1-3 Year Treasury Bond ETF (SHY) for short-term Treasury bonds
In order to be eligible, an ETF has to be in an uptrend, meaning that the current market price is above the 10-month moving average, which is roughly equivalent to 200 trading days. Among the ETFs that are in an uptrend, the strategy buys the top 3 the highest relative strength ranking. This ranking is calculated via returns and volatility numbers over 3 and 6 months for the ETFs under consideration.
In simple terms, the strategy buys only the asset classes that are in an uptrend. Among the asset classes that are in an uptrend, it looks for the ones with superior risk-adjusted performance in comparison to the others.
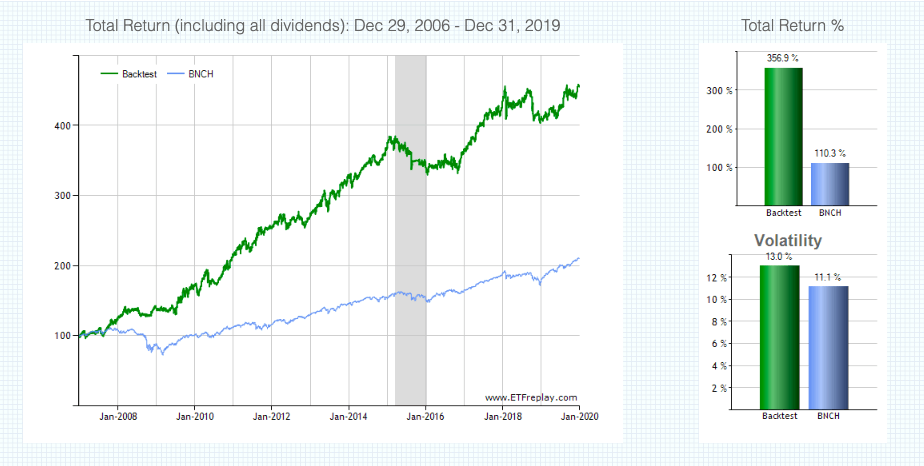
The portfolio is monthly rebalanced, and the benchmark is All-World 60-40 Benchmark (BNCH), which is a portfolio of global stocks and bonds holding 60% in stocks and 40% in bonds.
The charts below show the historical performance numbers for the ACR Rotation Strategy since January of 2007.
(Click on image to enlarge)
Source: ETFReplay
(Click on image to enlarge)

The strategy does a sound job of benefitting from big trends over the long term, even if it can't be expected to outperform in each and every year. The Asset Class Rotation Strategy buys strong assets and sells weak assets. When market trends are strong, either up or down, the strategy works well in terms of capturing those trends. Conversely, when trends are weak, the strategy will tend to get hurt by false signals.
A quantitative strategy such as this one will hardly spend a lot of time in an underperforming position. However, when a particular asset is showing signs of strength, the strategy tends to buy it. If such an asset then reverses down, the strategy will ultimately buy at high prices and sell at low prices.
The strategy is based on price trends and relative strength, so it can be expected to outperform during big bear and bull markets such as 2008 and 2017. On the other hand, it will probably generate disappointing returns in sideways years such as 2015 and 2018.
Importantly, these kinds of strategies are not only useful for investors who trade ETFs based on quantitative indicators. The strategy can provide actionable information in terms of evaluating the overall market environment and positioning your portfolio in the right sectors at the right time.
For the month of January, the strategy is allocated in SPDR S&P 500, iShares Russell 2000, and SPDR Gold Trust, meaning big US stocks, small US stocks, and gold. There is no guarantee that this will be a willing allocation, and the data could obviously change going forward.
However, it is what it is right now, and both stocks and gold are clearly in a long-term uptrend. When the trend is up in terms of both fundamentals and price behavior, short-term corrections are generally buying opportunities, and this remains the base-case scenario until - or unless - the evidence changes.
Plan The Trade And Trade The Plan
In a nutshell, the market was intensely overbought in the short term, and now it seems to be correcting from those overbought conditions. In the long term, however, the trend remains up, and it should be considered innocent until proven guilty.
As expressed in my 2020 market outlook assessment:
The market is overbought and investor sentiment is optimistic in the short term, so any correction in the coming weeks should be no surprise at all. A 5%-10% pullback would be very reasonable and even to be expected to some degree.
But the market the environment still looks favorable for stocks over the next 6 to 12 months. Momentum is pointing in the right direction, the global economy seems to be stabilizing, and central banks all over the world are providing ample liquidity, which is a major driver for prices.
How to approach this environment?
It all depends on your timeframe, risk tolerance levels, and other particular considerations, but we can still highlight some key tactical considerations.
If you are a short-term trader, meaning that you hold your positions over days or months, the smart thing to do is raising your stops. If the market keeps running you let your winners run and you keep raising stops. When the correction comes, you will be selling stocks and taking profits.
If you are a long-term investor, meaning that you hold your positions for months and even years, patience is the best strategy. This is not a good time to be aggressively buying stocks, and the ones that are too extended should be particularly avoided. You need to be selective in your purchases and keep some cash at hand in case there are better entry prices in the near term.
The main point is that we can never know when the correction will come or how deep it will be. But we do know that corrections eventually come after the market reaches overbought levels and sentiment gets extendedly bullish. This has been the case for several weeks now, so the recent declines should not take you by surprise.
Importantly, when markets keep rising non-stop and making historical highs it is easy to say that "a correction would be normal and healthy, even to be expected". However, when the market correction comes, it never feels so normal and healthy. This is why you need to make a plan as opposed to managing portfolio risk as you go.
Now that the correction is already taking place, the smart thing to do is staying on the right course. For short-term traders, this means honoring your stops and taking some profits as prices start moving against you. For long-term investors, having some cash at hand and patiently looking for opportunities to buy during the correction.
The key is not trying to forecast the weather, but having a solid and consistent navigation plan for all kinds of environments. The pessimist is always expecting a storm and the optimist is always expecting sunny conditions. A realist, on the other hand, is focused on adjusting the sails in order to reach the right destination under all kinds of weather conditions.


Comments
Log in or sign up to join the conversation.