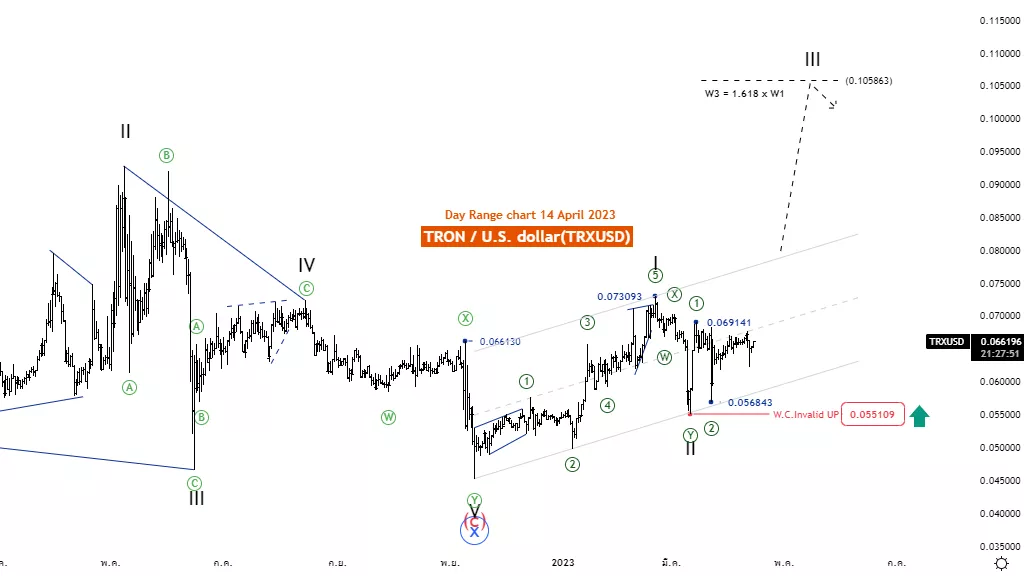
Elliott Wave Analysis TradingLounge Daily Chart, 14 April 23,
TRON /U.S. Dollar (TRXUSD)
TRXUSD Elliott Wave Technical Analysis
Function: Follow trend
Mode: Motive
Structure: Impulse
Position: Wave III
Direction Next higher Degrees: wave (I) of Impulse
Wave Cancel invalid Level: 0.045
Details: Wave II is likely to end at the level of 0.055, and a five-wave rise from this level will confirm it.
TRON /U.S. Dollar (TRXUSD) Trading Strategy: Tron is still in a strong uptrend. It can be above the MA200 and MA50 lines. Therefore, the outlook continues to rise of wave ((3)), which tends to be 1.618 times the length of wave ((1)), at the level of 0.10586.
TRON /U.S. Dollar (TRXUSD) Technical Indicators: The price is above the MA200, indicating an UpTrend The wave oscillators above Zero-Line momentum are Bullish.
TradingLounge Analyst: Kittiampon Somboonsod, CEWA
(Click on image to enlarge)

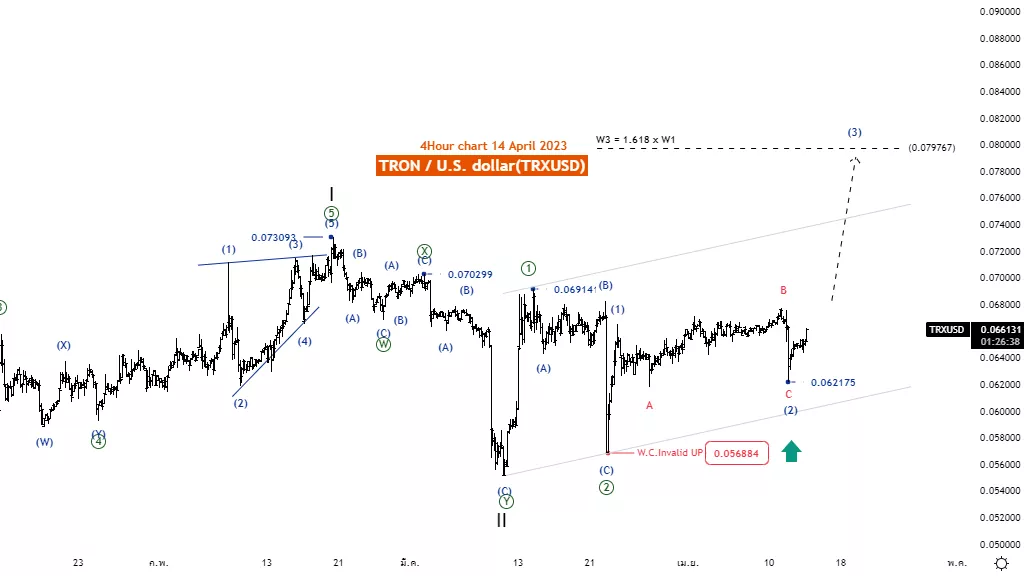
Elliott Wave Analysis TradingLounge 4H Chart, 14 April 23,
TRON /U.S. Dollar (TRXUSD)
TRXUSD Elliott Wave Technical Analysis
Function: Follow trend
Mode: Motive
Structure: Impulse
Position: Wave ((3))
Direction Next higher Degrees: wave III of Impulse
Wave Cancel invalid Level: 0.045
Details: Wave ((3)) is usually equal to 1.618 multiplied Length of wave ((1))
TRON /U.S. Dollar (TRXUSD) Trading Strategy: Tron is still in a strong uptrend. It can be above the MA200 and MA50 lines. Therefore, the outlook continues to rise of wave ((3)), which tends to be 1.618 times the length of wave ((1)), at the level of 0.0797.
TRON /U.S. Dollar (TRXUSD) Technical Indicators: The price is above the MA200, indicating an UpTrend The wave oscillators Below Zero-Line momentum are Bearish.
(Click on image to enlarge)

More By This Author:
Elliott Wave Technical Analysis: Netflix Inc.
Elliott Wave Analysis: European Markets - Thursday, April 13
Elliott Wave Technical Analysis: Bitcoin - U.S. Dollar, Thursday, April 13


