Elliott Wave Technical Analysis: Bitcoin - U.S. Dollar, Thursday, April 13
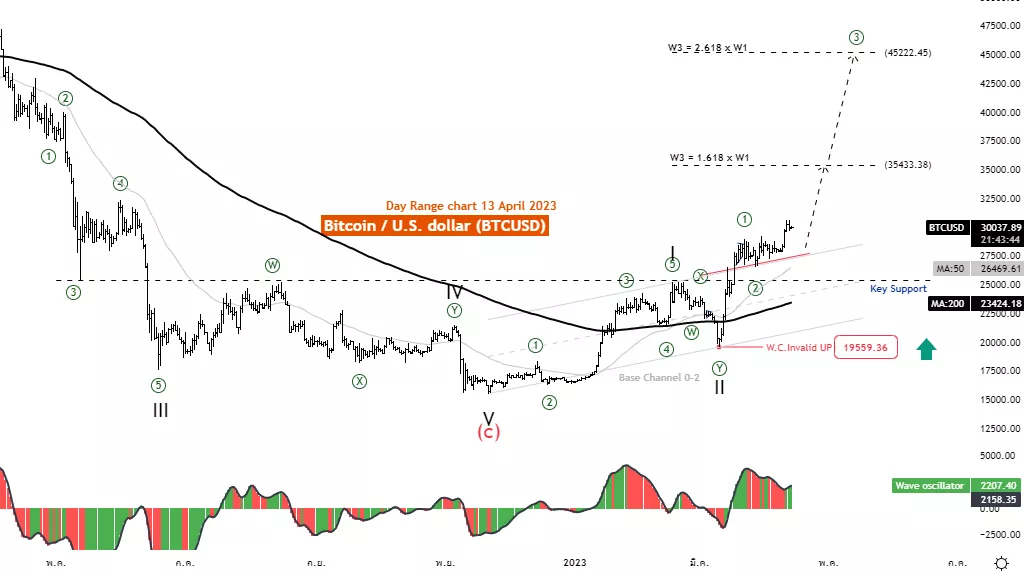
Elliott Wave Analysis TradingLounge Daily Chart, Thursday, April 13.
Bitcoin /U.S. Dollar (BITCOMP)
BTCUSD Elliott Wave Technical Analysis
Function: Follow trend
Mode: Motive
Structure: Impulse
Position: Wave III
Direction Next higher Degrees: wave (I) of Motive
Details: Wave 3 is equal to 1.618 or 2.618 multiplied Length of wave 1
Wave Cancel invalid level: 15479
Bitcoin /U.S. Dollar (BTCUSD)Trading Strategy: Bitcoin Remains in a strong uptrend. It was able to keep above the MA200 and MA50 lines and also managed to break through the upper parallel channel. Thus, the view remains a steady rise of wave ((3)) that tends to be 1.618 or 2.618 times the length of wave ((1)) at levels 35433 and 45222.
Bitcoin /U.S. Dollar (BTCUSD)Technical Indicators: The price is above the MA200 indicating an uptrend. The wave oscillators above Zero-Line momentum are Bullish.
TradingLounge Analyst: Kittiampon Somboonsod, CEWA

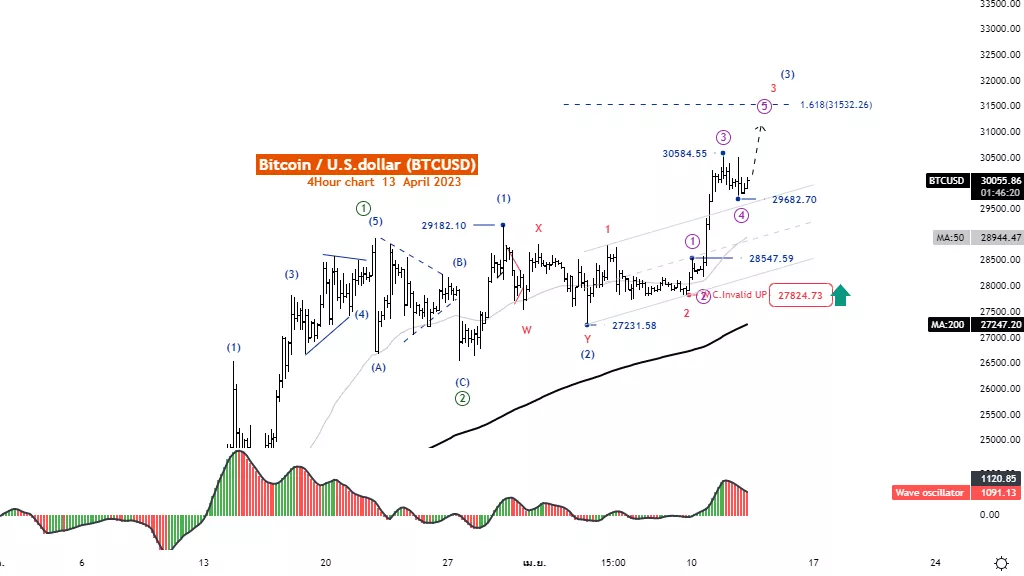
Elliott Wave Analysis TradingLounge 4H Chart, Thursday, April 13.
Bitcoin /U.S. Dollar (BTCUSD)
BTCUSD Elliott Wave Technical Analysis
Function: Follow trend
Mode: Motive
Structure: Impulse
Position: Wave (3)
Direction Next higher Degrees: wave ((3)) of Motive
Details: Wave (3) is equal to 1.618 Length of wave (1)
Wave Cancel invalid level: 27824.73
Bitcoin /U.S. Dollar (BTCUSD)Trading Strategy: Bitcoin Remains in a strong uptrend. It was able to keep above the MA200 and MA50 lines, the view remains a steady rise of wave ((3)) that tends to be 1.618 times the length of wave ((1)) at levels 31503.
Bitcoin /U.S. Dollar (BTCUSD)Technical Indicators: The price is above the MA200 indicating an uptrend The wave oscillators above Zero-Line momentum are Bullish.

More By This Author:
Shopify Inc. Elliott Wave Technical Analysis
Elliott Wave Technical Analysis: NEO/U.S. Dollar - Wednesday, April 12
Elliott Wave Analysis: Australian Stock Market
Analyst Peter Mathers TradingLounge™ Australian Financial Services Licence - AFSL 317817


