
Shopify Inc., Elliott Wave Technical Analysis
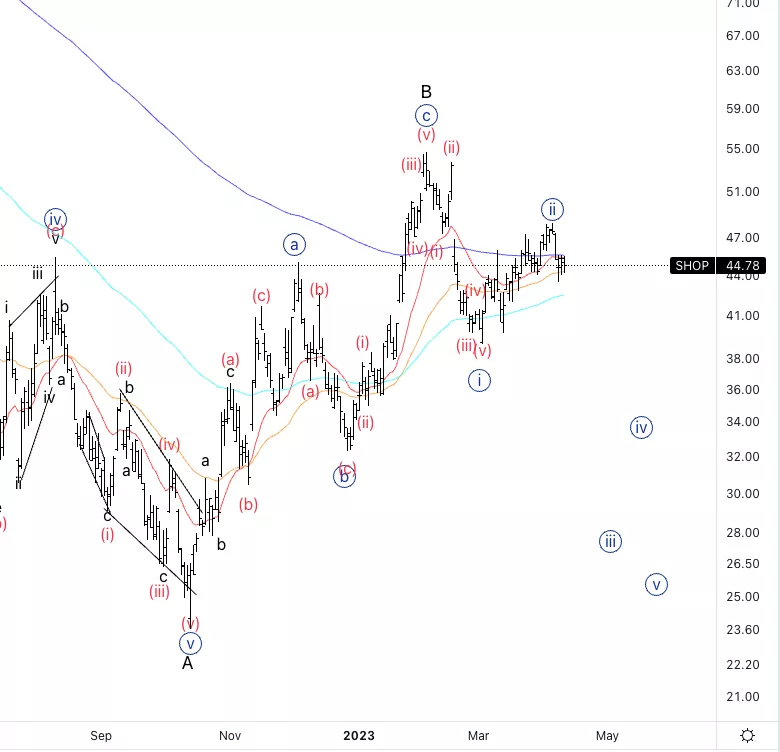
Shopify Inc., (Nasdaq: SHOP): Daily Chart, 12 April 23,
SHOP Stock Market Analysis: Looking for further downside into wave C. An alternate could be that we are still in wave B, more precisely in wave {b} of B and we have another move higher into wave {c} of B before resuming lower.
SHOP Elliott Wave Count: Wave {ii} of C.
SHOP Technical Indicators: In between averages.
SHOP Trading Strategy: Looking short with a pivotal point at 55$.
(Click on image to enlarge)
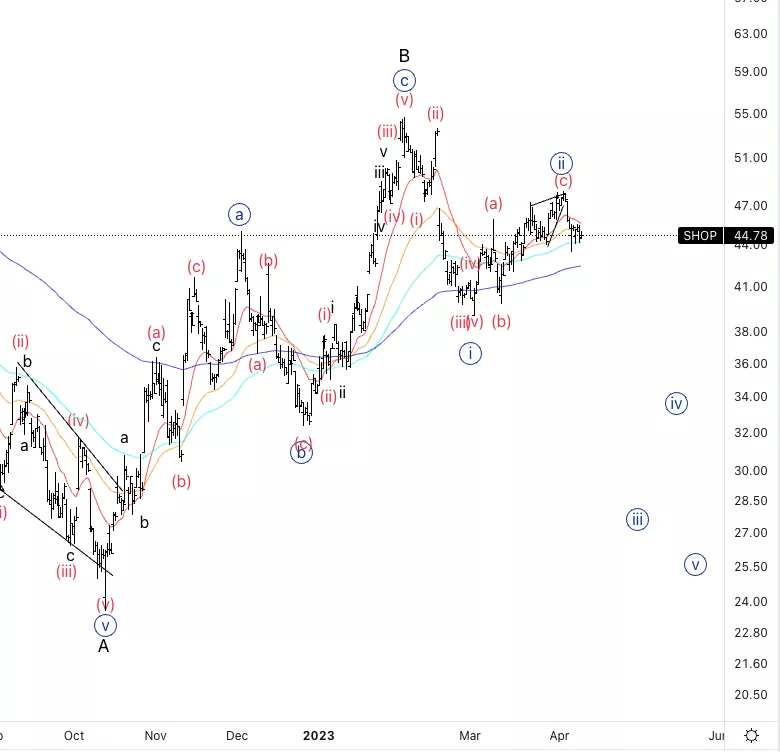
Shopify Inc., SHOP: 4-hour Chart, 12 April 23,
Shopify Inc., Elliott Wave Technical Analysis
SHOP Stock Market Analysis: It looks like we had a three-wave move into wave {ii} and we could be ready to resume lower.
SHOP Elliott Wave count: Wave (i) of {iii}.
SHOP Technical Indicators: In between the 20 and 200EMA.
SHOP Trading Strategy: Looking shorts into wave {iii}.
(Click on image to enlarge)
More By This Author:
Elliott Wave Analysis: Australian Stock Market
Elliott Wave Analysis: U.S. Stocks
Elliott Wave Technical Analysis: DexCom Inc. - Tuesday, April 11


Comments
Log in or sign up to join the conversation.