Elliott Wave Technical Analysis: DexCom Inc. - Tuesday, April 11
Photo by Wance Paleri on Unsplash
DexCom Inc., Elliott Wave Technical Analysis
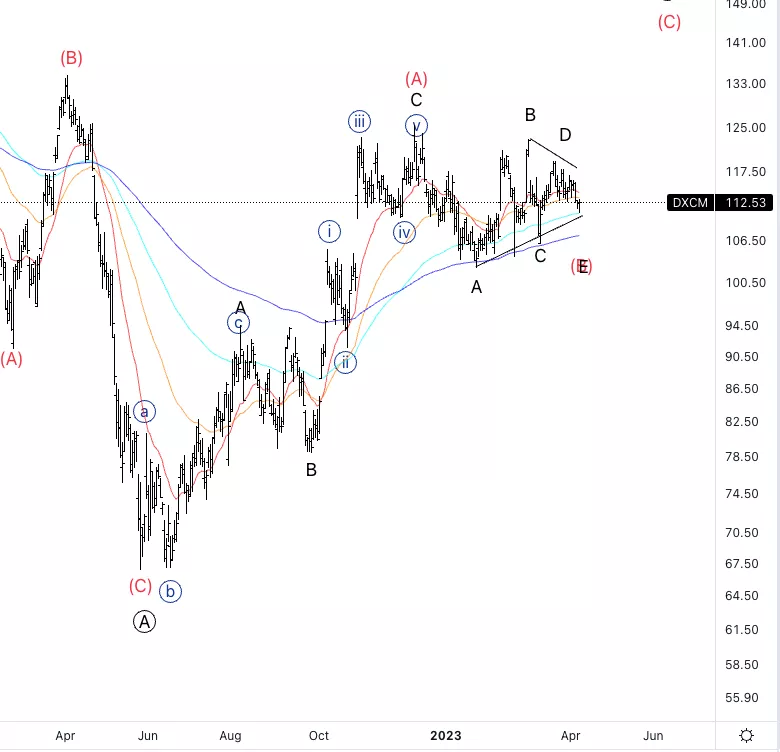
DexCom Inc., (Nasdaq: DXCM): Daily Chart, 11 April 2023.
DXCM Stock Market Analysis: We are looking for further upside in wave (C) as we are seeing what appears to be a triangle in wave (B).
DXCM Elliott Wave Count: Wave E of (B).
DXCM Technical Indicators: In-between averages(typical of a triangle).
DXCM Trading Strategy: Looking for long-term longs which you could enter now with more risk and better reward with a stop below wave A which would invalidate thee count.
Analyst: Alessio Barretta

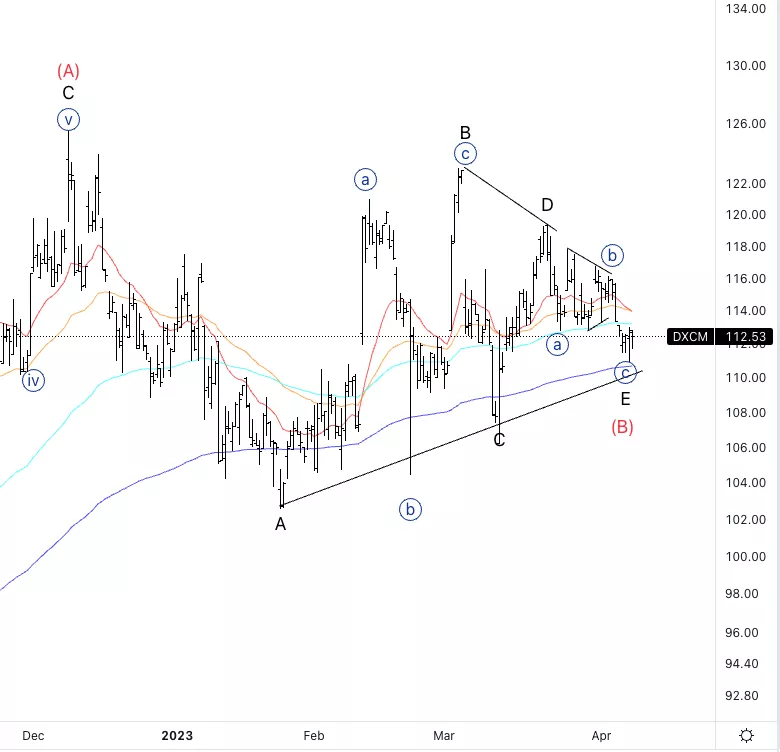
DexCom Inc., DXCM: 4-hour Chart, 11 April 2023.
DexCom Inc., Elliott Wave Technical Analysis
DXCM Stock Market Analysis: We can see a clear here wave move into potential wave E which suggests we could be near the completion of the triangle.
DXCM Elliott Wave count: Wave {c} of E.
DXCM Technical Indicators: In-between averages, but above 200EMA.
DXCM Trading Strategy: Looking longs into wave (C).

More By This Author:
Elliott Wave Technical Analysis: Bitcoin/U.S. Dollar - Tuesday, April 11
Elliott Wave Trading Strategies: SP500 - Nasdaq - Russell 2000 - Dow Jones
Elliott Wave Technical Analysis:10X Genomics Inc.
Analyst Peter Mathers TradingLounge™ Australian Financial Services Licence - AFSL 317817


