Elliott Wave Technical Analysis:10X Genomics Inc.

Image Source: Pixabay
10X Genomics Inc., Elliott Wave Technical Analysis
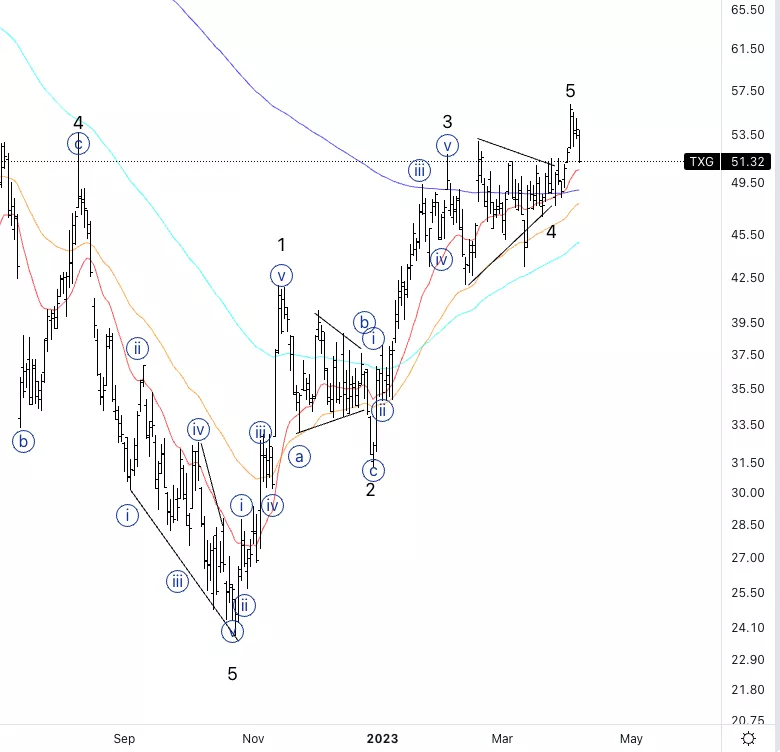
10X Genomics Inc., (Nasdaq: TXG): Daily Chart, 6 April 2023.
TXG Stock Market Analysis: I changed the count a bit, calling a top in wave 5, therefore if you had longs it could be time to take profits. Looking for a three wave move to the downside as either a wave B or 2 to then resume higher.
TXG Elliott Wave Count: Wave 5 of (1).
TXG Technical Indicators: Above all averages.
TXG Trading Strategy: Looking for long-term longs after we get a three wave move into wave (2) or (B).
Analyst: Alessio Barretta

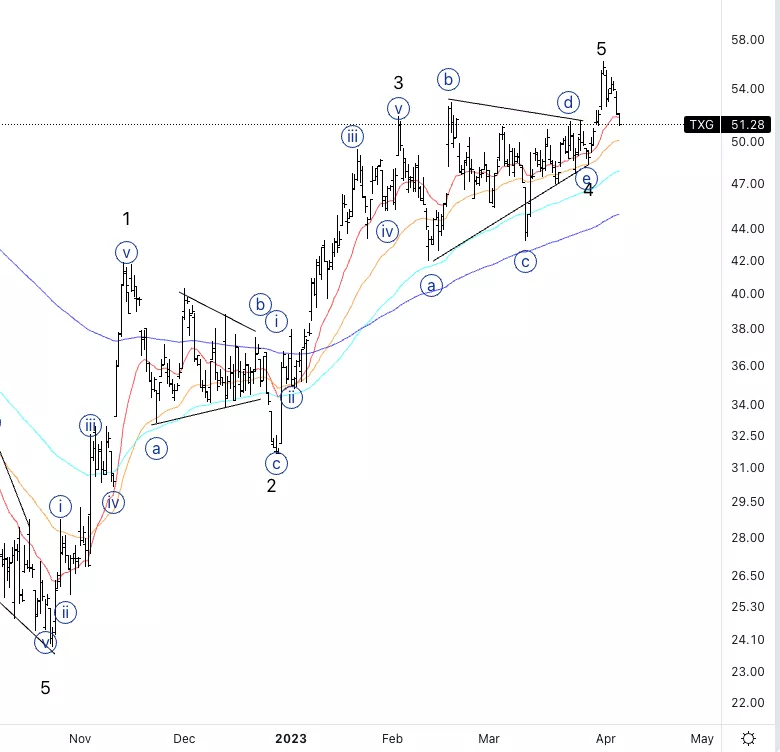
10X Genomics Inc., TXG: 4-hour Chart, 6 April 2023.
10X Genomics Inc., Elliott Wave Technical Analysis
TXG Stock Market Analysis: As you can see it seems like we had a triangle in wave 4 as labeled. Looking for further downside into wave A which could be traded on short timeframes.
TXG Elliott Wave count: Wave {i} of A.
TXG Technical Indicators: In-between averages.
TXG Trading Strategy: Looking for short-term shorts as we should start to unfold lower.

More By This Author:
U.S. Stock Market - Elliott Wave Analysis
Elliott Wave Technical Analysis: Lam Research Corp. - Wednesday, April 5
Elliott Wave Technical Analysis: Binance/U.S. Dollar - Wednesday, April 5
Analyst Peter Mathers TradingLounge™ Australian Financial Services Licence - AFSL 317817


