Elliott Wave Technical Analysis: Netflix Inc.
Image Source: Unsplash
Netflix Inc., Elliott Wave Technical Analysis
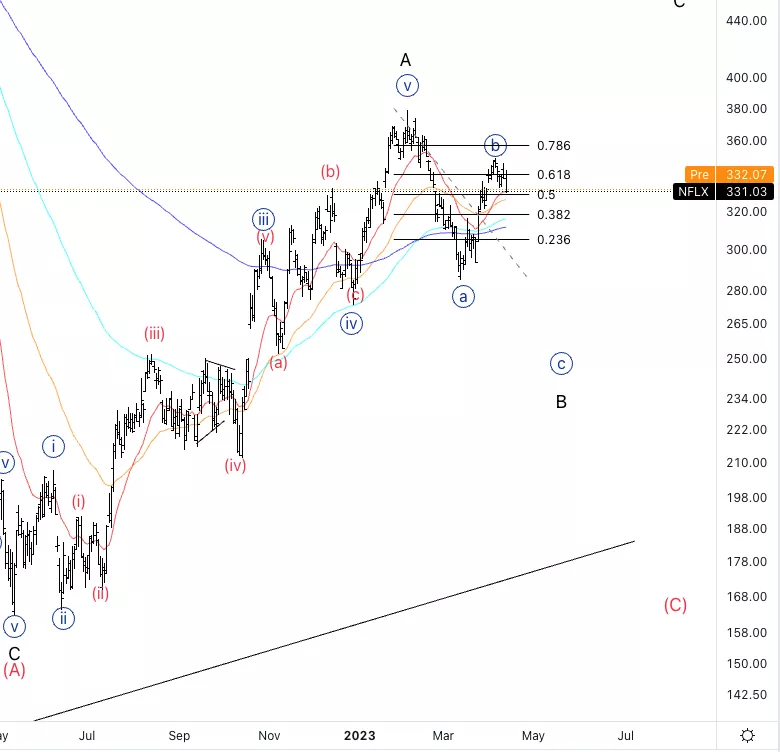
Netflix Inc., (Nasdaq: NFLX): Daily Chart, 13 April 2023.
NFLX Stock Market Analysis: Looking for a continuation lower into wave B as we have had a sharp move off the top in Nov 2021.
NFLX Elliott Wave Count: Wave {b} of B.
NFLX Technical Indicators: Above averages.
NFLX Trading Strategy: Looking for further confirmation before considering shorts.
Analyst: Alessio Barretta

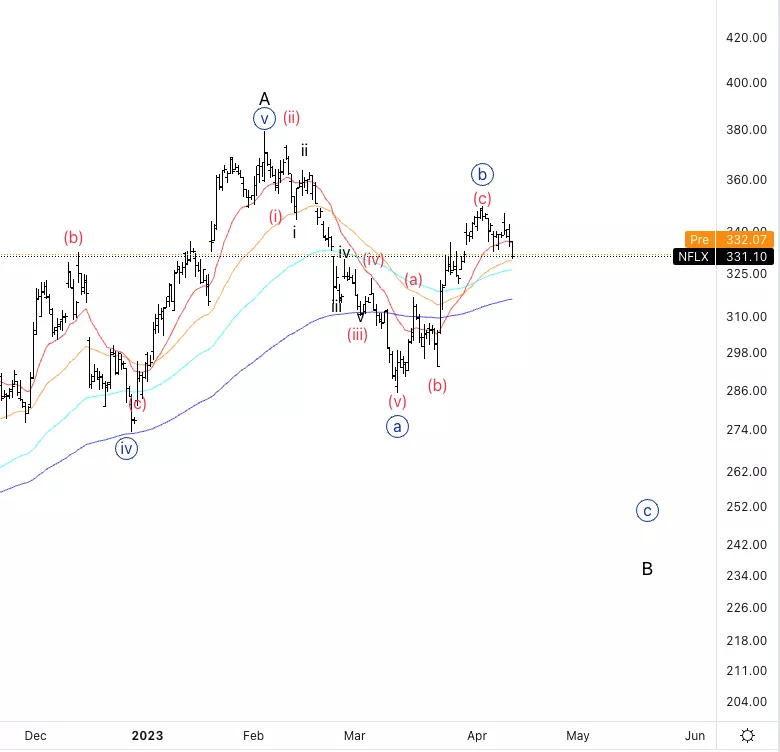
Netflix Inc., NFLX: 4-hour Chart, 13 April 2023.
Netflix Inc., Elliott Wave Technical Analysis
NFLX Stock Market Analysis: We can see a potential three wave move into wave {b}. Looking for further downside which needs more confirmation.
NFLX Elliott Wave count: Wave (i) of {c}.
NFLX Technical Indicators: Below 20EMA.
NFLX Trading Strategy: Looking for short-term shorts, ideally if we break the bottom of wave (b).

More By This Author:
Elliott Wave Technical Analysis: Bitcoin - U.S. Dollar, Thursday, April 13
Shopify Inc. Elliott Wave Technical Analysis
Elliott Wave Technical Analysis: NEO/U.S. Dollar - Wednesday, April 12
Analyst Peter Mathers TradingLounge™ Australian Financial Services Licence - AFSL 317817


