


From Sandberg, et al. (July 2019) in Epidemiology:
Now compare against shoot-from-the-hip comments on Econbrowser, such as this from Steven Kopits on 5/31/2018:
Excess deaths in PR through year end, those recorded by the Statistics Office, numbered only 654. Most of these occurred in the last ten days of September and the whole of October. While the power outages there were exacerbated by the state ownership of PR’s utility, a large portion of the excess deaths would likely have occurred regardless, given the terrain and the strength of the hurricane. Thus, perhaps 300-400 of the excess deaths would have occurred regardless of steps anyone could have made to fix the power supply. The remainder can be attributed essentially to the state ownership of the power utility.
I would note that excess deaths fell by half in December. Thus, the data suggests that the hurricane accelerated the deaths of ill and dying people, rather than killing them outright. I would expect the excess deaths at a year horizon (through, say, Oct. 1, 2018) to total perhaps 200-400. Still a notable number, but certainly not 4,600. [emphasis added-MDC]
Mr. Kopits’ updated (6/4) analysis concludes, even with updated data:
Thus, the year-end excess death toll of 1,400 may be treated as a firm number in practice.
I think “firm” is an adjective to be avoided in these situations. Here is a graph presenting selected estimates, from this April post.
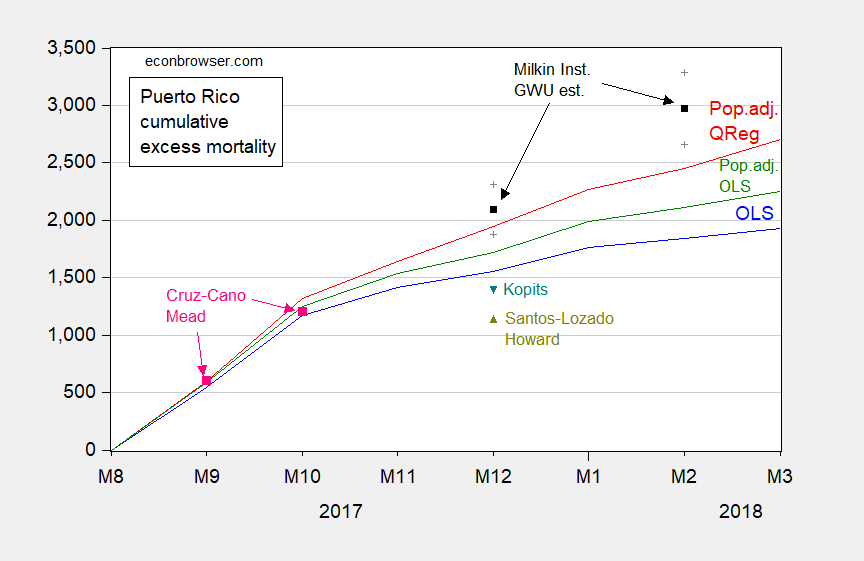
Figure 1: Cumulative excess deaths from September 2017, for simple time dummies OLS model (blue), OLS model adjusting for population (green), and Quantile Regression model adjusting for population (red), Milken Institute point estimate (black square) and 95% confidence interval (gray +), Santos-Lozada, Howard letter (chartreuse triangle), Cruz-Cano and Mead (pink squares), Kopits (teal triangle). Not pictured: Kopits estimate of 300-400 for October 2018. Source: author’s calculations, Milken Institute (2018), Santos-Lozada and Howard (2018), Cruz-Cano and Mead (2019), and Kopits (2018).
