


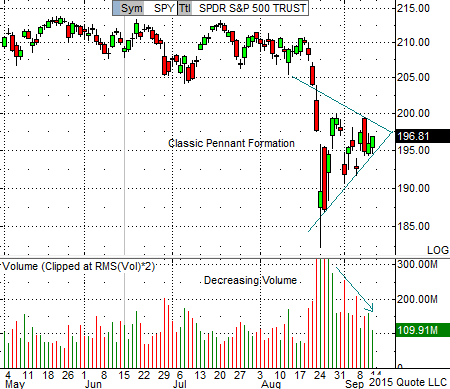
The major averages appear to be on the verge of completing negative chart patterns boding further downside. The S&P 500, Dow Industrials, and the Russell 2000 are forming classic bearish pennant formations while the Dow Transports and the Nasdaq are nearing completion of bearish wedge formations. (The above chart of the SPY, the S&P 500 tracking stock, illustrates the pennant formation.)
A brief explanation of flags, pennants, and wedges for those unversed in technical analysis. Flags, pennants, and wedges are all minor variations on the same theme and on a chart they look like what their names imply. They are considered to be continuation patterns meaning that they tend to occur in the middle of an uptrend or a downtrend. A true formation of this type is nearly always accompanied by a contraction in volume (see the above chart), and if that doesn't occur, the formation should be viewed with a healthy degree of skepticism.
One can also use these formations to estimate the magnitude of the uptrend or the downtrend once the pattern is completed. Technicians typically set a price target that reflects the magnitude of the rise (or drop) before pattern formation. In the case of the SPY above, one can use the major support level of 205 as the upper bound and the pennant "nose" price near 195 as the lower bound. This gives a 20 point difference making the projected price target in the region of 175.
