
In the United States, money is created as credit and debt. The US Constitution1 allows the federal government to produce money directly, but that is not how the nation has chosen to operate for most of its money. In this post, we take a look at the various sources for issuing credit and debt that provide money to run the country.

From a photo by Giorgio Trovato on Unsplash.
Introduction
A significant part of US money is created by bank credit, which is issued through loans to individuals, organizations, and businesses. Another important source of money occurs through federal government deficit spending. A third and smaller source of money is coinage and currency produced by the government. This third source contributes less than 3% of the money in the economy.
Types of Bank Credit
We have recently been studying bank credit issuance in relation to consumer inflation. This falls into the following categories:
- Household and Nonprofit Organization Credit (HNO)2
- Mortgage Debt (MORT)3
- Nonfinancial Corporate Credit (NFC)4
- Financial Corporate Credit (Financial System Debt – FSD)5
Federal Government Deficit Spending (FDS)6
The economy’s money increases when the government spends more than it collects in taxes. The fact that Treasury bonds are sold equal to the deficit does not reduce the increase in money. The bonds are a less liquid form of money, like a savings account.
Money Supply
The money supply is the total of all monetary assets used to make payments. There are several measures of the money supply:7
- The monetary base: The sum of currency in circulation and reserve balances or deposits held by banks and other depository institutions in their accounts at the Federal Reserve.
- M1: The sum of currency held by the public and transaction deposits (inclusive of currency held by the public and transaction deposits—a category that includes balances held in checking accounts and other very liquid deposits) at depository institutions (which are financial institutions that obtain their funds mainly through deposits from the public, such as commercial banks, savings and loan associations, savings banks, and credit unions) and branches of foreign banks operating in the United States.
- M2: M1 plus small-denomination time deposits (those issued in amounts of less than $100,000) and retail money market mutual fund shares.
Data
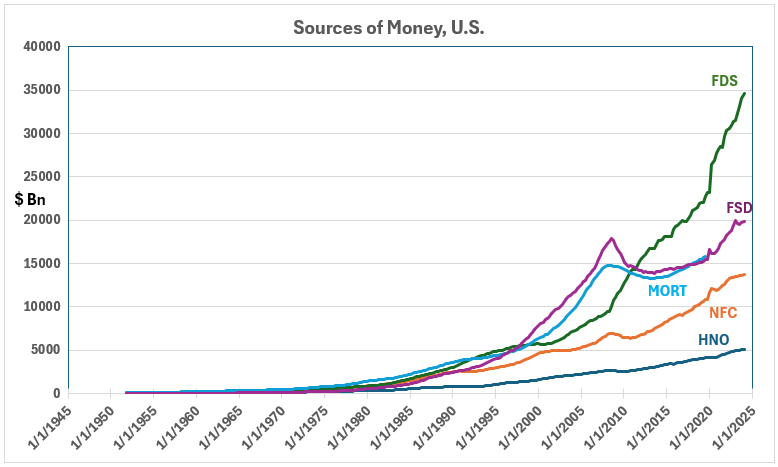
The data sources are from the Federal Reserve Bank of St. Louis Fred database.8-13 Figure 1 shows the money created from five sources from 1965 to 2019. Data for all sources are not available for years before and after this interval.
Figure 1. Money Created by Banks and US Government 1965-2019
(Click on image to enlarge)
The data shows the outstanding debt over time. When loans are repaid, the amounts offset the new credit issued. When defaults occur, the outstanding debt is written down and removed from the total.
There is an important difference between repayment and default. Repayment removes money from general circulation, while default does not. Thus, in the case of default, the amount of outstanding debt is reduced, but no money is removed from circulation.
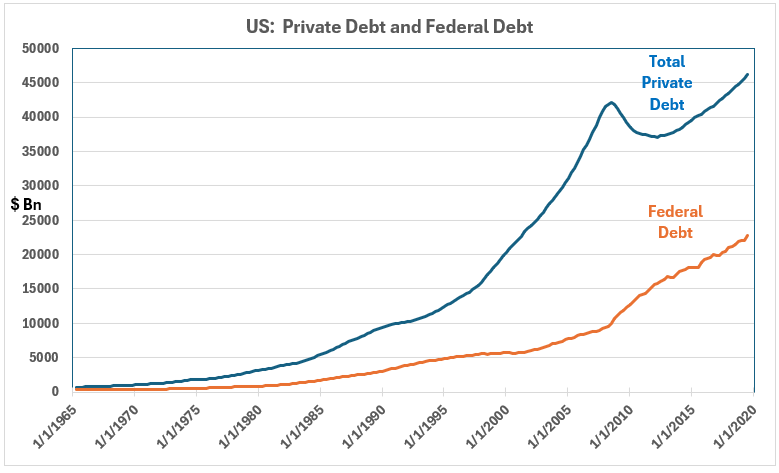
Figure 2. Private and US Government Debts
(Click on image to enlarge)
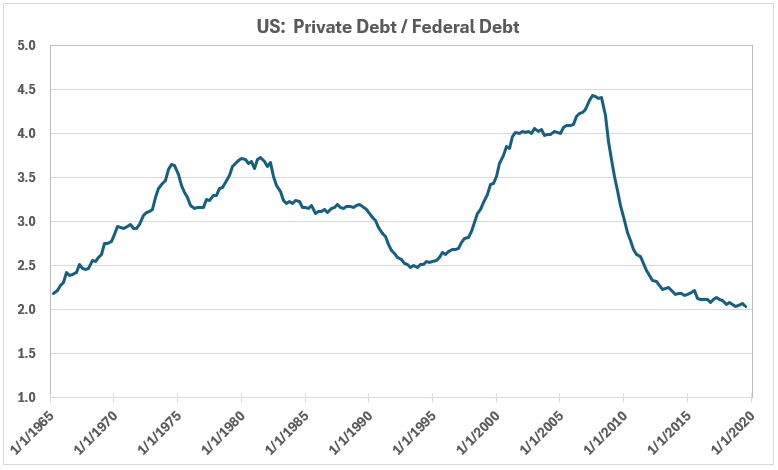
The total private debt is larger than the federal debt (national debt). Private debt is also more volatile than national debt, and the ratio of private debt to national debt has varied over time (Figure 3).
Figure 3. The Ratio of Private Debt to Federal Debt
(Click on image to enlarge)
The all-time high for private debt was reached as the Great Financial Crisis of 2008-09 started.
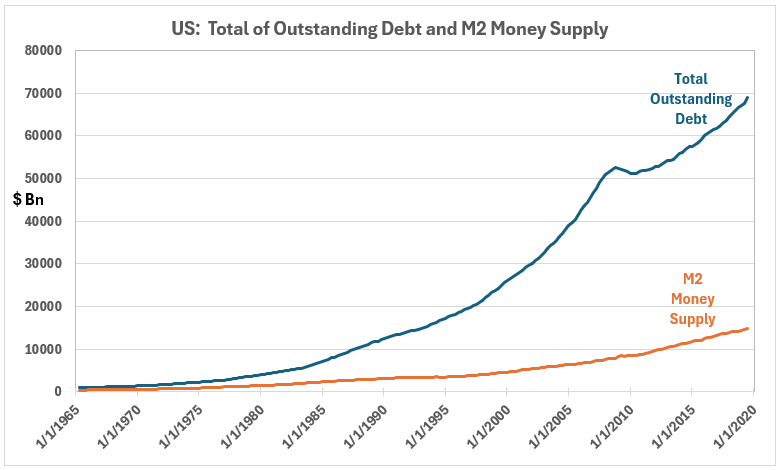
Figure 4. Total Private and Federal Debt and M2 Money Supply 1965-2019
(Click on image to enlarge)
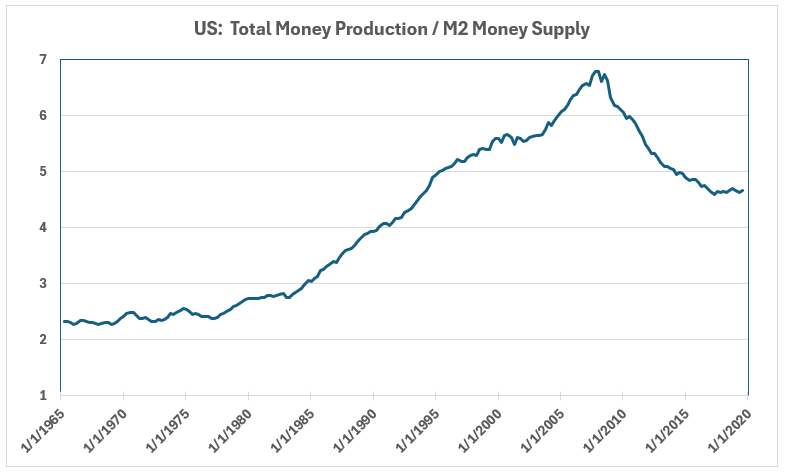
Figure 4 shows that the total outstanding debt has been much greater than the M2 money supply. The ratio can be seen in Figure 5.
Figure 5. Total Money Production and M2 Money Supply 1965-2019
(Click on image to enlarge)
Discussion
It is concerning that the money created is several times larger than the money used for making payments. There are a couple of ways that can occur:
- Credit issued may be spent overseas to purchase imports and to make foreign investments.
- Money may remain in the US economy but not be used for payments.
How can money remain in the US and not be used for payments? One obvious possibility is that it is saved in a way that it becomes illiquid. Such would be the case if the savings were in treasury securities.
As far as the economy is concerned, the money might as well be stuffed in a mattress and kept hidden. From the individual’s point of view, treasury paper is much superior to a mattress – bills, notes, and bonds pay interest. But otherwise, the process is akin to hoarding.
Conclusion
We now understand how the associations between changes in debt amounts and inflation can differ from those between the M2 money supply and inflation: Money created does not go substantially into the money supply. This presents new complications for interpreting how changes in money can influence inflation.
Footnotes
- Constitution of the United States, Article I, Section 8, Clause 5.
- Lounsbury, John, “Consumer Credit and Inflation: Part 2”, EconCurrents, September 10, 2023. https://econcurrents.com/2023/09/10/consumer-credit-and-inflation-part-2/.
- Lounsbury, John, “Mortgage Debt and Inflation: Part 2”, EconCurrents, October 8, 2023. https://econcurrents.com/2023/10/08/mortgage-debt-and-inflation-part-2/.
- Lounsbury, John, “Nonfinancial Corporate Credit and Inflation: Part 2”, EconCurrents, February 18, 2024. https://econcurrents.com/2024/02/18/corporate-nonfinancial-credit-and-inflation-part-2/.
- Lounsbury, John, “Financial Sector Debt and Inflation, Part 2″, EconCurrents, March 17, 2024. https://econcurrents.com/2024/03/17/financial-sector-debt-and-inflation-part-2/.
- Lounsbury, John, “Government Spending and Inflation. Reprise and Summary,” EconCurrents, August 20, 2023. https://econcurrents.com/2023/08/20/government-spending-and-inflation-reprise-and-summary/.
- Board of Governors of the Federal Reserve System, “What is the money supply? Is it important?” Last Update: July 19, 2024. https://www.federalreserve.gov/faqs/money_12845.htm.
- Federal Reserve Bank Economic Data, Households and Nonprofit Organizations; Consumer Credit; Liability, Level, Billions of Dollars, Quarterly, Seasonally Adjusted, updated July 7, 2024. https://fred.stlouisfed.org/series/HCCSDODNS.
- Federal Reserve Bank Economic Data, Nonfinancial Corporate Business; Debt Securities and Loans; Liability, Level, Billions of Dollars, Quarterly, Seasonally Adjusted, updated July 7, 2024. https://fred.stlouisfed.org/series/BCNSDODNS.
- Federal Reserve Bank Economic Data, Mortgage Debt Outstanding, All holders (DISCONTINUED), Millions of Dollars, Quarterly, Not Seasonally Adjusted, updated Dec. 122, 2019. https://fred.stlouisfed.org/series/MDOAH.
- Federal Reserve Bank Economic Data, Domestic Financial Sectors; Debt Securities and Loans; Liability, Level, Billions of Dollars, Quarterly, Seasonally Adjusted, updated June 7, 2024. https://fred.stlouisfed.org/series/DODFS.
- Federal Reserve Bank Economic Data, Federal Debt: Total Public Debt, Millions of Dollars, Quarterly, Not Seasonally Adjusted, updated June 6, 2024. https://fred.stlouisfed.org/series/GFDEBTN.
- Federal Reserve Bank Economic Data, M2, Billions of Dollars, Monthly, Not Seasonally Adjusted, updated June 23, 2024. https://fred.stlouisfed.org/series/M2NS.
More By This Author:
Ranking Associations With Inflation
Quantity of Money and Inflation - Part 2: Confounding
Quantity of Money and Inflation - Part 1: General Considerations


Comments
Log in or sign up to join the conversation.