
We have found that the correlation relationships between various types of credit and inflation are variable over time. The same is true for the M2 money supply. The sources of credit studied are government deficit spending,1,6 consumer credit,2 mortgage debt,3 nonfinancial corporate credit,4 and financial sector debt.5 The correlation between the M2 money supply and inflation was reported here.7 The measure of inflation for these studies was the Consumer Price Index (CPI).8 In this and subsequent posts, we will review the results of previous studies. The objectives will be to understand the quantity of money vs. inflation correlation studies’ potential limitations and rank the observed correlations for possible importance.

Photo by Alexandre Perotto on Unsplash
Introduction
The hypothesis we are testing is that inflation depends on credit or money supply in a linear manner, expressed in the following equation:
I = mS + b
where
I = Change in CPI (the Consumer Price Index)
S = Change in the amount of Credit or M2 Money Supply
The two constants, m and b, define the relationship of y, the dependent variable, to x, the independent variable. By writing the relationship in this way, we imply that CPI (y) depends on specified credit or money supply (x). But this is a mere formality because the equation can be rearranged:
S = m’ I + b’
where
m’ = 1/m
b’ = -b/m
There is an equivalent equation implying that that amount of credit or money depends on inflation without affecting results and conclusions.
Data
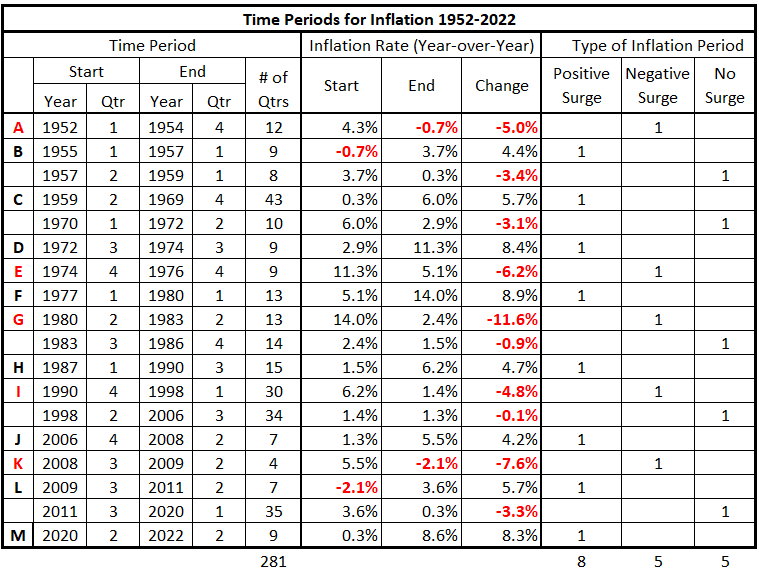
The inflation time series8 has periods of inflationary surges, deflationary surges, and times when inflation/disinflation/deflation have trends with ≥4% change uninterrupted by countertrend moves >1.5%.
Figure 1 displays the inflation data for the study period 1952-2022.
Figure 1. CPI Rolling Four Quarter Inflation 1952-2022 with Significant Changes in Inflation Noted
(Each letter identifies the end of a significant move. An * identifies the end of an insignificant period.)

A summary of the data in Figure 1 is in Table 1.
Table 1. Timeline of Inflation Data 1952-2022
Discussion
In this review, we will consider periods with inflation surges. Three areas are concerning:
- Are there possible confounding9 factors in the correlation determinations?
- How can a variety of dissimilar correlation patterns be evaluated and ranked?
- Is a linear model helpful for the present work?
These are discussed individually.
Does Confounding Occur in the Quantity of Money vs. Inflation Studies?
These studies yield some puzzling results. One primary concern is that the associations (correlations) for the M2 money supply with inflation are sometimes much smaller (or negative) than some credit sources contributing to M2. An example of this is the inflationary surge of 1976-80. See the three figures below.
Figure 2. Correlation of Household and Nonprofit Credit with CPI 1976-80
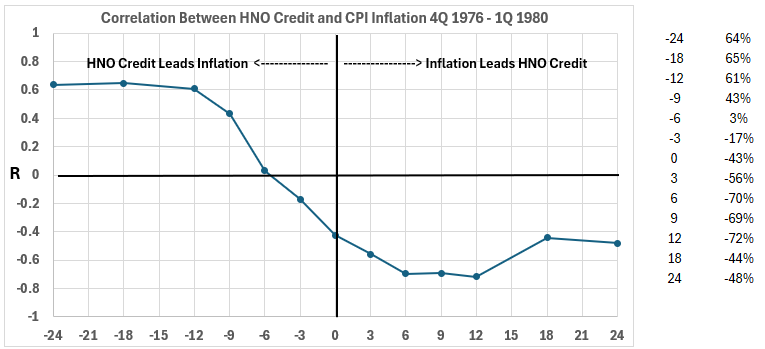
Figure 3. Correlation of Nonfinancial Corporate Credit with CPI 1976-80
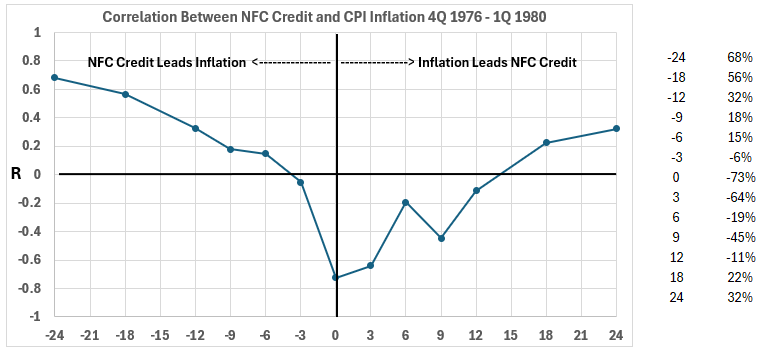
Figure 4. Correlation of M2 Money Supply with CPI 1976-80
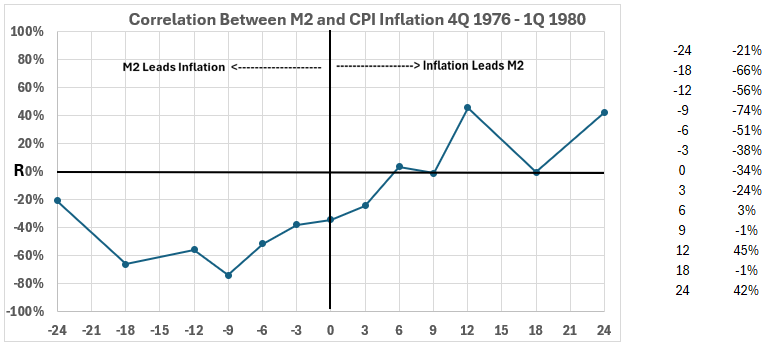
The charts above show correlations with positive and negative timeline offsets up to 24 months for quarterly changes in the two variables specified. (Note: Figures 2 and 3 show R in decimals, while Figure 4 has a percentage format.) The coincident timeline data has zero offsets.
We are interested in the associations between inflation changes and previously occurring (and coincident) quantity of money changes. These data points are on the left side of the graphs. Similar positive associations with inflation are also shown for mortgage and financial sector debt changes. Only federal deficit spending negatively correlates with inflation, similar to the M2 money supply.
This suggests the possibility that confounding may be affecting some or all of the positive correlations.
Evaluation and Ranking of Dissimilar Correlation Patterns
Sometimes, we see patterns containing positive and negative associations in a correlation graph. For examples, see Figures 5 and 6 below.
Figure 6. Correlation of Household and Nonprofit Credit with CPI 2009-11
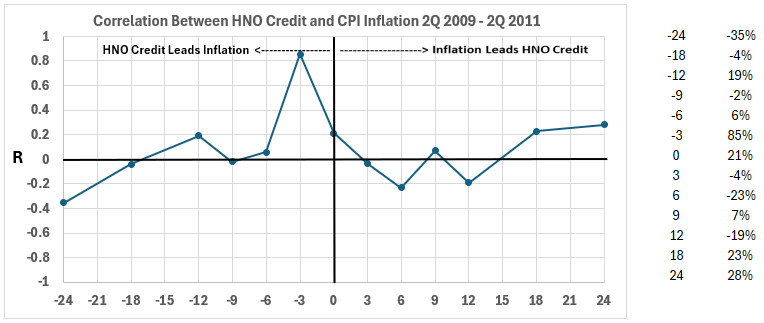
Figure 6. Correlation of Nonfinancial Corporate Credit with CPI 2009-11
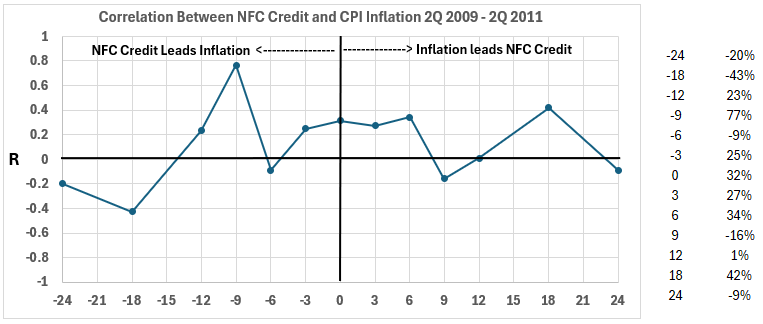
Consider the problem of determining the rank order of these two graphs for the relative positive association of the changes in credit with subsequent inflation (left side of graphs). The HNO credit (Figure 5) has a higher correlation point (85%). The NFC credit high point is 77%. Should this be the controlling factor in determining which has a higher association ranking in the 2009-11 inflation surge?
A reasonable interpretation of the results is that each data point contributes the indicated amount to the correlation at a given time. The -24 months data point specifies the contribution of the source of money quantity change correlation 24 months earlier to the inflation change. The same applies to the other data points across the left side of the graph, including zero. Thus, the relative association for HNO credit in this period is -35 – 4 +19 -2 +6 +85 +21 = 90. The relative association for NFC credit is -20 – 43 + 23 + 77 – 9 +25 + 32 = 85.
This means that for the 2009-11 period, HNO credit changes had a slightly higher positive association ranking with subsequent inflation than NFC changes.
What is a Meaningful Model for Money Quantity Relationships to Inflation?
We have used a linear model, which is common when considering the causes of inflation. But what if the relationship is complex? Here is a list of factors that might be included in a complex model:
- When a dollar is spent on an item in CPI, it can be spent again. And again. Thus, the increase of one dollar in the quantity of money may have a more significant effect on spending due to the multiplier effect.
- As inflation increases, demand may decrease. This could produce a negative effect on inflation.
- As the prices rise during inflation, supply can increase as producers respond to the higher prices.
So, a model recognizing this complexity might be structured thus:
I(t) ∝ S(t) + M(t) – f(t) + g(t)
where
- I(t) = Inflation (varying over time)
- S(t) = Quantity of Money (varying over time)
- f(t) = Change in Demand (varying over time)
- g(t) = Change in Supply (varying over time)
This type of model is beyond the scope of the present effort. It is presented conceptually to emphasize that this is an ultimate objective down the road.
Conclusion
To better understand inconsistencies in the results obtained in the study of correlations between various sources of money changes and inflation, we need to determine if confounding can be responsible. We will present work on that next week.
Once the confounding question is understood, we will develop a ranking of associations between the quantity of money changes and inflation in subsequent weeks.
Read Part 2 >>> Quantity Of Money And Inflation - Part 2: Confounding
Read Part 3 >>> Quantity Of Money And Inflation - Part 3: More About Confounding
For the foreseeable future, we will continue to use the linear model.
Footnotes
1. Lounsbury, John, “Government Spending and Inflation. Reprise and Summary,” EconCurrents, August 20, 2023. https://econcurrents.com/2023/08/20/government-spending-and-inflation-reprise-and-summary/.
2. Lounsbury, John, “Consumer Spending and Inflation. Part 4,” EconCurrents, September 23, 2023. https://econcurrents.com/2023/09/23/consumer-credit-and-inflation-part-4/.
3. Lounsbury, John, “Mortgage Debt and Inflation. Part 4,” EconCurrents, October 22, 2023. https://econcurrents.com/2023/10/22/mortgage-debt-and-inflation-part-4/.
4. Lounsbury, John, “Nonfinancial Corporate Credit. Part 4,” EconCurrents, March 3, 2024. https://econcurrents.com/2024/03/03/nonfinancial-corporate-credit-and-inflation-part-4/.
5. Lounsbury, John, “Financial Sector Debt and Inflation. Part 4,” EconCurrents, March 31, 2024. https://econcurrents.com/2024/03/31/financial-sector-debt-and-inflation-part-4/.
6. Lounsbury, John, “Federal Deficit Spending (Quarterly) and Inflation. Part 4,” EconCurrents, April 28, 2024. https://econcurrents.com/2024/04/28/federal-deficit-spending-quarterly-and-inflation-part-4/.
7. Lounsbury, John, “M2 Money Supply and CPI Inflation. Part 4,” EconCurrents, June 30, 2024. https://econcurrents.com/2024/06/30/m2-money-supply-and-cpi-inflation-part-4/.
8. Federal Reserve Economic Data, Consumer Price Index for All Urban Consumers: All Items in U.S. City Average, Index 1982-1984=100, Monthly, Not Seasonally Adjusted. https://fred.stlouisfed.org/graph/?id=CPIAUCNS.
9. Freedman, David, Pisani, Robert, Purves, Robert, “Statistics, Fourth Edition,” W.W. Norton & Company, New York; Viva Books, New Delhi, 2009. Chapter 2, Observational Studies.
More By This Author:
M2 Money Supply and CPI Inflation - Part 4
M2 Money Supply and CPI Inflation - Part 3
M2 Money Supply and CPI Inflation - Part 2


Comments
Log in or sign up to join the conversation.