
Read Part 1 >>> Quantity of Money and Inflation - Part 1: General Considerations
Confounding can be an issue in analyzing the association between quantities of money and inflation. In this article, we look more closely at a possible example of confounding.

Photo by Daniele Levis Pelusi on Unsplash.
Introduction
Previously,1 we suggested that two possible examples of confounding existed:
- The correlation of changes in nonfinancial corporate debt (NFC) with CPI inflation during the inflation surge of 1976-80 might be confounded by changes in household and nonprofit organization debt (HNO).
- The correlation of changes in household and nonprofit organization debt (HNO) with CPI inflation during the inflation surge of 1976-80 might be confounded by changes in nonfinancial corporate debt (NFC)).
The two statements above may sound confusing. Let’s define the relationships with a generalized diagram for two variables (A and B), each correlated with a third (C) and associated with each other.
Figure 1. Three Variable Correlations
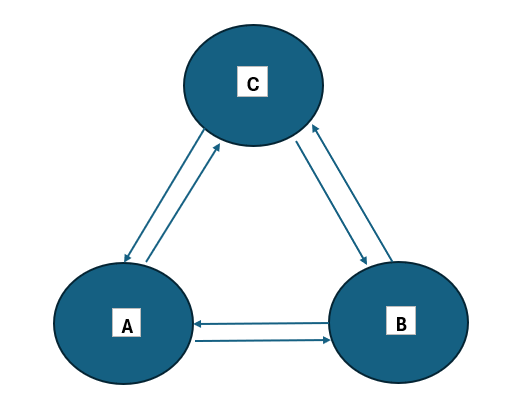
The possible associations are indicated with arrows. Arrows operate in opposing directions because changes in A might be associated with subsequent changes in B and vice versa. The magnitudes of the arrows are determined by offsetting two data timelines to reflect which variable changes occur first. When changes in A occur before measured changes in B, A shows a possible cause of change in B. In such a case, changes in A are associated with subsequent changes in B. However, the changes in A may not be causing the changes in B; the association may be partially or entirely circumstantial.
In the previous post, we suggested that changes in NFC might confound the results for associations between HNO and CPI changes. In Figure 1, substitute A = NFC, B = HNO, and C = CPI. The observed value of the correlation between HNO and CPI may include a “pass-through” from a correlation between NFC and HNO. If that happens, NFC will confound the association between HNO and CPI.
Data
The correlations with timeline offsets are used to evaluate the possible confounding of HNO associations with CPI by NFC and vice versa. These tables are set up like they were for correlations between credit changes and CPI. See the tables for HNO and CPI,2, for example.
The growth data for NFC is in Appendix 1, and for HNO, Appendix 2.
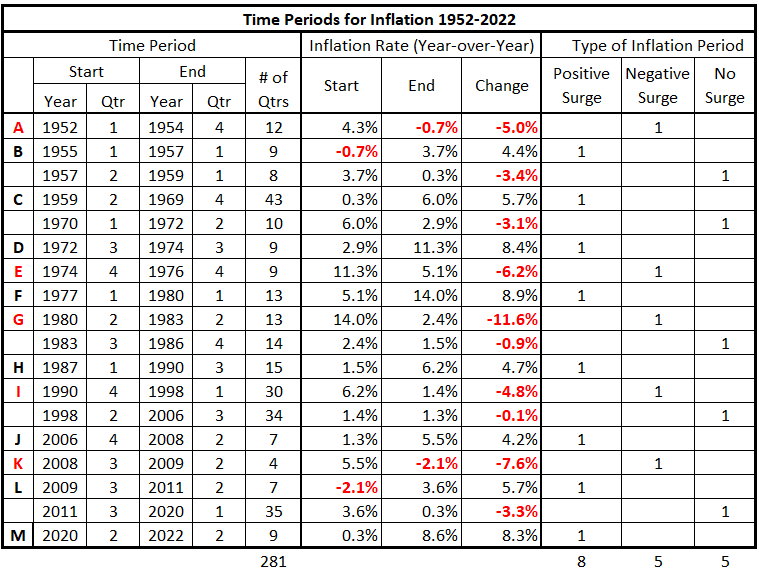
Periods for Inflation
The timeline for inflation behavior is the same as used previously.2
Table 1. Timeline of Inflation Data 1952-2022
Timelines for Changes in NFC Credit Growth and HNO
As in previous posts in this series, there are 13 quarterly timeline alignments:
- NFC and HNO quarters are coincident.
- NFC changes lead and lag HNO changes by one quarter (±3 months)
- NFC changes lead and lag HNO changes by two quarters (±6 months)
- NFC changes lead and lag HNO changes by three quarters (±9 months)
- NFC changes lead and lag HNO changes by four quarters (±12 months)
- NFC changes lead and lag HNO changes by six quarters (±18 months)
- NFC changes lead and lag HNO changes by eight quarters (±24 months)
Timelines Offset Tables
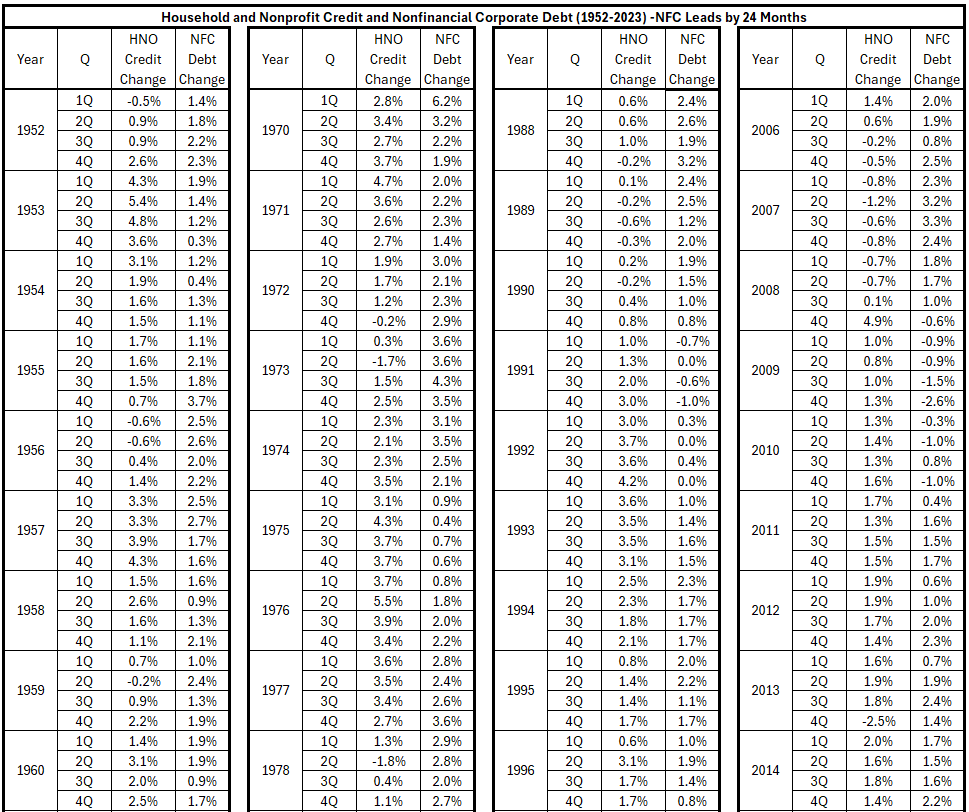
Table 2. HNO and NFC Quarterly Credit Growth Changes, Coincident Data, 1952-2023*
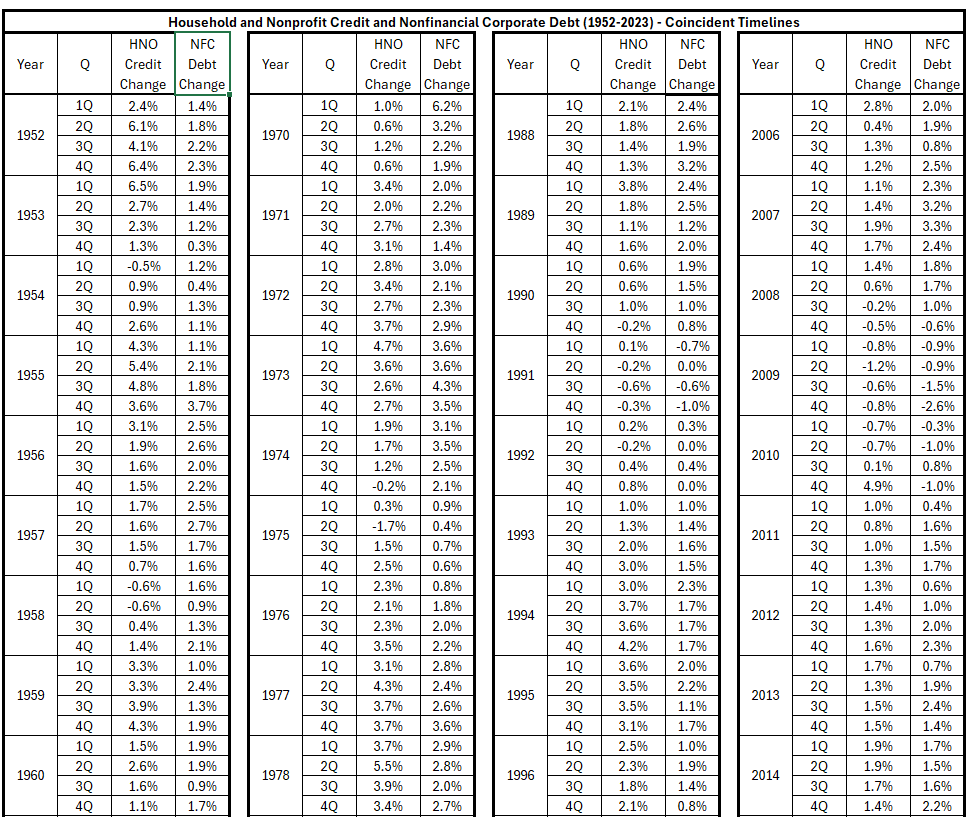

Table 3. NFC and HNO Quarterly Credit Growth Changes, HNO Leads by 3 Months, 1952-2023*
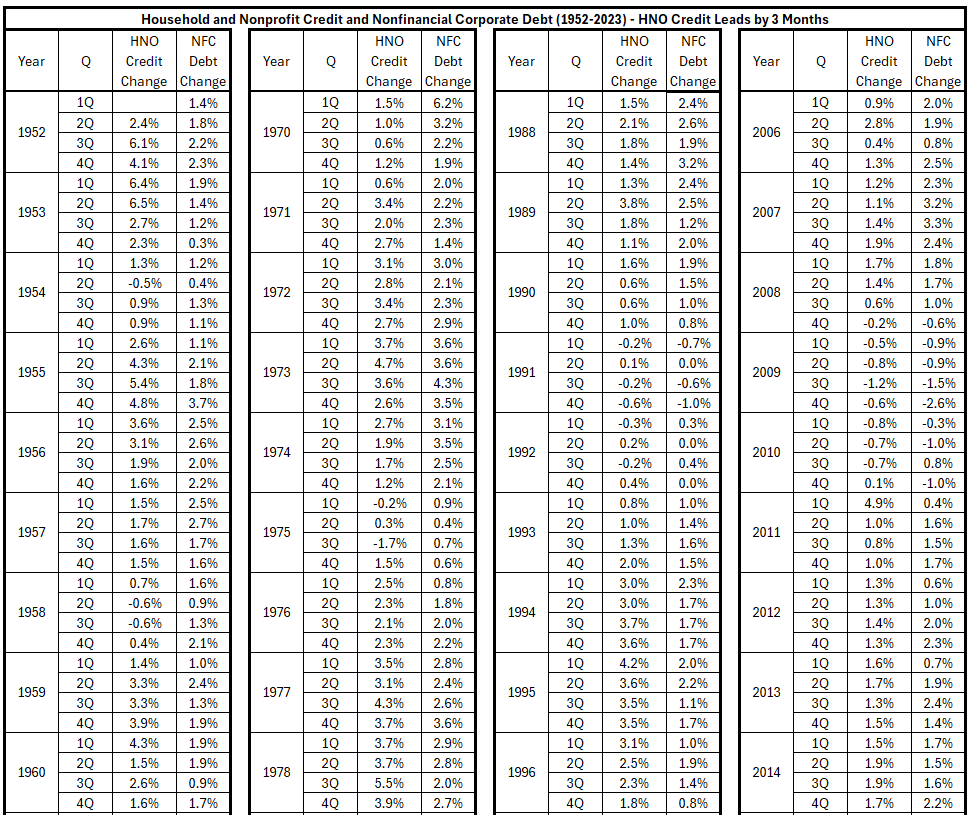
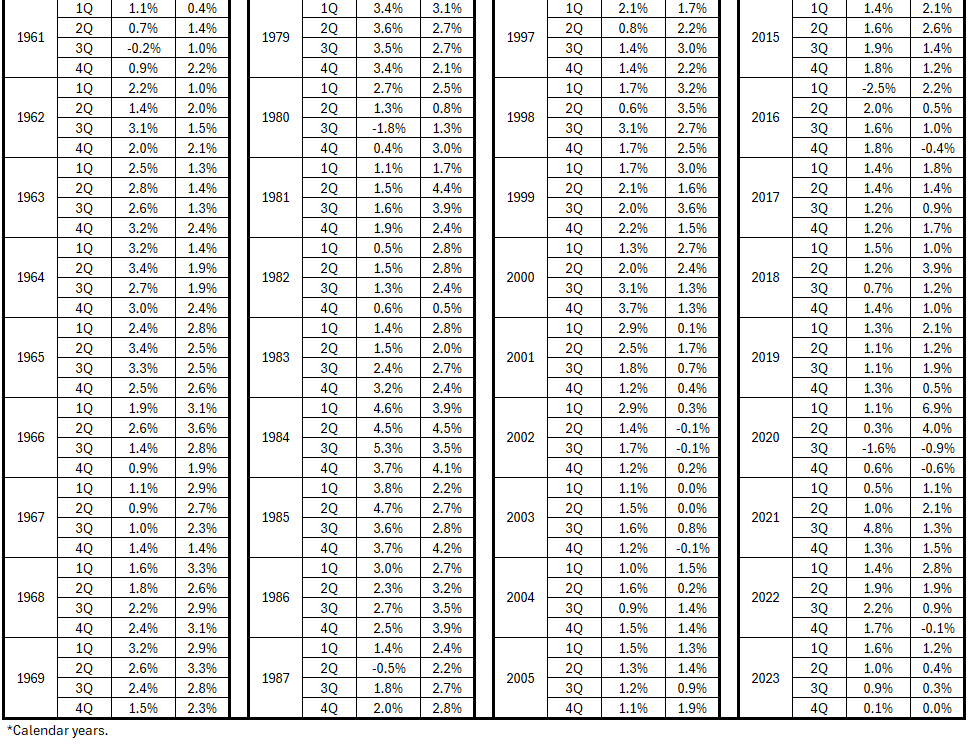
Table 4. NFC and HNO Quarterly Credit Growth Changes, HNO Leads by 6 Months, 1952-2023*
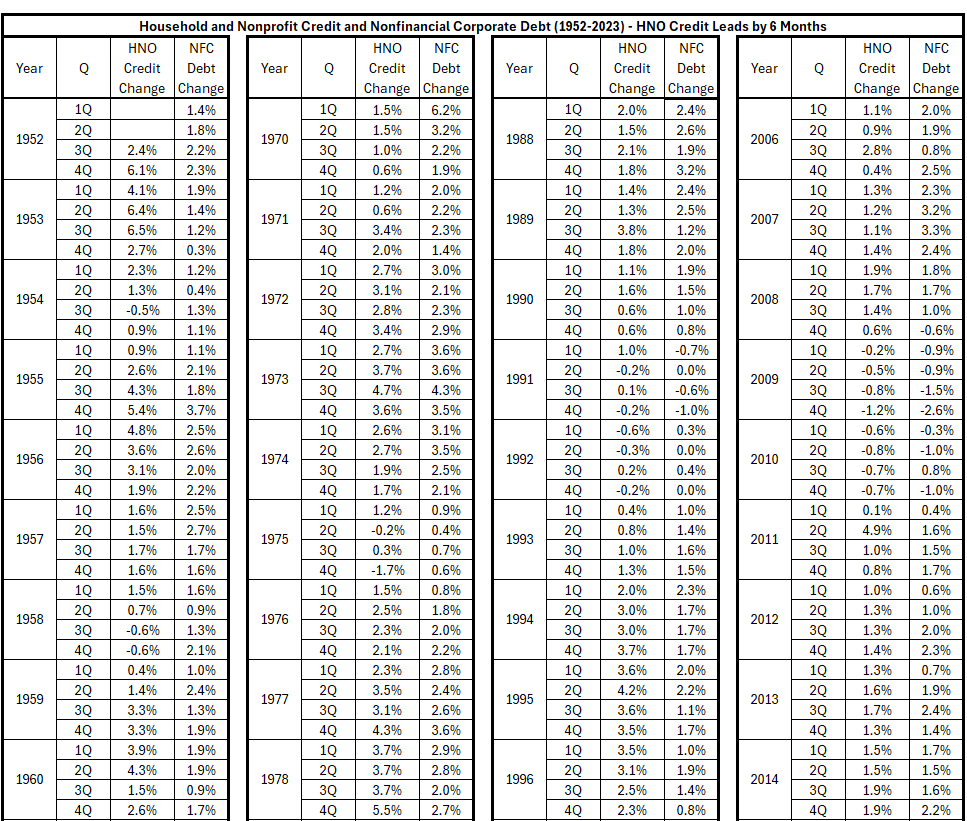
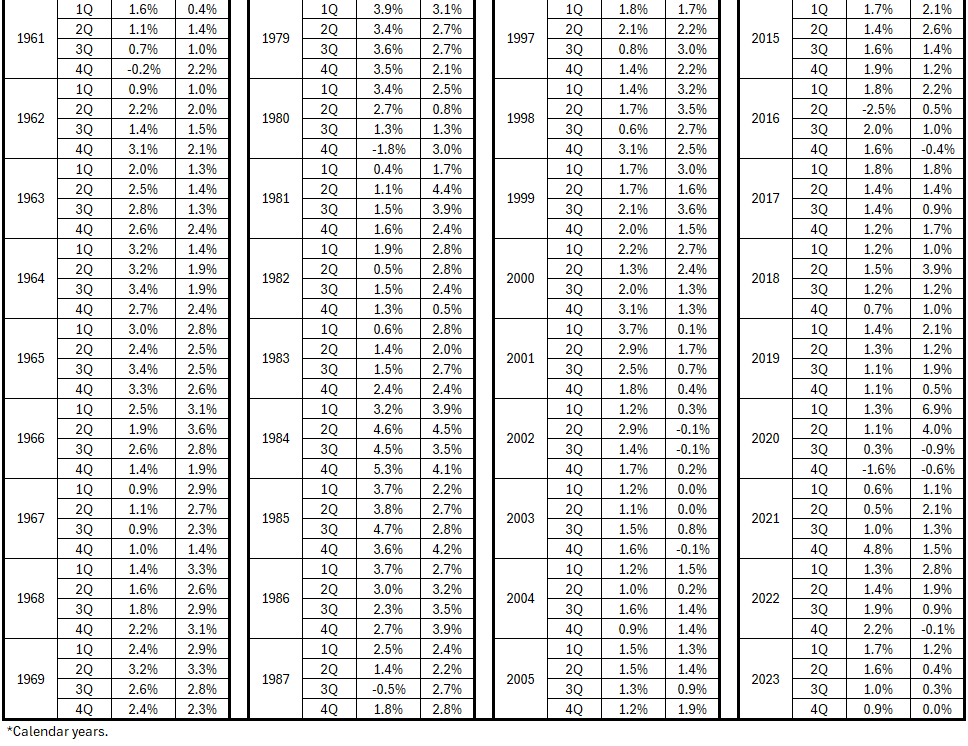
Table 5. NFC and HNO Quarterly Credit Growth Changes, HNO Leads by 9 Months, 1952-2023*
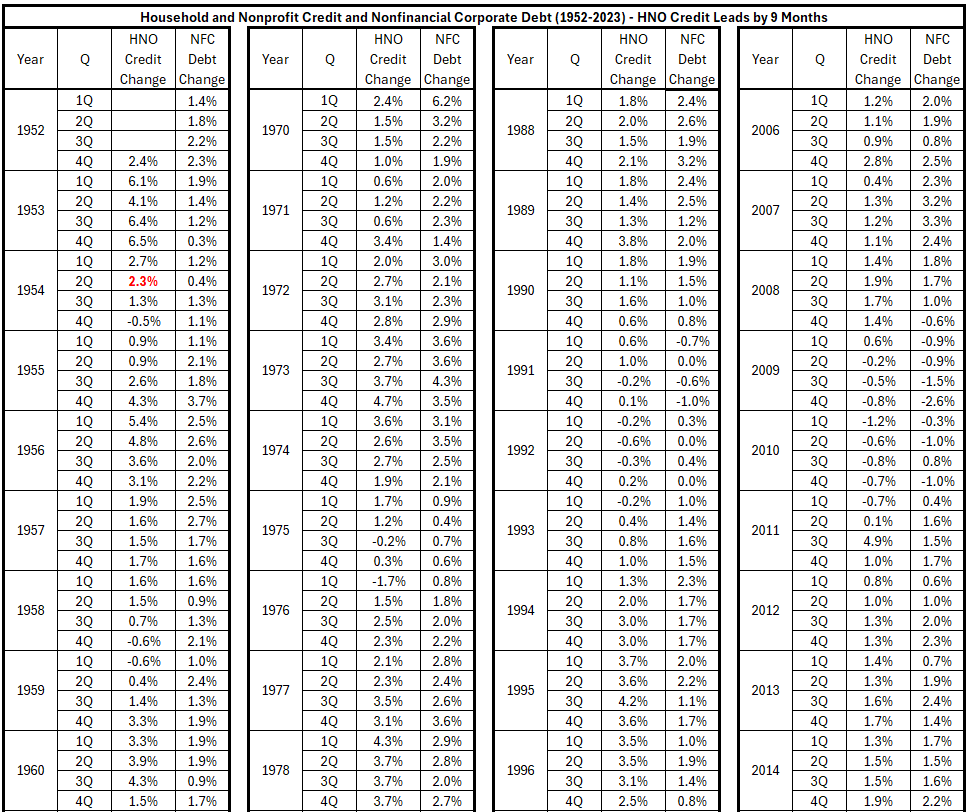
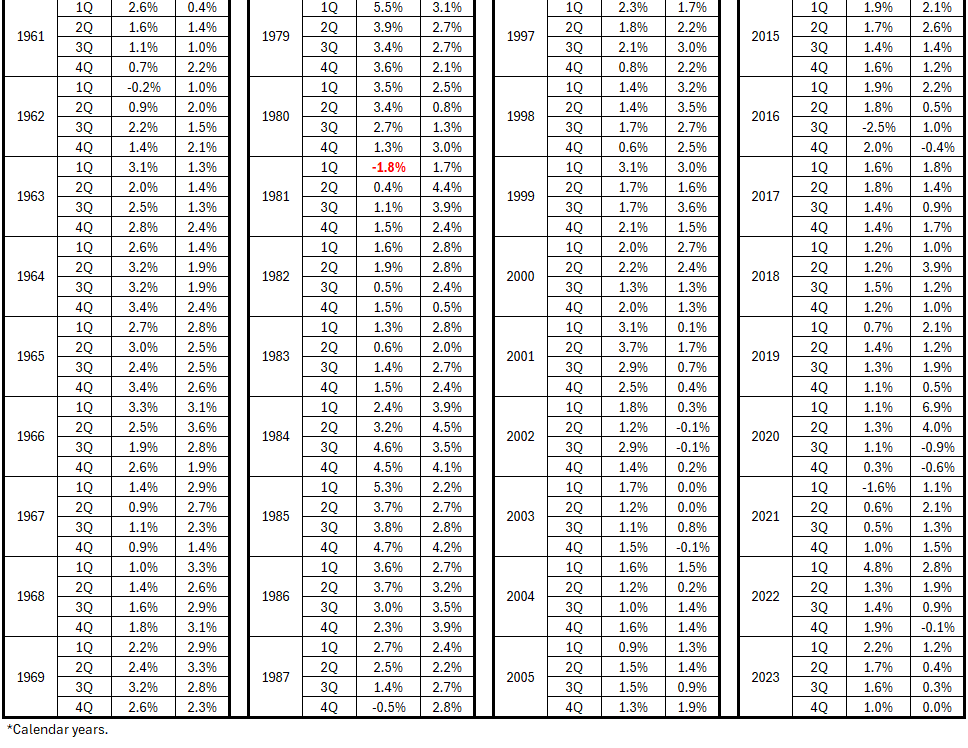
Table 6. NFC and HNO Quarterly Credit Growth Changes, HNO Leads by 12 Months, 1952-2023*
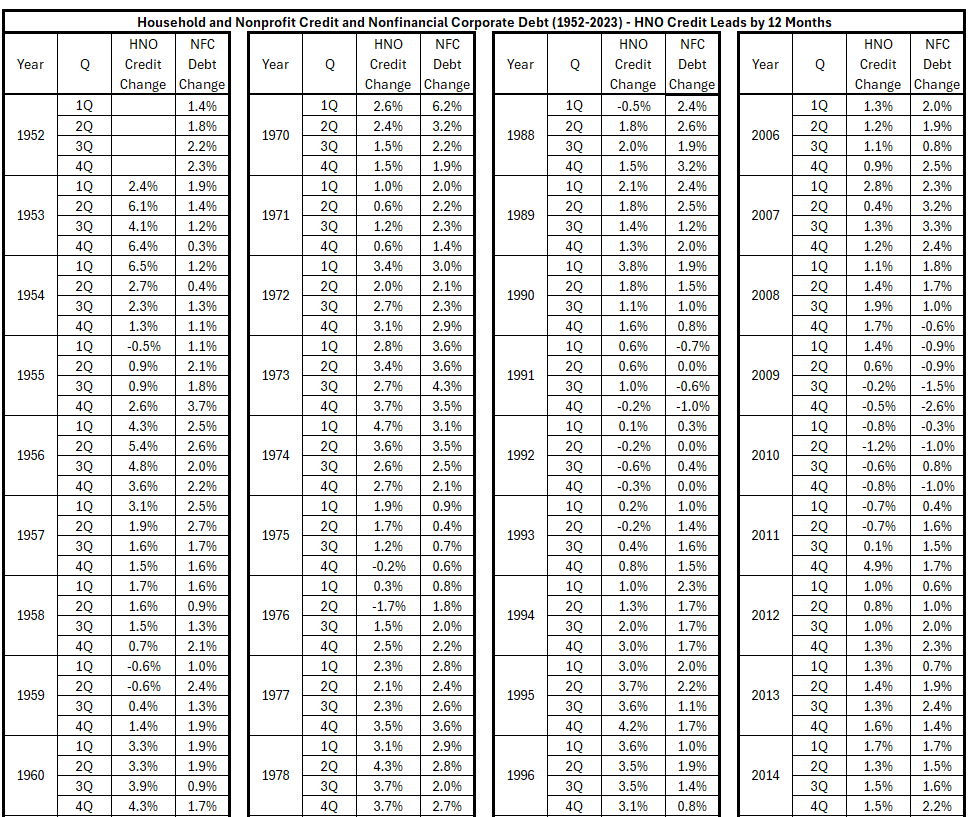

Table 7. NFC and HNO Quarterly Credit Growth Changes, HNO Leads by 18 Months, 1952-2023*


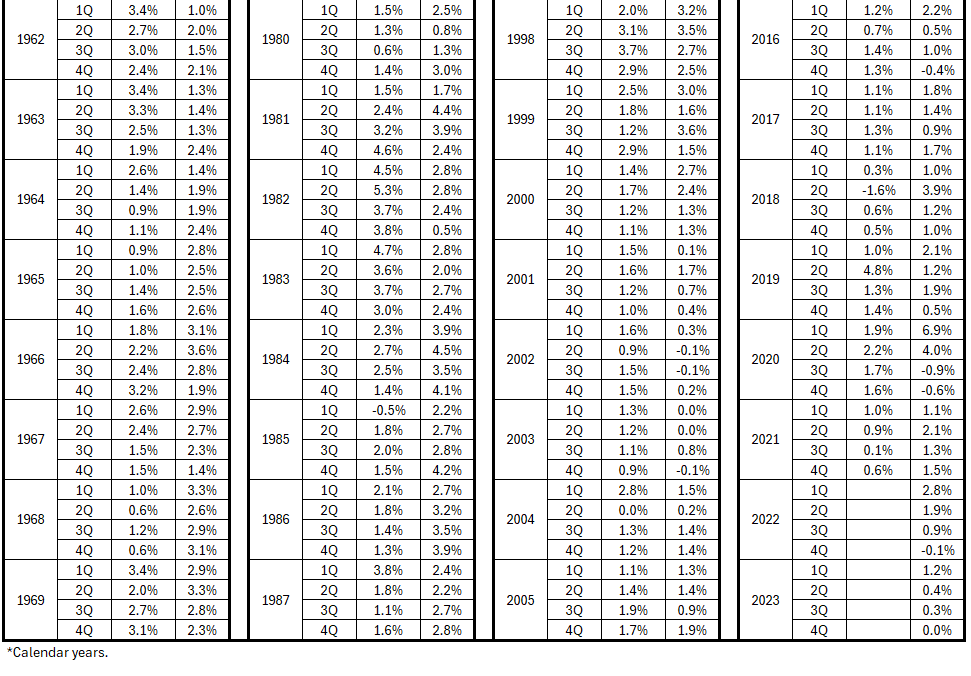
Table 8. NFC and HNO Quarterly Credit Growth Changes, HNO Leads by 24 Months, 1952-2023*
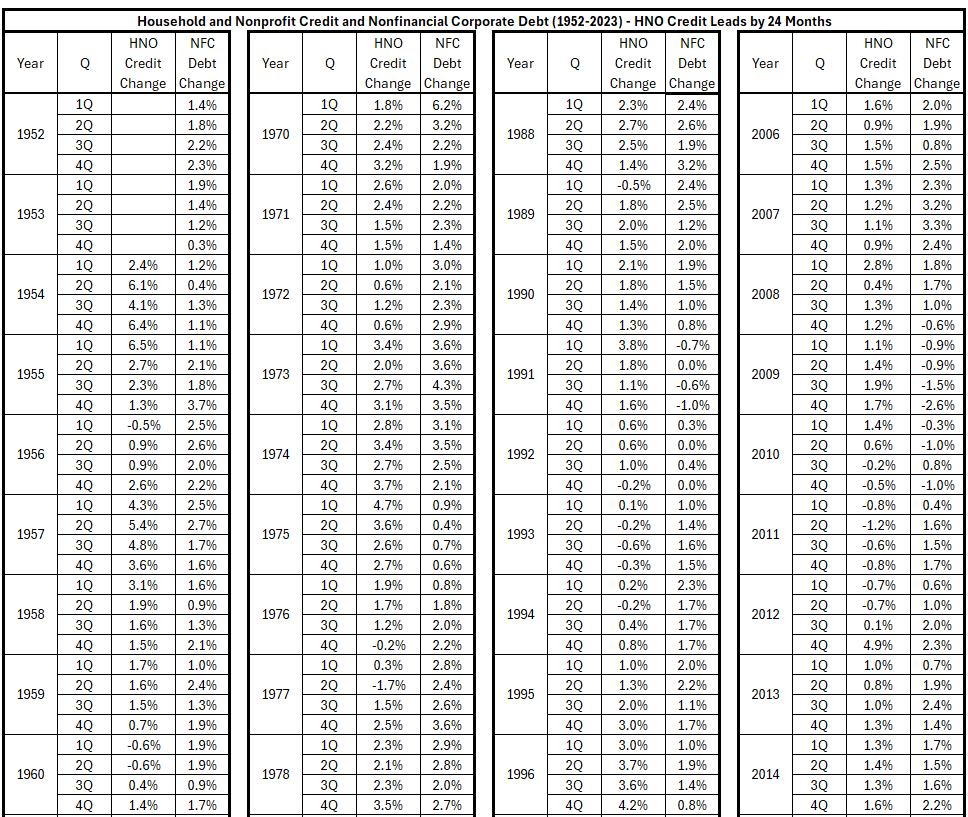
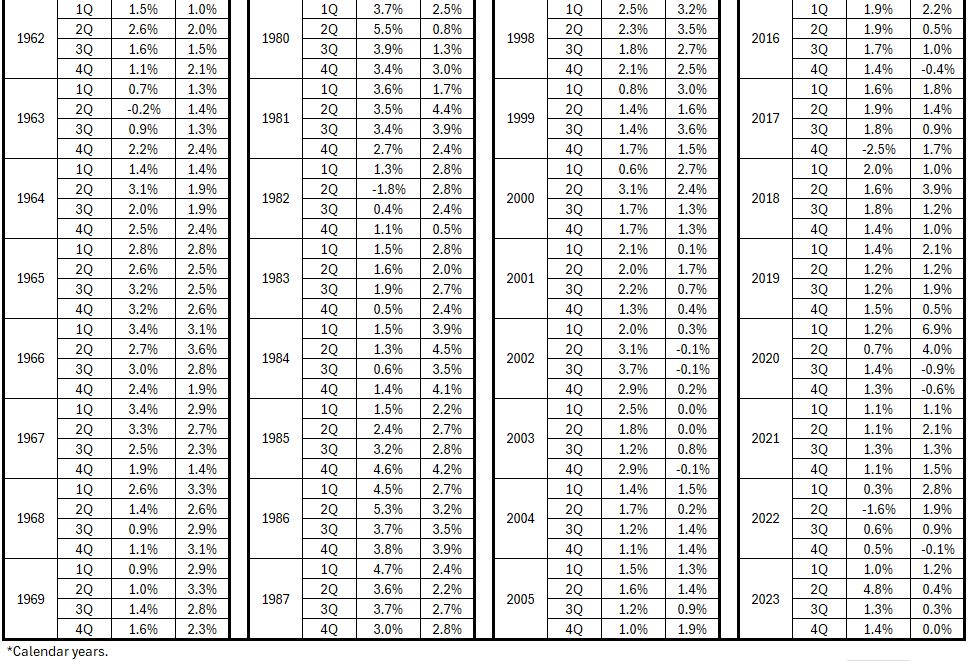
Table 9. NFC and HNO Quarterly Credit Growth Changes, HNO Lags by 3 Months, 1952-2023*
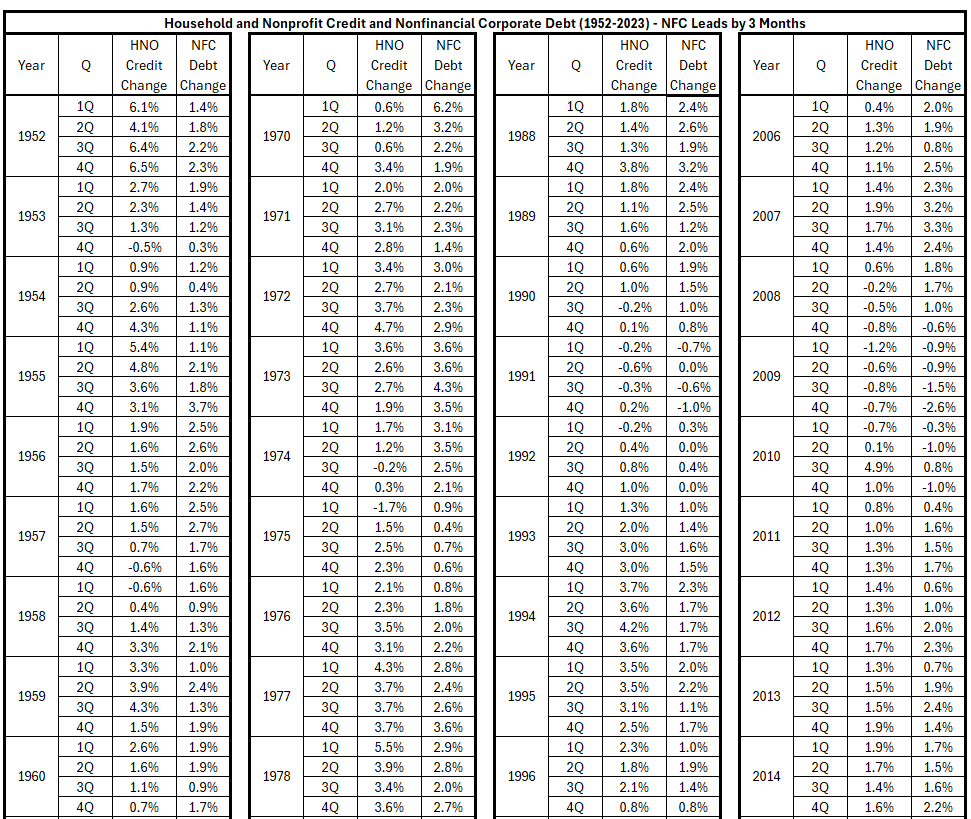
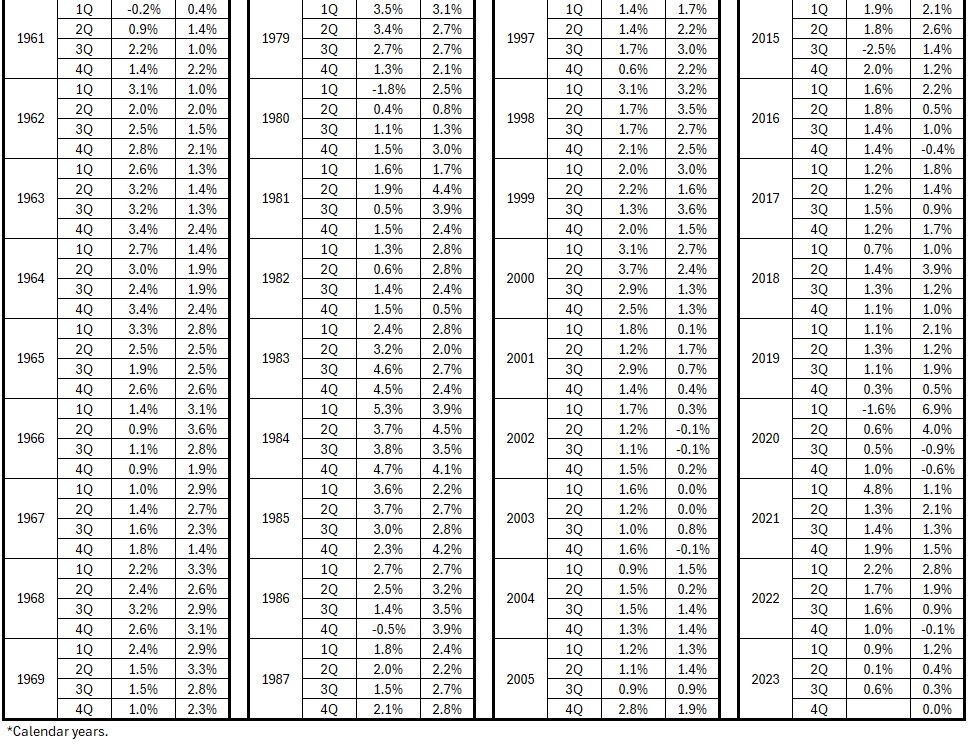
Table 10. NFC and HNO Quarterly Credit Growth Changes, HNO Lags by 6 Months, 1952-2023*
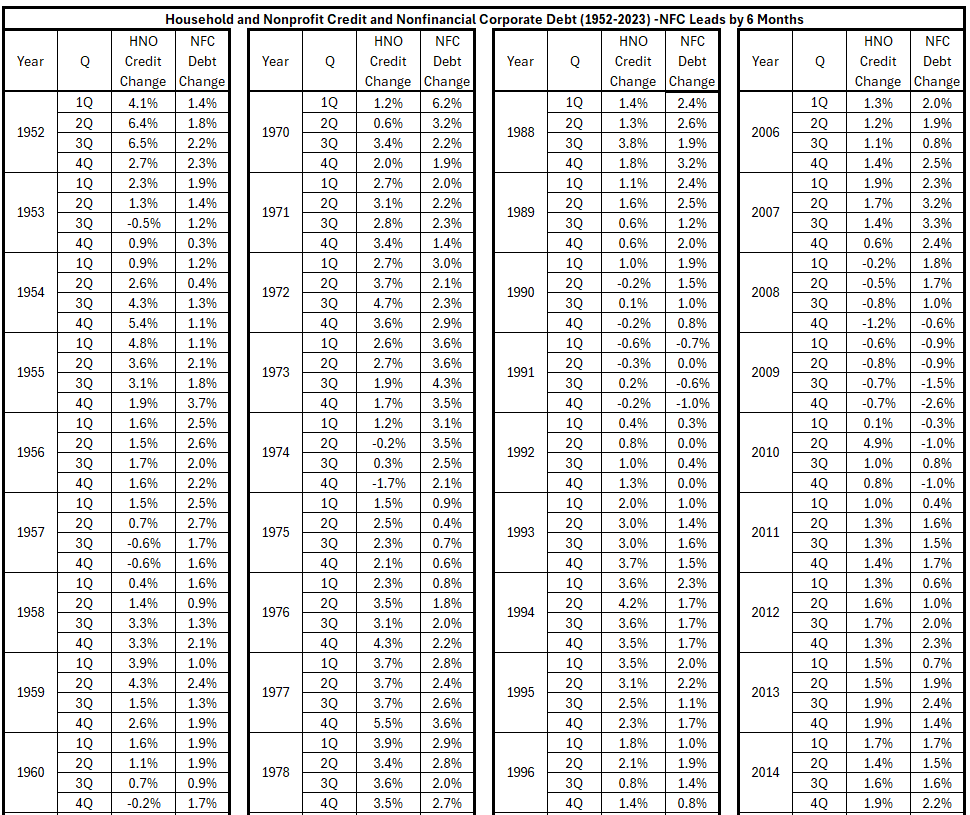
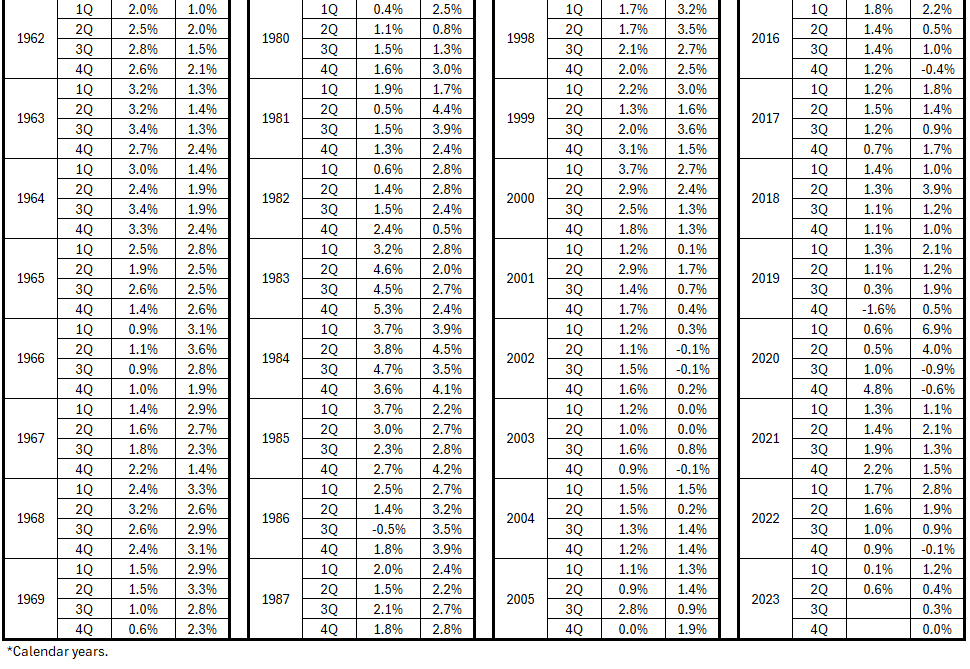
Table 11. NFC and HNO Quarterly Credit Growth Changes, HNO Lags by 9 Months, 1952-2023*
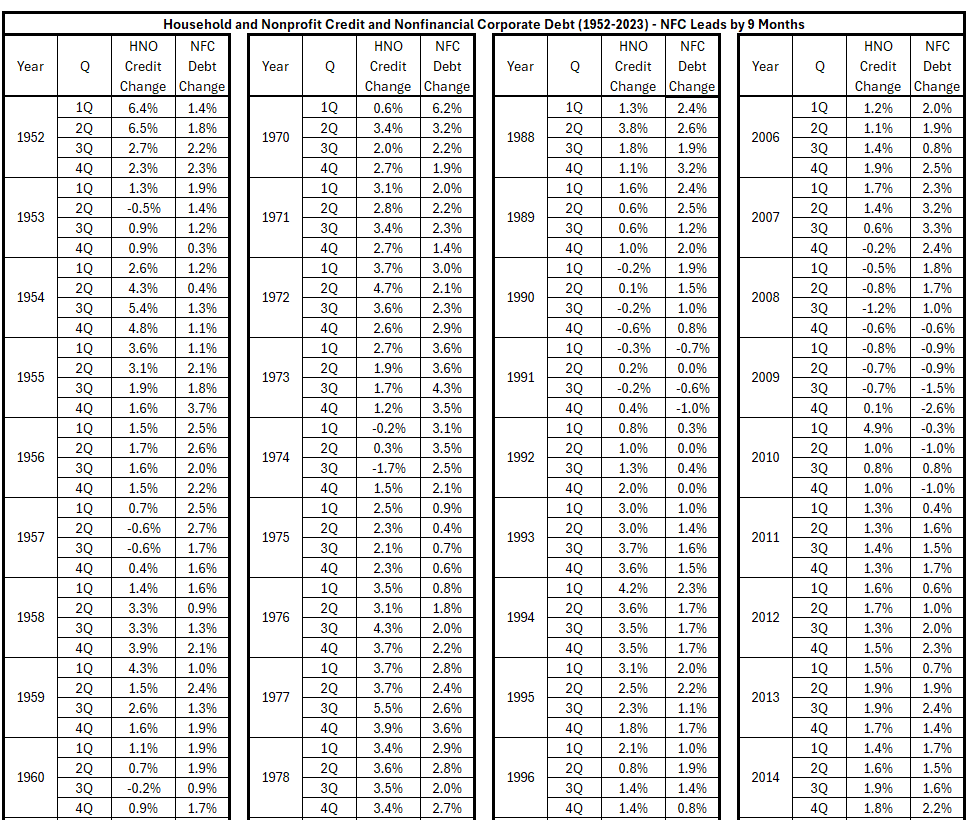

Table 12. NFC and HNO Quarterly Credit Growth Changes, HNO Lags by 12 Months, 1952-2023*
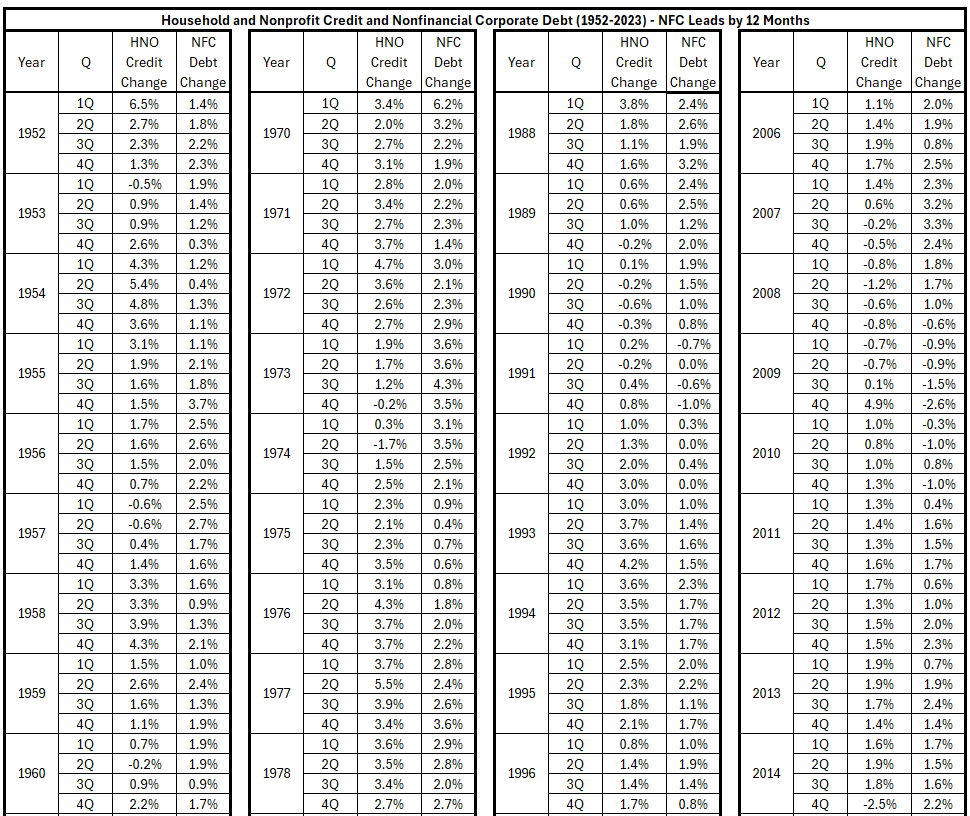
Table 13. NFC and HNO Quarterly Credit Growth Changes, HNO Lags by 18 Months, 1952-2023*
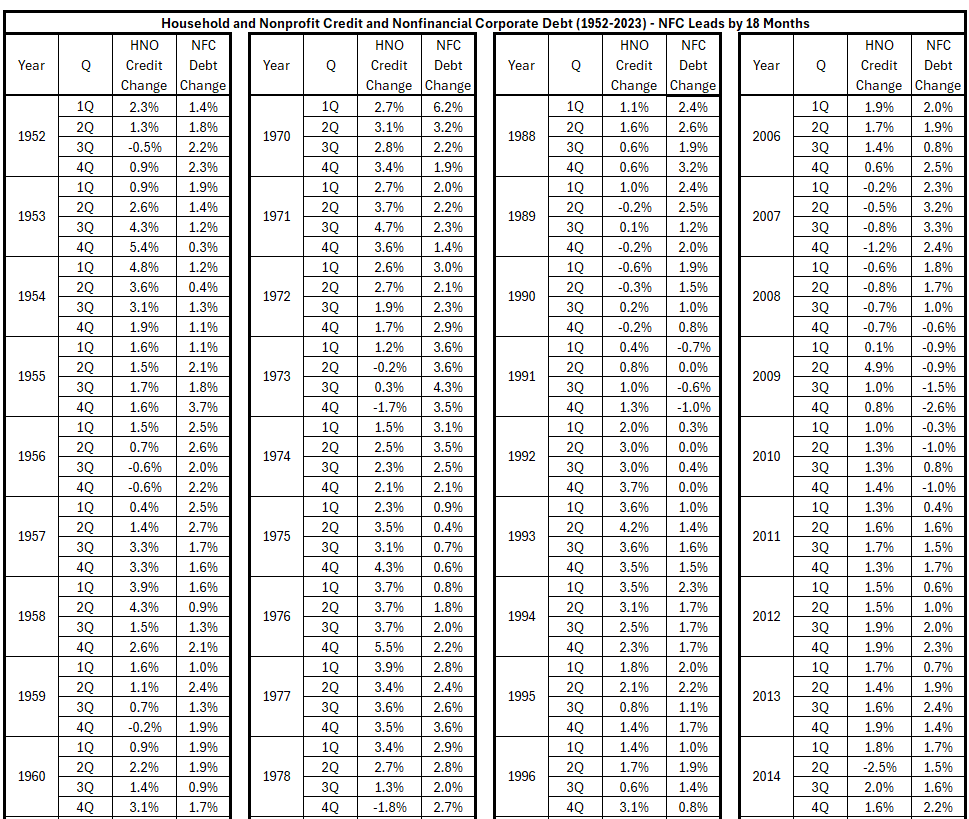
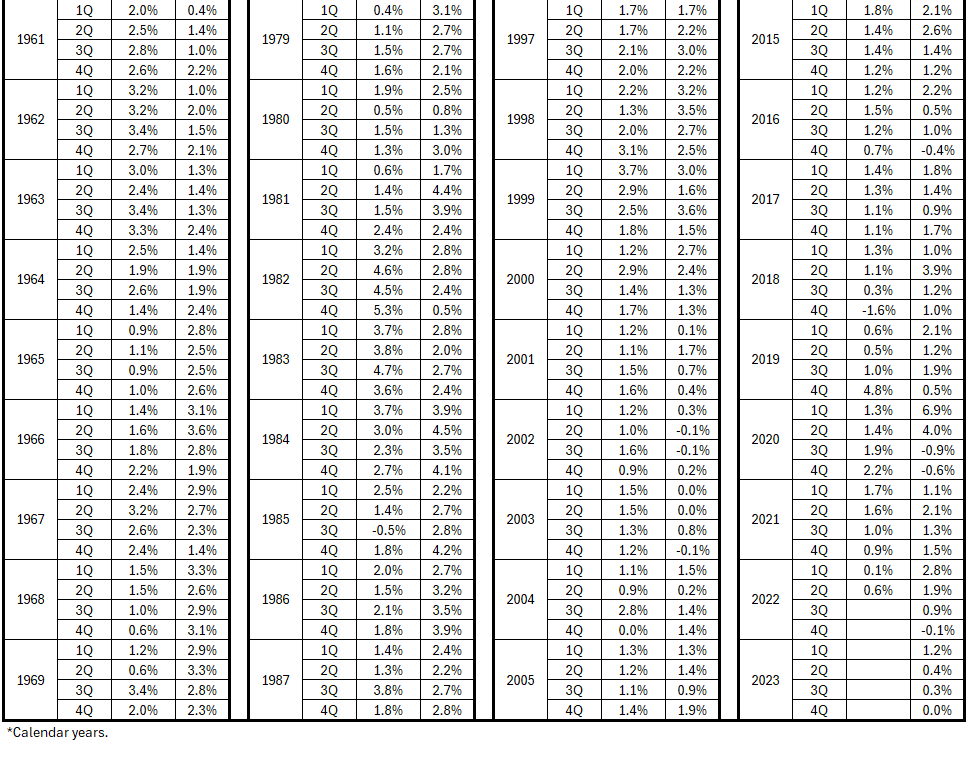
Table 14. NFC and HNO Quarterly Credit Growth Changes, HNO Lags by 24 Months, 1952-2023*
Analysis
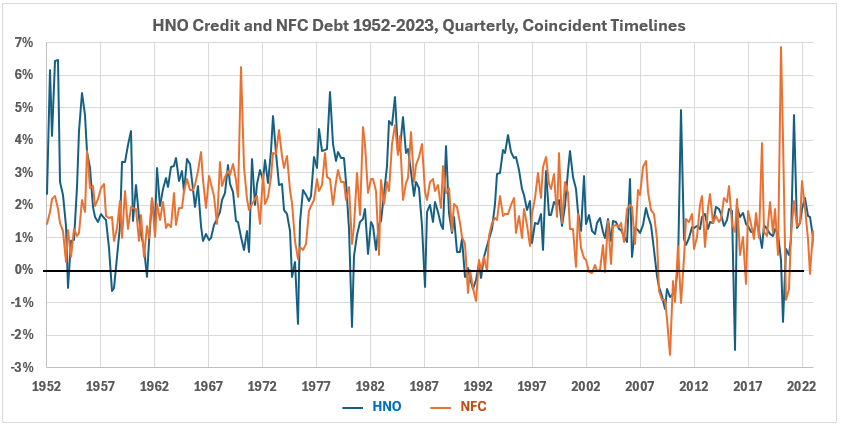
In Figure 2, we see times when the two variables change together and other times when they change in opposite directions. There are also times when the changes are random. Over the long 72-year time frame, the two patterns show variable patterns of positive and negative correlation mixed with no discernible associations.
Figure 2. Quarterly Changes – NFC Debt and HNO Credit 1952-2023
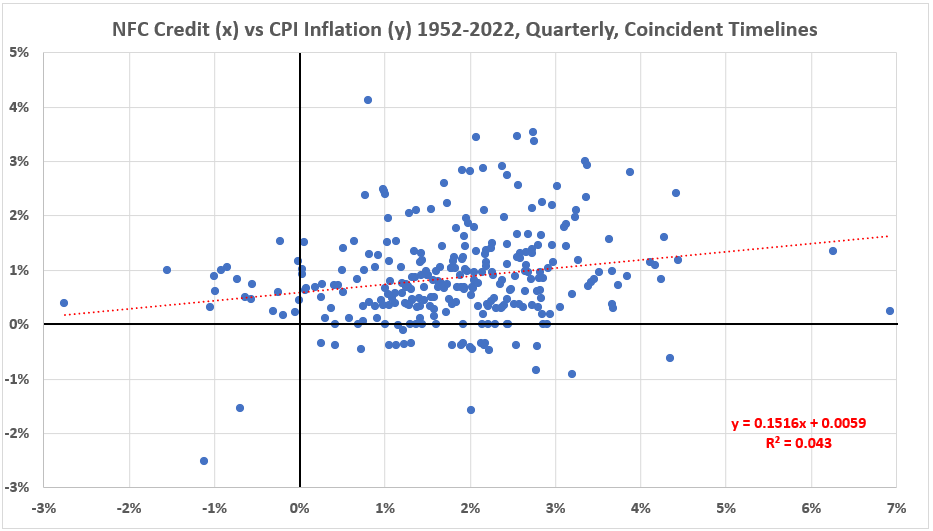
A scatter plot of the quarterly data with coincident timelines for the two variables (Figure 3) indicates a weak correlation ( R2 = 4.3%, R = 20.7%). This data shows a desirable oval football shape5 for the data points with few outliers, so the result should be considered reliable.
Figure 3. Scatter Diagram for NFC Debt – HNO Credit Data Pairs 1952-2022, Coincident Timelines
Is there Confounding of Associations in the 1976-80 Inflation Surge?
Previously, it was suggested that confounding may occur when FNC and HNO are associated with CPI. See Introduction for details. From Part 1:
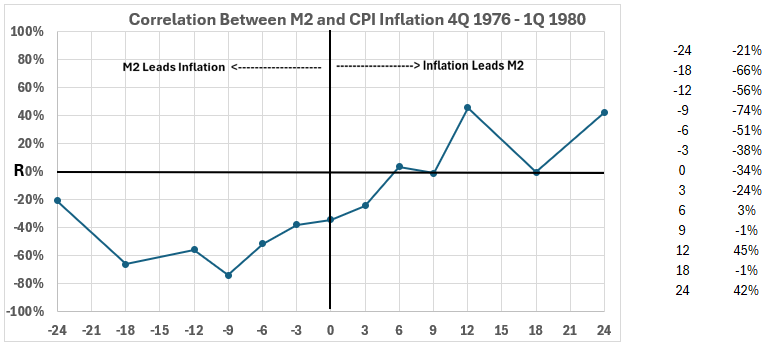
These studies yield some puzzling results. One primary concern is that the associations (correlations) for the M2 money supply with inflation are sometimes much smaller (or negative) than some credit sources contributing to M2. An example of this is the inflationary surge of 1976-80. See the three figures below.
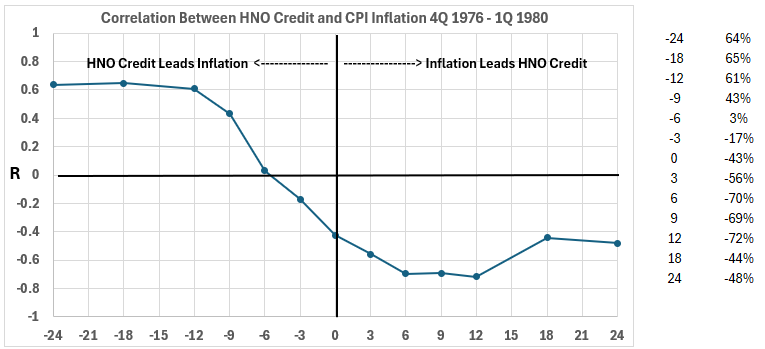
Figure 2. Correlation of Household and Nonprofit Credit with CPI 1976-80
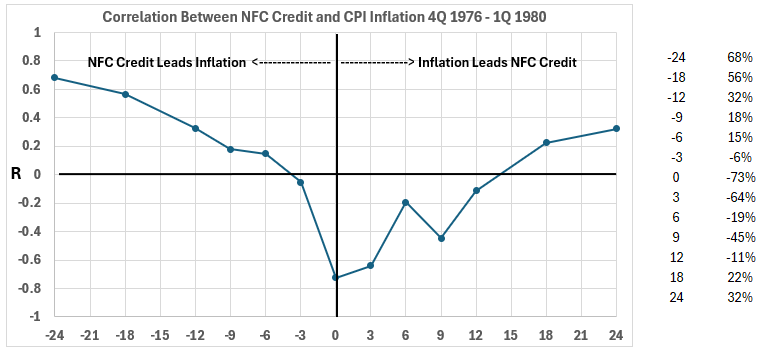
Figure 3. Correlation of Nonfinancial Corporate Credit with CPI 1976-80
Figure 4. Correlation of M2 Money Supply with CPI 1976-80
If there are correlations between NFC and HNO during this time interval, then the associations of each with CPI may be inflated by confounding. In this post, we look for such an NFC-HNO association. Using data from the timeline offset tables above, the correlations are shown in Figure 4 below.
Figure 4. Correlation of NFC and HNO 1976-80
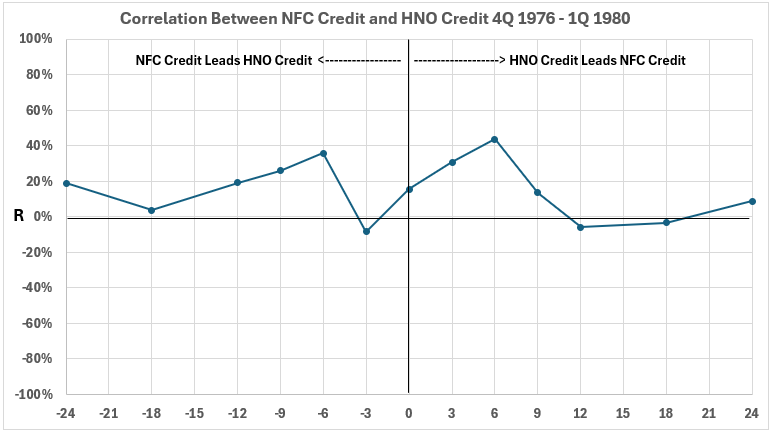
The correlations for NFC credit occurring after HNO credit (right side of Figure 4) are weak (the largest R = 44%, R2 = 19%). However, this is not insignificant compared to the association of NFC credit with inflation (Figure 3 from Part 1). The largest association there was R = 68%, R2 = 46%. Thus HNO may have confounded the result for NFC association with CPI. The association of NFC alone with CPI may be less than R = 68%, R2 = 46%.
On the left side of Figure 4, the largest correlation for HNO changes occurring after NFC changes is R = 36% and R2 = 13%. The largest association for HNO changes with CPI is R = 66% and R2 = 44%. Thus, though smaller than the case for HNO confounding the NFC result, there is possible confounding by NFC of the HNO changes association with CPI.
Conclusion
This study shows the possible confounding of associations between changes in quantities of money and inflation with an example. A summary of the confounding factors is in Figure 5.
Figure 5. Three Variable Correlations for HNO, NFC, and CPI 1976-80
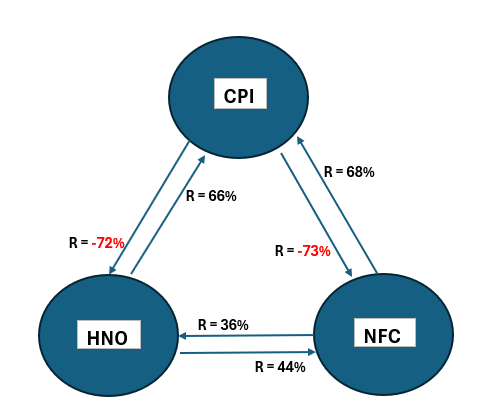
The associations displayed are from the analysis section of this post. They are the largest absolute value associations. The directions of the arrows point from the leading data to the lagging data: The arrow from CPI to HNO indicates that CPI changes preceded HNO changes for that data set.
The illustration here shows that confounding is possible for associations between quantity of money variables and CPI inflation. However, it does not prove that it happens. We are back to the old adage—correlation does not prove causation.
With this exercise in mind, we will attempt to rank various related associations next week. From now on, we need to remember that correlation does not necessarily relate to causation and that correlation may itself be confounded.
Appendix 1
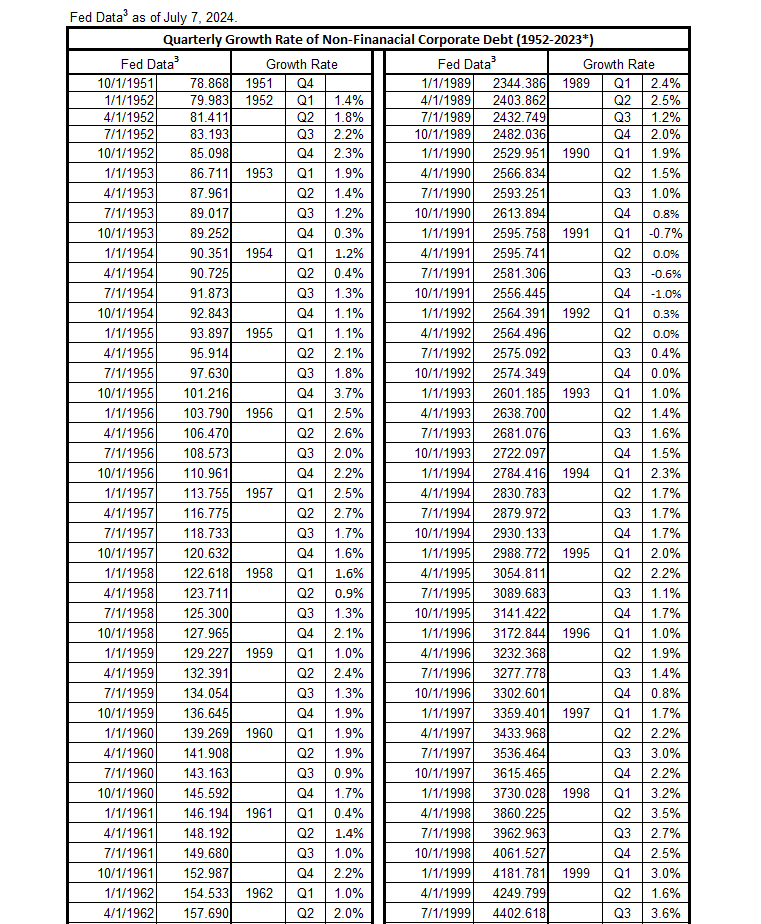
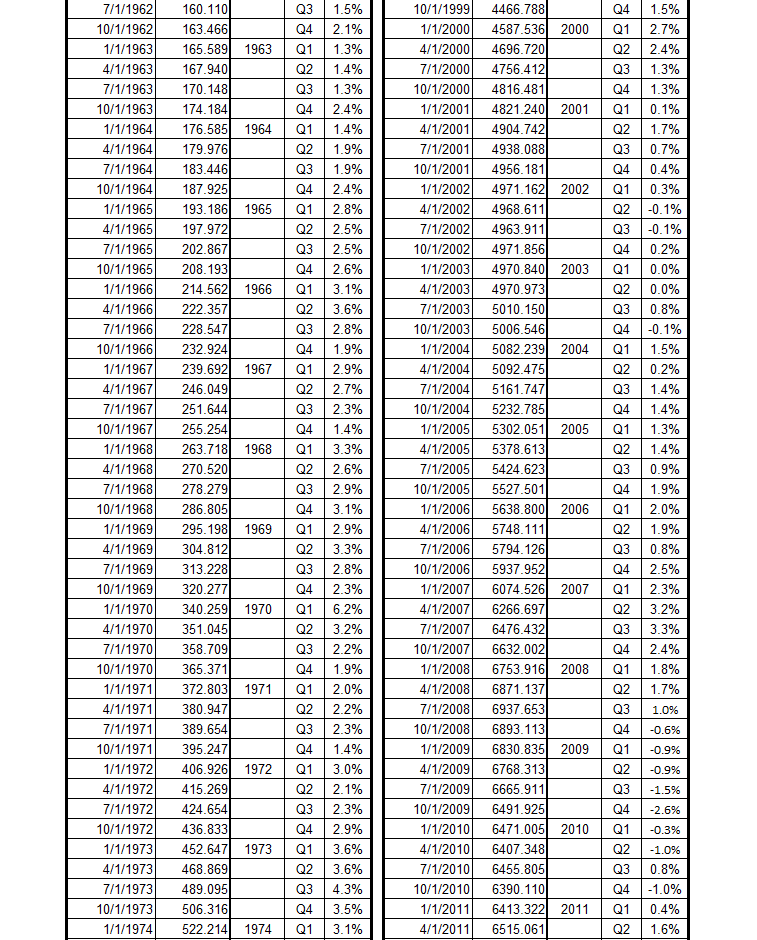
The Nonfinancial Corporate (NFC) Credit data is from the Fed database.3 The table below shows the conversion of the Fed data to growth rate by quarter.
Table A1. Growth Rate of NFC Credit 1952-2023* (Quarter-over-Quarter)
Appendix 2
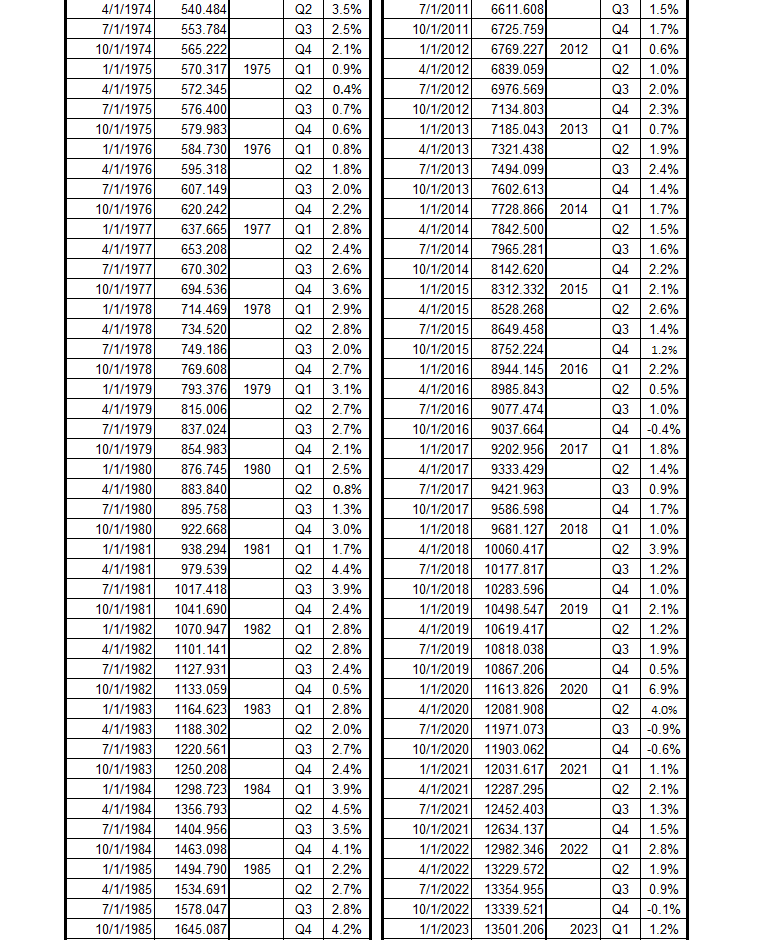
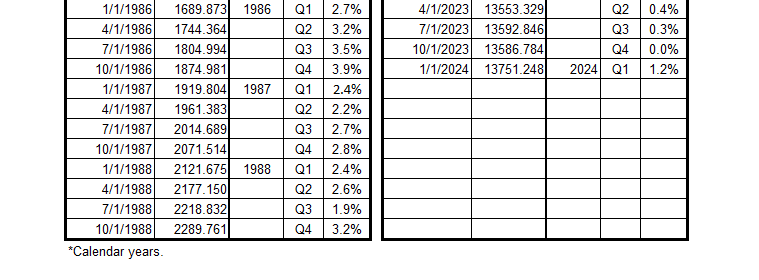
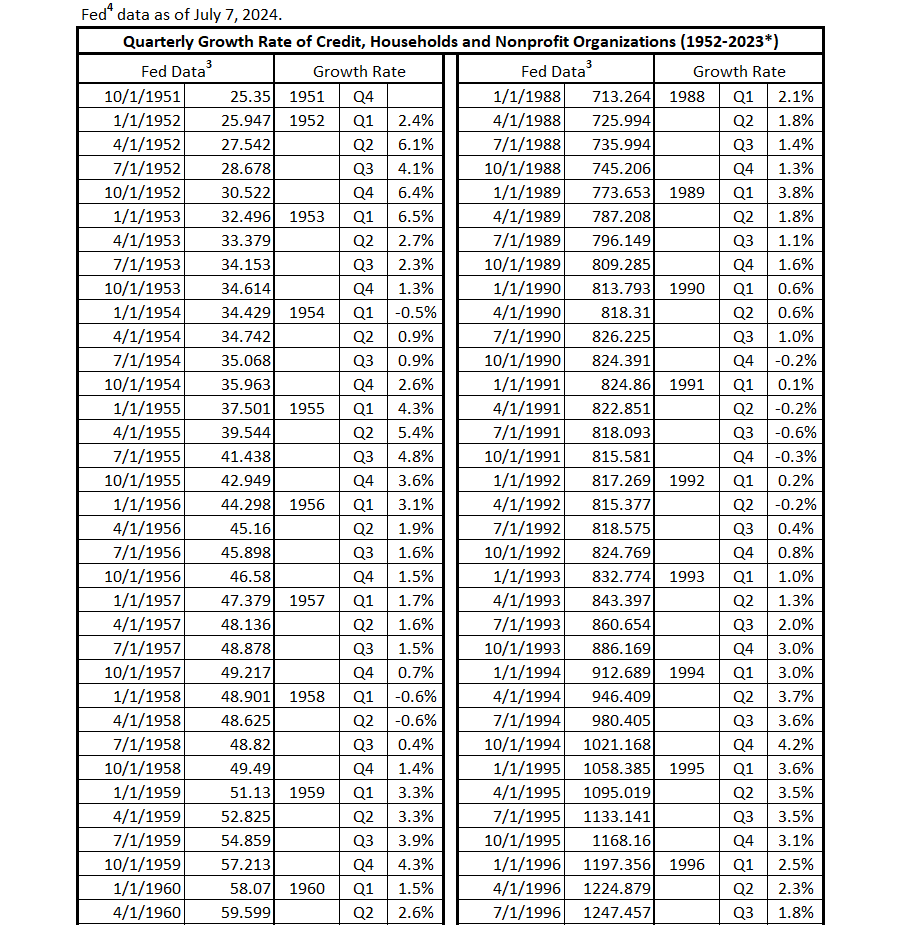
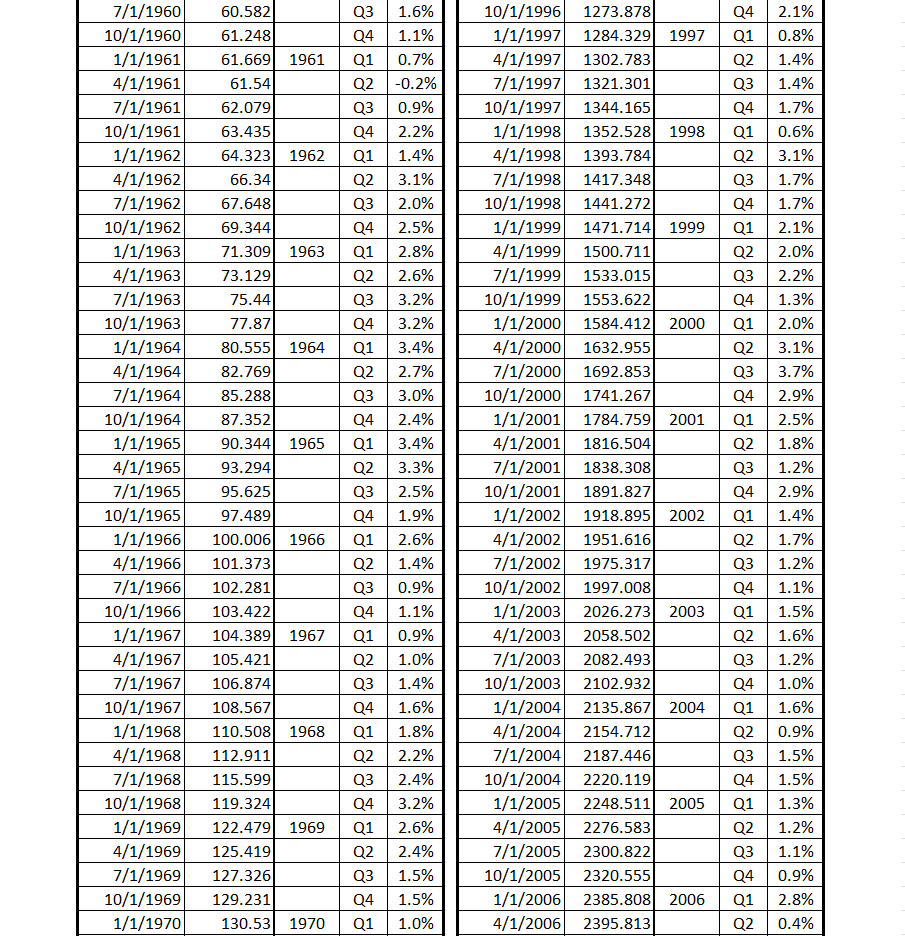
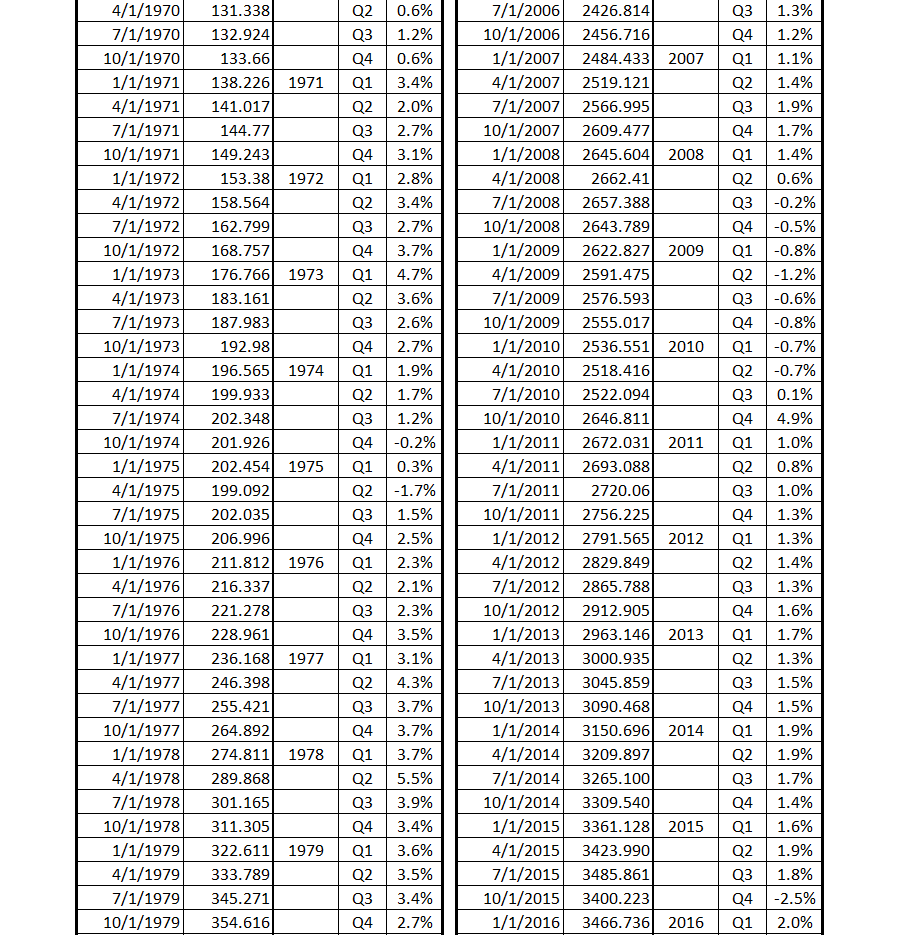
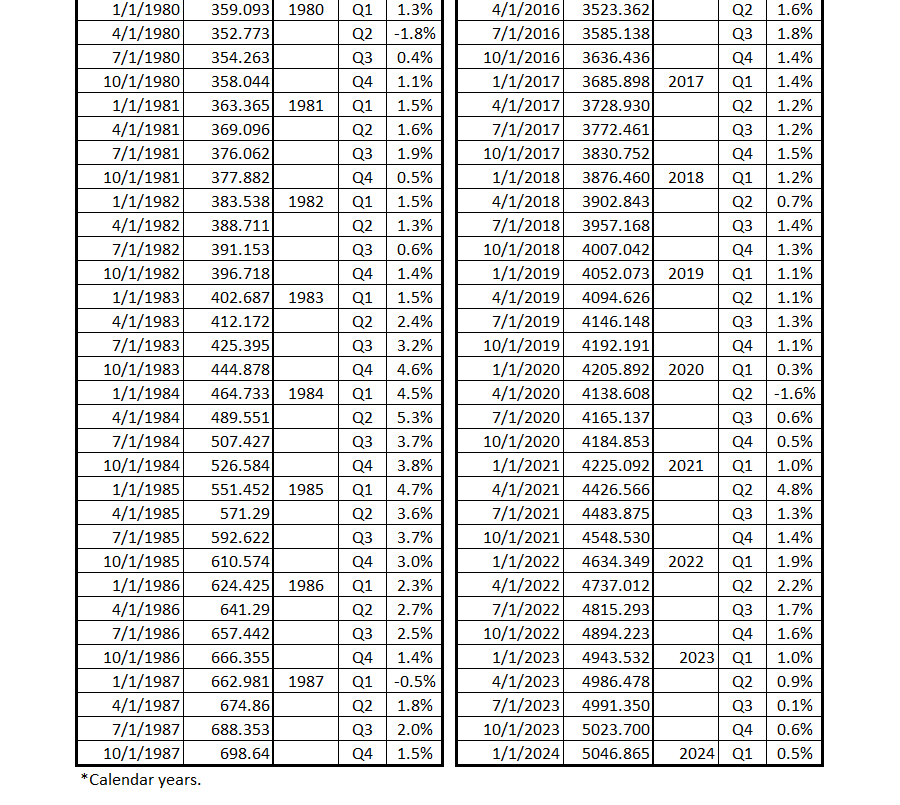
The credit data for households and nonprofit organizations (HNO) is from the Fed database.4 The table below shows the conversion of the Fed data to growth rate by quarter.
Table A2. Growth Rate of HNO 1952-2023* (Quarter-over-Quarter)
Footnotes
1. Lounsbury, John, “Quantity of Money and Inflation. Part 1. General Considerations”, EconCurrents, July 7, 2024. https://econcurrents.com/2024/07/07/quantity-of-money-and-inflation-part-1-general-considerations/.
2. Lounsbury, John, “Consumer Credit and Inflation. Part 1., EconCurrents, September 3, 2023. https://econcurrents.com/2023/09/03/consumer-credit-and-inflation-part-1/.
3. Federal Reserve Economic Data, Nonfinancial Corporate Business; Debt Securities and Loans; Liability, Level, Billions of Dollars, Quarterly, Seasonally Adjusted. Data taken July 7, 2024. https://fred.stlouisfed.org/series/BCNSDODNS.
4. Federal Reserve Economic Data, Households and Nonprofit Organizations; Consumer Credit; Liability, Level, HCCSDODNS, Data taken July 7, 2024. https://fred.stlouisfed.org/series/HCCSDODNS.
5. Freedman, David, Pisani, Robert, and Purves, Richard, Statistics, Fourth Edition, W.W. Norton & Company (New York) and Viva Books (New Delhi), 2009. See Chapters 8 & 9 to explain how normal distributions relate to determining correlation coefficients. See p. 147 for a discussion of football-shaped scatter diagrams.
Read Part 3 >>> Quantity Of Money And Inflation - Part 3: More About Confounding
More By This Author:
Quantity of Money and Inflation - Part 1: General Considerations
M2 Money Supply and CPI Inflation - Part 4
M2 Money Supply and CPI Inflation - Part 3


Comments
Log in or sign up to join the conversation.