
This post ranks the associations between changes in various sources of money and subsequent CPI inflation for inflationary surges from 1952 to 2023.
Introduction
Past posts have determined the correlations between changes in various sources of money and consumer inflation that occurred up to two years afterward. Here, we rank the associations between the following money changes and subsequent CPI during inflation surges between 1952 and 2023:
- Federal Deficit Spending1,2
- Household and Nonprofit Organization Credit3
- Mortgage Debt4
- Nonfinancial Corporate Credit5
- Financial Corporate Credit6
- M2 Money Supply7
Data
The inflation timeline from 1952 to 2022 is divided into 18 intervals. Eight of these are inflation surges.1
Table 1. Timeline of Inflation Data 1952-2022
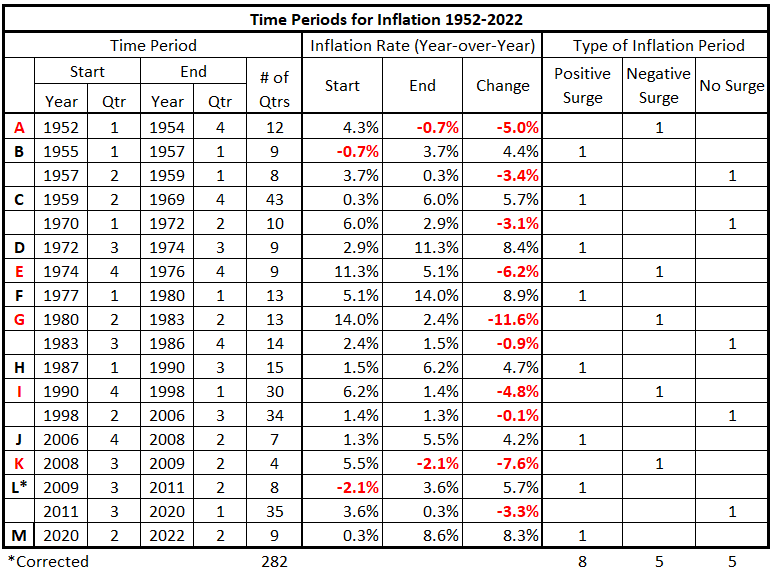
We often analyze the interval C in two parts, C1 (1959-64) and C2 (1965-69), because the inflation rates differ for the two periods.
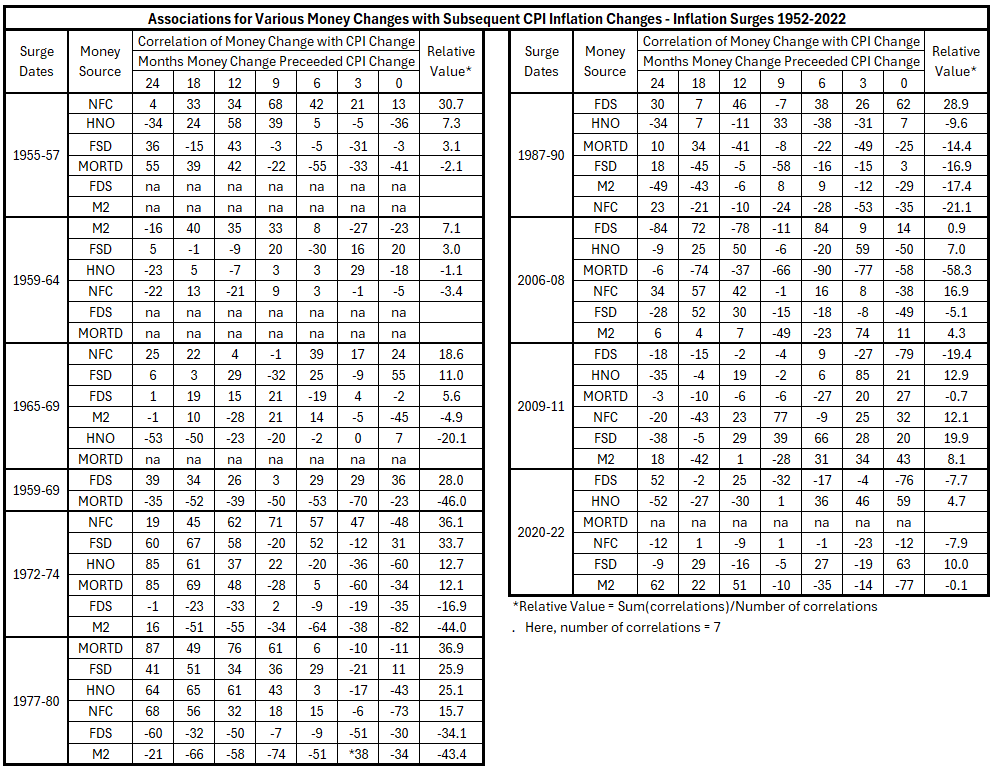
The data is from the references cited in the introduction.1–7 Table 2 summarizes the data.
Table 2. Correlations Money Changes vs. CPI 1952-2022
Analysis
Table 3 shows the ranking of the individual data lines in Table 2 from the most positive association to the most negative.
Table 3. Ranking Correlations for Money Source Changes over All CPI Surges 1952-2022

There is no indication of a systematic relationship for associations between changes in any of the money sources and subsequent inflation. Some observations:
- All the money supply changes have both positive and negative associations with subsequent inflation.
- Mortgage Debt has the strongest positive and negative associations with subsequent inflation.
- The M2 Money Supply has much greater negative associations with subsequent inflation than positive associations.
Table 4 looks at the variation of associations for each money source across the inflation surges studied.
Table 4. Ranking Correlations for Each Money Source Change over All CPI Surges 1952-2022
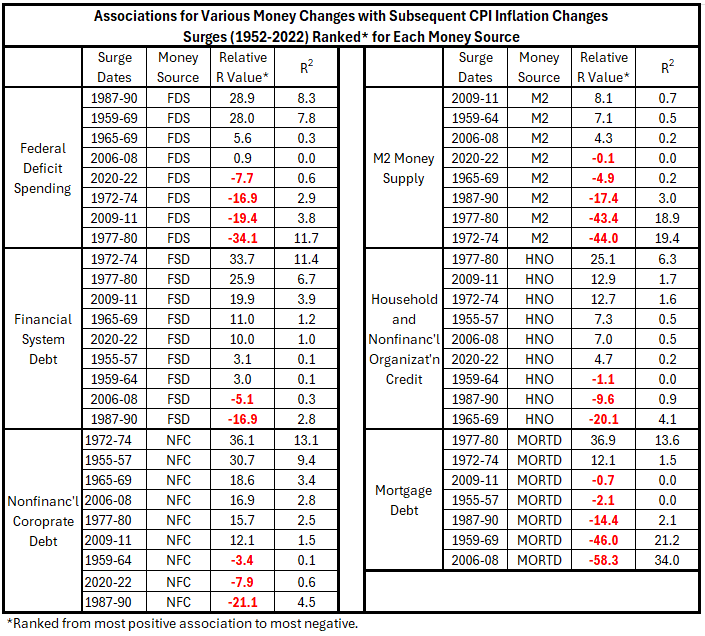
The ranking from most positive money source change associated with subsequent inflation to most negative is as follows:
- Financial System Debt
- Nonfinancial Corporate Debt
- Household and Nonprofit Organization Credit
- Federal Deficit Spending
- M2 Money Supply
- Mortgage Debt
It is puzzling that the M2 Money Supply ranks below all but one of the money sources contributing to it. Surprisingly, Federal Deficit Spending ranks below all other money sources except Mortgage Debt. Finally, explaining how so many money supply changes could be negatively associated with subsequent inflation is difficult.
Table 5. Ranking Correlations for Each Money Source Change within Each CPI Surge 1952-2022
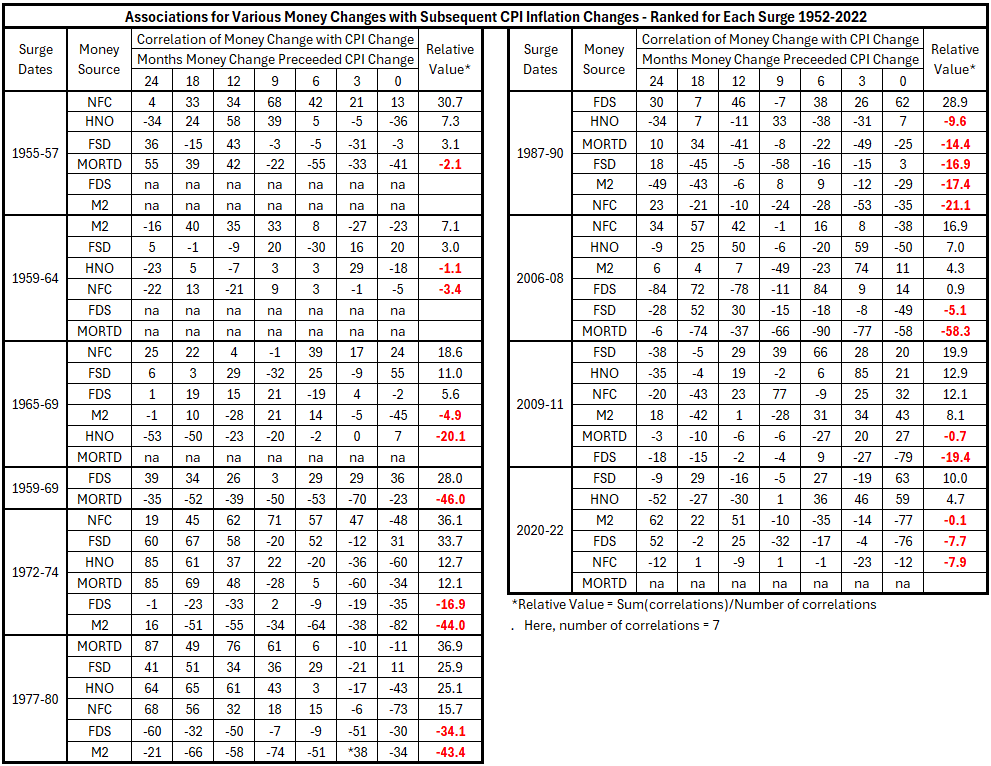
The most positive associations for subsequent inflation with changes in quantities of money occurred in 1972-74 and 1977-80. However, there is a contradiction. During both surges, there were negative associations between M2 changes and subsequent inflation.
There were less strong positive associations between changes in four money sources and subsequent inflation in 2006-08 and 2009-11. There were even weaker positive associations for 1955-57 and the decade of the 1960s.
The weakest associations occurred for 1987-90 and 2020-22.
Conclusion
The ranking exercises show no systematic patterns for money supply changes contributing to subsequent inflation. Overall, changes in quantities of money do not show strong associations with subsequent inflation. Only three R2 values exceed 10% for positive associations: 14% for Mortgage Debt (1977-80), 13% for Nonfinancial Corporate Debt (1972-74), and 11% for Financial System Debt (1972-74). These results indicate that increases in the quantity of money have done little to drive subsequent inflation in many cases.
Next week, we will examine the problem of associations with subsequent inflation for M2 that are often smaller than for the component sources of money supply. We anticipate we may return to our old friend, confounding. That may lead to the possibility of establishing some quantitative estimates for the limits for increases in money being the cause of subsequent inflation.
Footnotes
1. Lounsbury, John, “Comparing Two Data Organizations for Federal Deficit Spending vs Inflation. Part 1,” EconCurrents, May 5, 2024. https://econcurrents.com/2024/05/05/comparing-two-data-organizations-for-federal-deficit-spending-vs-inflation-part1/
2. Lounsbury, John, “Government Spending and Inflation. Reprise and Summary,” EconCurrents, August 20, 2023. https://econcurrents.com/2023/08/20/government-spending-and-inflation-reprise-and-summary/.
3. Lounsbury, John, “Consumer Credit and Inflation: Part 2”, EconCurrents, September 10, 2023. https://econcurrents.com/2023/09/10/consumer-credit-and-inflation-part-2/.
4. Lounsbury, John, “Mortgage Debt and Inflation: Part 2”, EconCurrents, October 8, 2023. https://econcurrents.com/2023/10/08/mortgage-debt-and-inflation-part-2/.
5. Lounsbury, John, “Nonfinancial Corporate Credit and Inflation: Part 2”, EconCurrents, February 18, 2024. https://econcurrents.com/2024/02/18/corporate-nonfinancial-credit-and-inflation-part-2/.
6. Lounsbury, John, “Financial Sector Debt and Inflation, Part 2″, EconCurrents, March 17, 2024. https://econcurrents.com/2024/03/17/financial-sector-debt-and-inflation-part-2/.
7. Lounsbury, John, “M2 Money Supply and Inflation, Part 2”, EconCurrents, June 9, 2024. https://econcurrents.com/2024/06/09/m2-money-supply-and-cpi-inflation-part-2/
More By This Author:
Quantity of Money and Inflation - Part 2: Confounding
Quantity of Money and Inflation - Part 1: General Considerations
M2 Money Supply and CPI Inflation - Part 4


Comments
Log in or sign up to join the conversation.