
Here’re some indicators at a weekly frequency for the real economy.
(Click on image to enlarge)
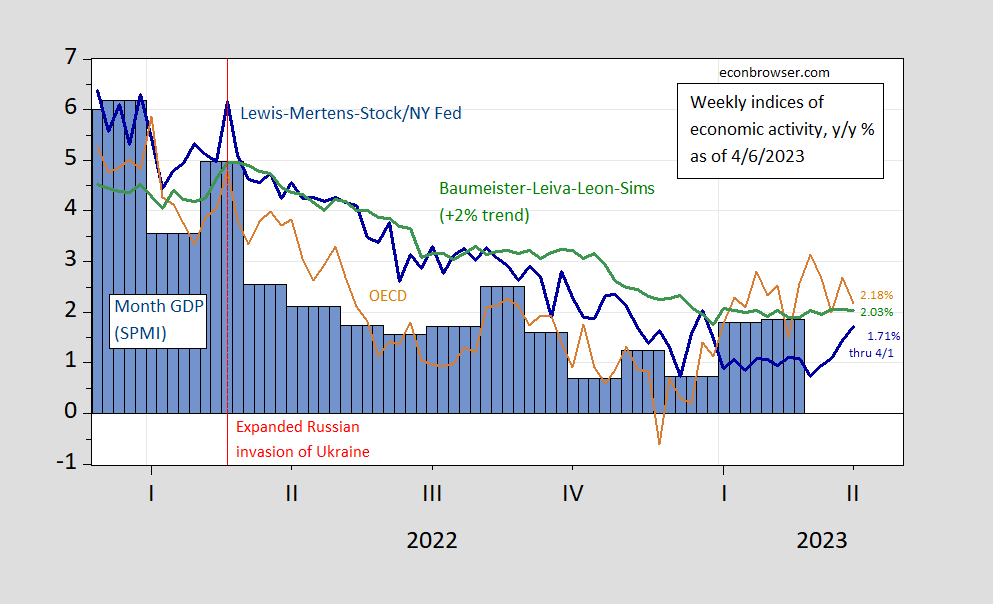
Figure 1: Lewis-Mertens-Stock Weekly Economic Index (blue), OECD Weekly Tracker (tan), Baumeister-Leiva-Leon-Sims Weekly Economic Conditions Index for US plus 2% trend (green), S&P Market Intelligence monthly GDP (blue bar), all growth rate in %. Source: S&P Market Intelligence, NY Fed via FRED, OECD, WECI, accessed 4/6b, and author’s calculations.
The Weekly Tracker continues to read growth at 2.18%, for the week ending 4/1, about the same as the WECI+2% (2.03%). The WEI reading for the week ending 4/1 of 1.71% is interpretable as a y/y quarter growth of 1.71% if the 1.71% reading were to persist for an entire quarter.The Baumeister et al. reading of 0.03% is interpreted as a 0.03% growth rate in excess of long term trend growth rate. Average growth of US GDP over the 2000-19 period is about 2%, so this implies a 1.97% growth rate for the year ending 4/1. The OECD Weekly Tracker reading of 2.18% is interpretable as a y/y growth rate of 2.18% for year ending 4/1.
Recall the WEI relies on correlations in ten series available at the weekly frequency (e.g., unemployment claims, fuel sales, retail sales), while the WECI relies on a mixed frequency dynamic factor model. The Weekly Tracker is a “big data” approach that uses Google Trends and machine learning to track GDP. As such, it does not rely on actual economic indices per se.
The WEI reading, if applied to Q1, implies 1.64% (q/q SAAR). As of 4/5, GDPNow was 1.5% (q/q SAAR). while S&P Market Insight (nee Macro Advisers/IHS Markit) tracking was at 1.9%.
More By This Author:
Private NFP Growth Predicted Using ADP Data
Coincident Index, Monthly GDP, And GDP+
Business Cycle Indicators As Of April’s Start


Comments
Log in or sign up to join the conversation.