
We’ll see if it’s the cruelest month. For now, monthly GDP continues to grow in February, albeit slowly (0.2% m/m) while January growth was revised up.
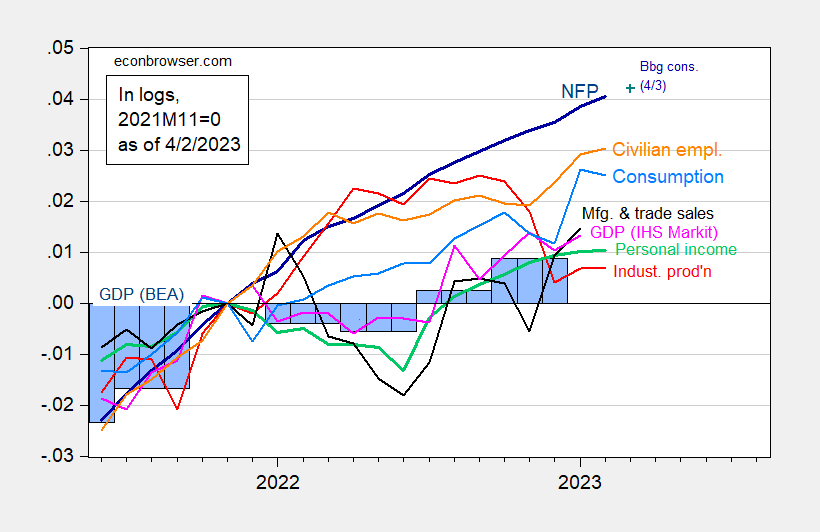
Figure 1: Nonfarm payroll employment, NFP (dark blue), Bloomberg consensus of 4/3 (blue +), civilian employment (orange), industrial production (red), personal income excluding transfers in Ch.2012$ (green), manufacturing and trade sales in Ch.2012$ (black), consumption in Ch.2012$ (light blue), and monthly GDP in Ch.2012$ (pink), GDP (blue bars), all log normalized to 2021M11=0. Q3 Source: BLS, Federal Reserve, BEA 2022Q4 3rd release via FRED, S&P Global/IHS Markit (nee Macroeconomic Advisers) (4/3/2023 release), and author’s calculations.
The current estimate is due mostly to inventory accumulation; final sales were flat. S&P Market Intelligence notes that combined with their tracking forecast of quarterly GDP, implied monthly GDP in March is 0.2% m/m decline.
Monthly GDP will be revised next month, so one might wonder how much weight to put on this series. Figure 2 shows the evolution of monthly GDP over different vintages.
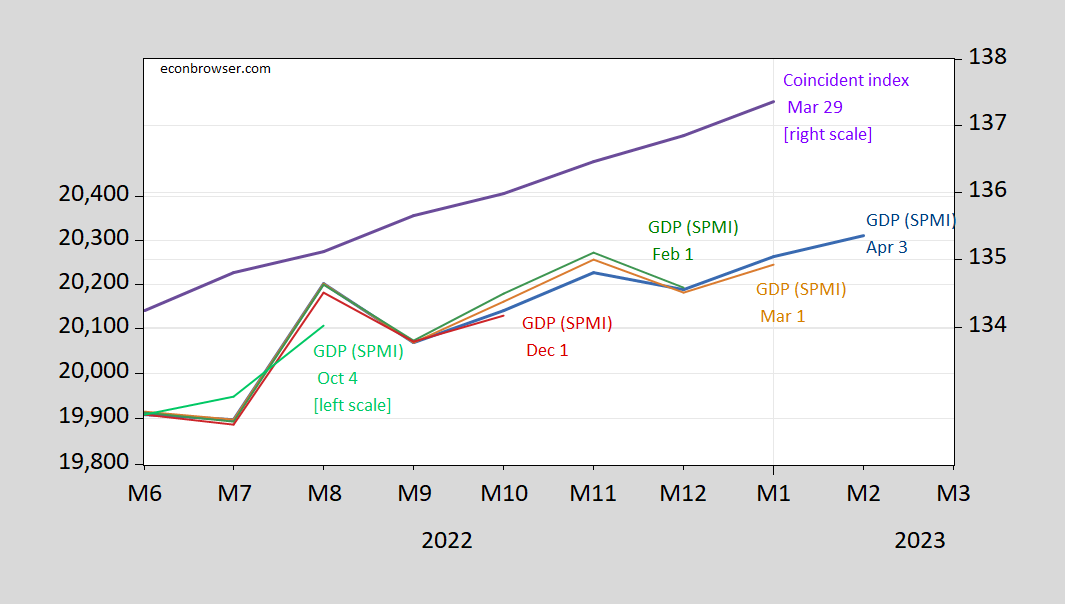
Figure 2: Monthly GDP of April 3 release (blue), of March 1 release (tan), of February 1 (green), of December 1 (red), of October 4 (light green), in billions Ch.2012$ SAAR (left log scale), and coincident index (blue, right log scale). Source: S&P Market Intelligence (various issues), and Philadelphia Fed.
This suggests to me no recession through February. No guarantees going forward.
More By This Author:
Spreads, Breakevens, And Risk/Uncertainty As Of End-MarchOil Prices, Fed Funds Path Up
A Statistical Analysis Of Implications Of Using The “China Virus” Phrase


Comments
Log in or sign up to join the conversation.