
The divergence between performance recorded by primarily labor market indicators (in the coincident index for February released today) and output-based indicators persists.
(Click on image to enlarge)
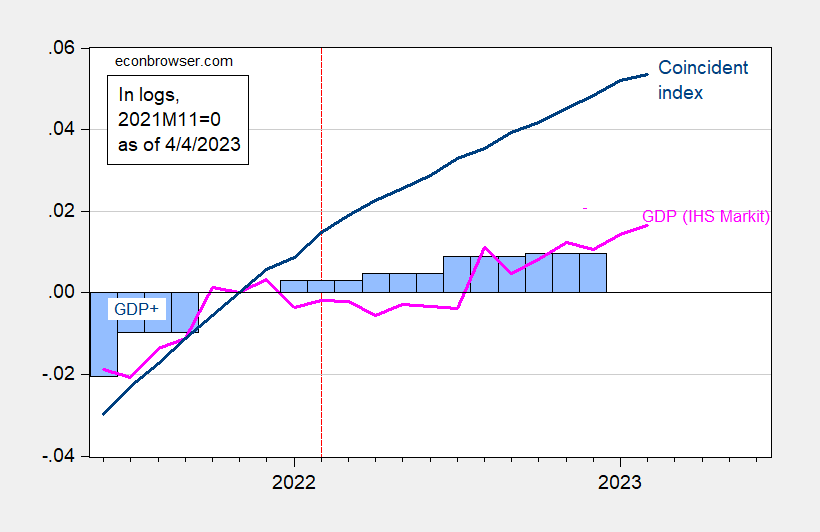
Figure 1: GDP+ (blue bars), Monthly GDP (pink line), and coincident index (blue), all in logs 2021M11=0. GDP+ level calculated by iterating growth rates on 2019Q4 actual GDP. Red dashed line at expanded Russian invasion of Ukraine. Source: Philadelphia Fed, Philadelphia Fed via FRED, S&P Market Intelligence, and author’s calculations.
More By This Author:
Business Cycle Indicators As Of April’s StartSpreads, Breakevens, And Risk/Uncertainty As Of End-March
Oil Prices, Fed Funds Path Up


Comments
Log in or sign up to join the conversation.