
Deceleration was still in place, according to the WEI.
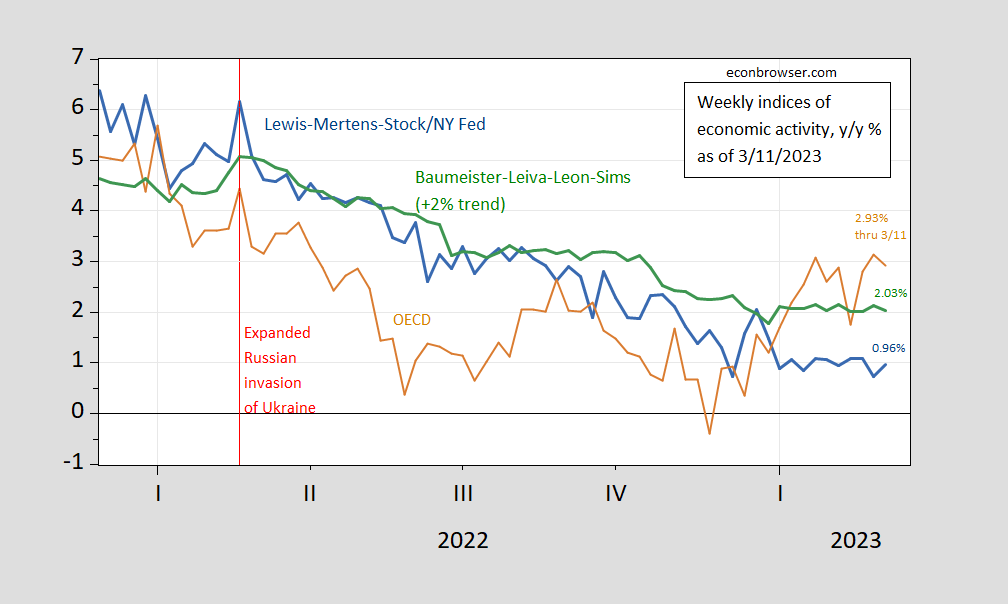
Figure 4: Lewis-Mertens-Stock Weekly Economic Index (blue), OECD Weekly Tracker (tan), Baumeister-Leiva-Leon-Sims Weekly Economic Conditions Index for US plus 2% trend (green). Source: NY Fed via FRED, OECD, WECI, and author’s calculations.
Still, nowcasts and tracking estimates were indicating growth in Q1, albeit with some wide variation (and all implying a negative output gap, taking the CBO estimate of potential as given).
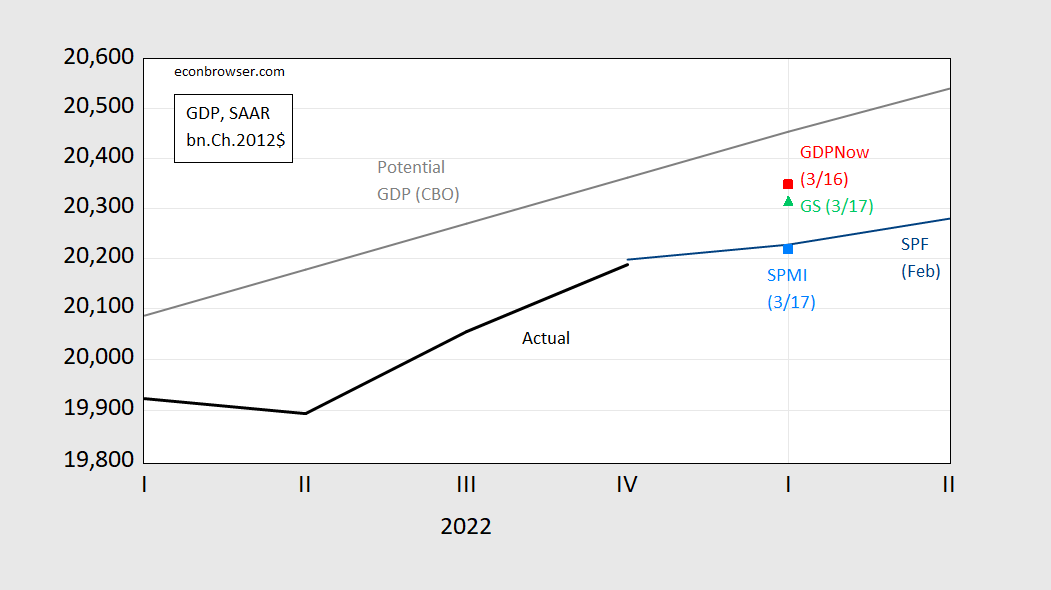
Figure 2: GDP (bold black), GDPNow (red square), S&P Market Insight (sky blue square), Goldman Sachs (light green triangle), Survey of Professional Forecasters survey median forecast (blue line), all in bn.Ch.2012$ SAAR. Source: BEA 2022Q4 2nd release, Atlanta Fed, S&P Global (3/17), Goldman Sachs (3/17), Philadelphia Fed SPF (February), CBO Budget and Economic Outlook (Feb. 2023), and author’s calculations.
Q1 growth is positive, but barely, ranging from a low at 0.6% q/q SAAR from SPMI (formerly Macro Advisers, formerly IHS Markit), and a high of 3.2%, from Atlanta Fed’s GDPNow. We are now about 40 days from the advance 2023Q1 GDP release. Historically, GDPNow has slightly beaten (has a slightly smaller RMSFE) than the Bloomberg consensus at this horizon. As of yesterday, that seems to be around 0.55% q/q SAAR.
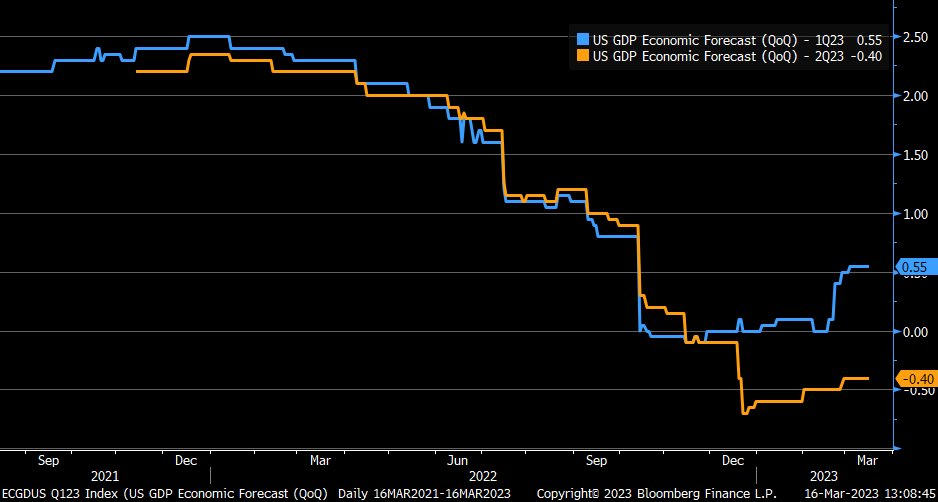
Source: Liz Ann Sonders, 17 March 2023.
More By This Author:
SVB, SIFIs, Dodd-Frank, EGRRCPA, HQLA And The LCR
“So China Is Now Paying Us Billions Of Dollars In Tariffs”
Back In The Real Economy: Business Cycle Indicators, Mid-March


Comments
Log in or sign up to join the conversation.