US-Euro Area Price Level And Inflation Differentials: I(0), I(1), Segmented Trends?
Do you calculate inflation differentials using … inflation or price levels? Follow up on this debate from a bit over a year ago.
Here’s a time series plot of the log ratio of US CPI to Euro Area 19 HICP (seasonally adjusted by author using X13) (blue line, left scale), and month-on-month inflation differential annualized (tan line, right scale).

Figure 1: Log ratio of US CPI-all urban to Euro Area 19 HICP (blue line, left scale), and month-on-month annualized inflation differential, in % (tan line, right scale). HICP seasonally adjusted using X13 log transform, X11 ARIMA seasonal adjustment. Inflation differential calculated using log first differences. Source: BLS, EC via FRED, and author’s calculations.
Summary of results on log ratio:
- ADF unit root test: fail to reject at 10% msl.
- DF-GLS (ERS) unit root test: fail to reject at 10% msl.
- KPSS trend stationary test: reject at 1% msl.
- Bai-Perron structural break tests of L+1 vs. L sequentially determined breaks: no breaks selected.
Summary of test results on m/m inflation rate differential:
- ADF unit root test: reject at 1% msl.
- DF-GLS (ERS) unit root test: reject at 1% msl.
- KPSS trend stationary test: fail to reject at 10% msl.
- Bai-Perron structural break tests of L+1 vs. L sequentially determined breaks: no breaks selected.
What about core?

Figure 2: Log ratio of US CPI-core to Euro Area 19 HICP core (blue line, left scale), and month-on-month annualized inflation differential, in % (tan line, right scale). HICP seasonally adjusted using X13 log transform, X11 ARIMA seasonal adjustment. Inflation differential calculated using log first differences. Source: BLS, EC via FRED, TradingEconomics, and author’s calculations.
Summary of results on log ratio for core:
- ADF unit root test: fail to reject at 10% msl.
- DF-GLS (ERS) unit root test: fail to reject at 10% msl.
- KPSS trend stationary test: reject at 1% msl.
- Bai-Perron structural break tests of L+1 vs. L sequentially determined breaks: 5 breaks selected; last one at 2019M05.
Summary of test results on m/m inflation rate differentials for core:
- ADF unit root test: reject at 1% msl.
- DF-GLS (ERS) unit root test: reject at 1% msl.
- KPSS trend stationary test: fail to reject at 1% msl, reject at 5% msl.
- Bai-Perron structural break tests of L+1 vs. L sequentially determined breaks: 2 breaks selected; last one at 2013M04.
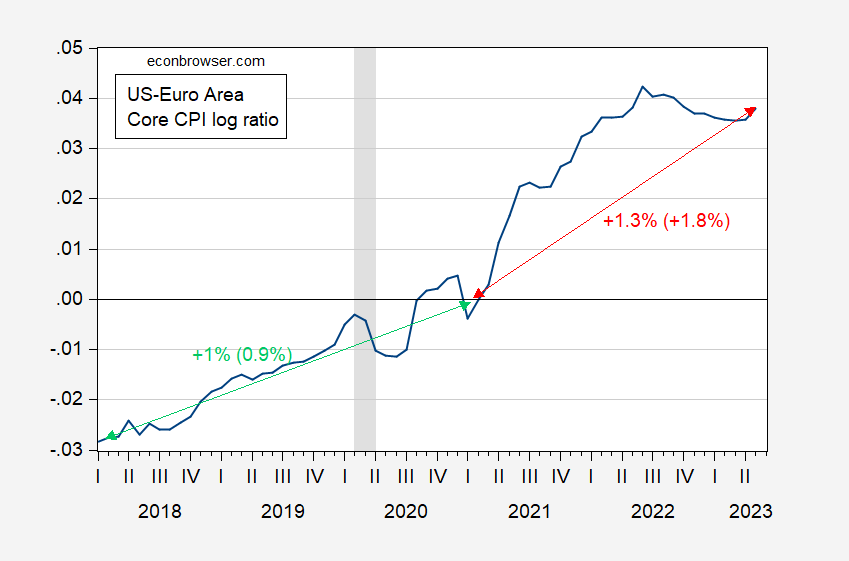
While the trend break at 2021M02/03 is not statistically significant for core (using a dummy for inflation differentials, or a dummy interacted with trend for price ratio), you can see there is an acceleration in relative core.

Figure 3: Log ratio of US to Euro Area 19 core prices, 2020M02=0 (blue). Green (red) arrow are deterministic trends with numbers (in parentheses) indicating deterministic (stochastic) trend growth rates. NBER defined peak-to-trough recession dates shaded gray. Source: BLS and EC via FRED, TradingEconomics, NBER and author’s calculations.
Taking segmented trends literally, US core CPI is growing 0.3 ppts faster than the Euro area, starting from 2021M02 onward.
For more on testing on deterministic, stochastic and segmented trends, see Cheung and Chinn (Oxford Economic Papers, 1996), Cheung and Chinn (JBES, 1997), and Cheung, Chinn and Tran (AEL, 1995).
Update, 8pm Pacific:
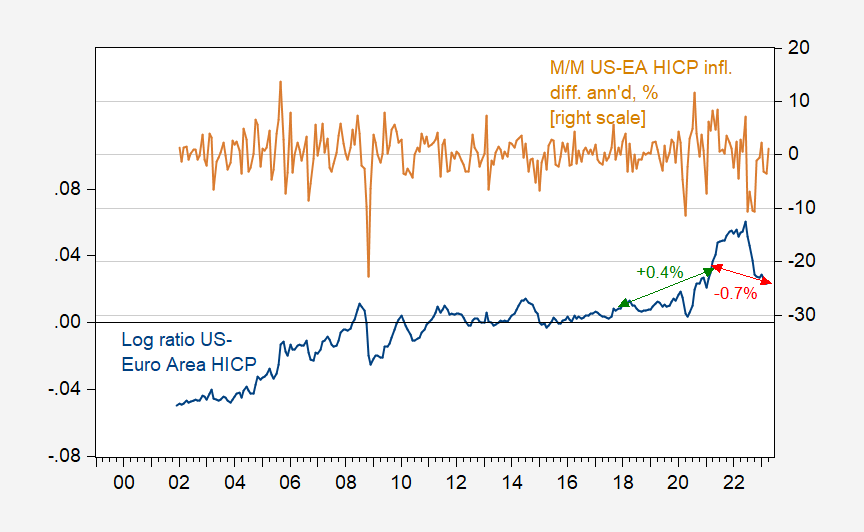
2slugbaits points out that HICP and CPI treat implied residential rent differently. I repeat Figure 1, but using US HICP as well as Euro Area HICP.

Figure 4: Log ratio of US HICP to Euro Area 19 HICP (blue line, left scale), and month-on-month annualized inflation differential, in % (tan line, right scale). HICP seasonally adjusted using X13 log transform, X11 ARIMA seasonal adjustment. Inflation differential calculated using log first differences. Source: BLS, EC via FRED, and author’s calculations.
The unit root/trend stationary test results are essentially the same as for the CPI/HICP comparison.
From 2018M02-2021M2, the ratio rose +0.4% per year, and from 2021M02-2023M04, it fell 0.7%. For comparison, in Figure 1 (running to 2023M05), the ratio rose+0.8%, then fell 0.8%. Hence, using HICPs for both regions, the shift is slightly smaller.
More By This Author:
Term Spread Inversion And Non-InversionsThe Labor Market – Bargaining Power, Wages, Inflation
World Bank’s Global Economic Prospects, June 2023


