The Labor Market – Bargaining Power, Wages, Inflation
From WPR yesterday, UW Madison experts:
Timothy Smeeding, a professor of public affairs and economics at the University of Wisconsin-Madison, told Wisconsin Public Radio’s “Central Time” that the tight labor market has helped low-wage workers the most.
Between 2019 and 2022, the lowest 10 percent of wage earners nationally saw their inflation-adjusted hourly wage grow by 9 percent, according to the Economic Policy Institute. That’s the fastest wage growth for the lowest-wage workers since 1979.
Smeeding said demand for workers exceeding supply is what led to that growth, especially as the pandemic waned and people began going out again. He expects that trend to continue as long as there’s a tight labor market.
“The good news is that there’s a lot of demand for low-skilled workers beyond bars and restaurants now (with) the expansion of infrastructure and construction,” he said.
What’s happened in leisure and hospitality, traditionally one of the lowest paid sectors?
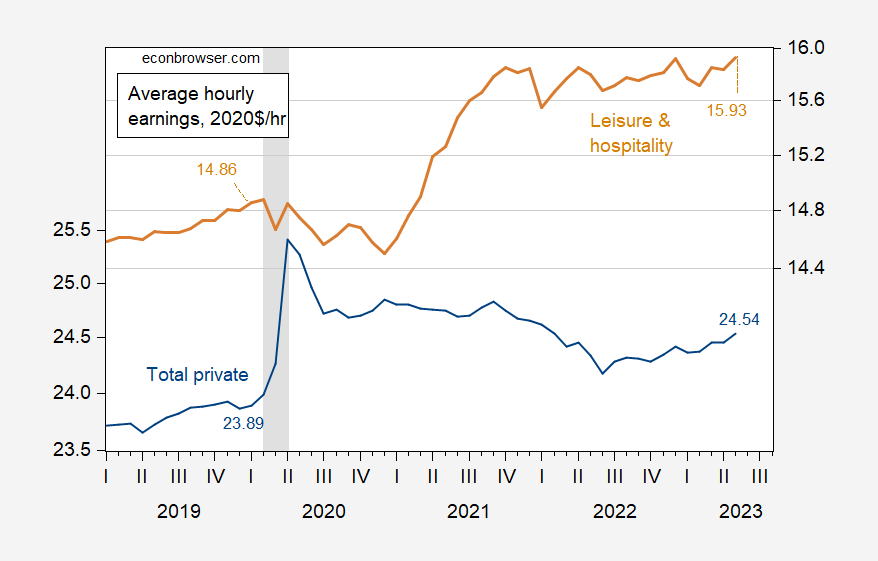
Menzie Chinn, professor of public affairs and economics at UW-Madison, said that wage gains haven’t been evenly distributed by economic sectors. He noted leisure and hospitality workers have seen the largest wage gains since the pandemic, while wages for workers in all other non-farm sectors have seen slower wage growth.
“As far as we can tell, (leisure and hospitality workers) are beating inflation, at least in terms of the wage rate,” he said. “Now, I don’t know how many hours they’re working, and it’s going to be spotty because not everybody is going to be in a restaurant that saw their wages rise.”
Beyond wages, Laura Dresser, associate director of the COWS economic think tank at UW-Madison, said the tight labor market also gives workers more leverage to negotiate with their employers for more flexible hours or to confront workplace harassment.
Using nationwide statistics, here’s what we see about real (inflation-adjusted) wages:

Figure 1: Average hourly earnings in total private sector (blue, left log scale), and in leisure and hospitality (tan, right log scale), in 2020$/hour (CPI-all deflated). NBER defined peak-to-trough recession dates shaded gray. Source: BLS, NBER, and author’s calculations.
More By This Author:
World Bank’s Global Economic Prospects, June 2023
FT-Booth School June Survey Of Macroeconomists: Recession Start In 2024
May 2023 Inflation: Various Measures, Horizons


