
U.S. Equity Markets Have Probably Entered Their Capitulation Phase

Image Source: Pexels
Currently, the S&P 500 index is not in bear market territory – using the very simple, even naïve, 20% rule of thumb. Conversely, the two U.S. technology stock market indexes – among others - have declined more than 20% from their highest local daily close.
I use many different tools in my analysis of the markets. On April 3rd, 4th and 7th, one of my main capitulation indicators triggered for the major U.S. stock indices. Capitulation, by definition, is a rare event and is often accompanied by intense selling volume and extreme volatility. Not all severe declines (bear markets) end with capitulation.
Here is how I interpret such a signal: History shows that when markets capitulate, sufficient selling has taken place to cause the decline to enter its last phase. The ending of the decline is forthcoming, setting up the conditions for a new rising (bull) market to emerge.
Essentially, capitulation can mean three things for the stock market indexes: they have already formed their bottoms, they are close to bottom out or they are beginning their bottoming process. Were the lows made on April 7th and 8th the bottoms? There is no way of knowing in advance when the indices have found their exact bottoms, only after the fact. They could decline further. Price action must confirm that the overwhelming selling pressure is over. A promising sign would be if the key indexes managed to hold their early April swing lows.
Robert (Bob) Farrell, former chief market analyst at Merrill Lynch and Wall Street legend, described a repeating pattern of the collective feelings of investors during a broad stock market decline. He divided the mood of investors into three stages: complacency (early stage), concern (mid-stage) and capitulation (final stage). The mood changed systematically and sequentially with each new stage. Bob called this emotional scheme the Three Cs of a Bear Market.
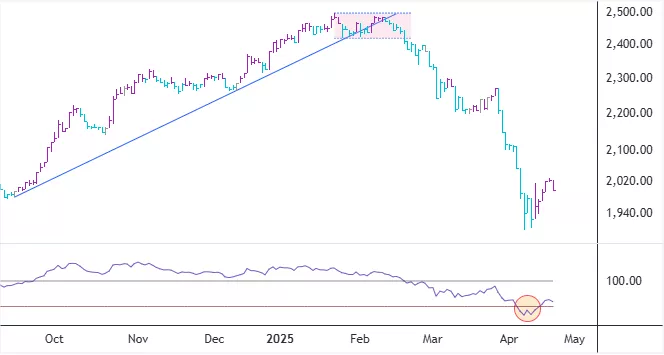
The chart below shows the development of the OMX Iceland All-Share Price Index (OMXIPI) on a daily chart. It is in a bear market after reversing its trend from up to down on February 19th and is close to starting a new downswing. The circle in the lower window of the chart marks the first capitulation signal, sometimes the indicator flashes more than one.
OMXIPI – Daily Chart
More By This Author:
Housing Related Stock Prices Seeking A Bottom
XAU Has Likely Broken Out To The Upside
Leadership And Breadth In The U.S. Equity Market
Disclosure: The author of the analysis presented does not own shares or have a position or other direct or indirect monetary interests in the financial instrument or product discussed in his ...
more

