
Housing Related Stock Prices Seeking A Bottom

Image Source: Pixabay
It has been a while since I wrote here about the U.S. housing sector, which is highly cyclical and sensitive to economic and credit (interest rate) conditions.
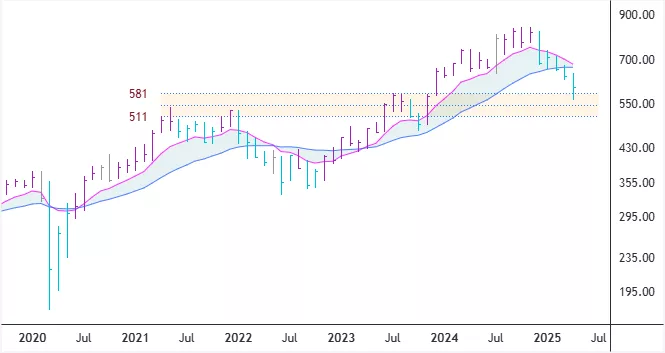
As can be seen on the monthly chart, the PHLX Housing Sector Index (HGX) has declined in recent months after forming a triple top. Its all-time highest daily close was reached on October 18th, 2024. Currently, it is down 27.7% after bouncing up from its April 8th/9th lows. Based on my proprietary measure, which paints the price bars according to set rules, the Index is only in a downswing of a longer-term uptrend on the monthly chart.
I have drawn in the area between the levels of 581 and 511 as potential support for the Index. If the pink shorter-term moving average line crosses below the blue longer-term moving average line, then I will closely watch if we get a follow-through month or not.
The weekly chart for HGX shows a possible head-and-shoulder pattern in play, with the initial target coming in at 533-528. Three unfilled gaps from November 2023 are found on the daily chart and are illustrated on the weekly chart. Such gaps often act as magnets, attracting prices. The middle gap corresponds to the 533-528 zone.
HGX – Monthly Chart
HGX – Weekly Chart
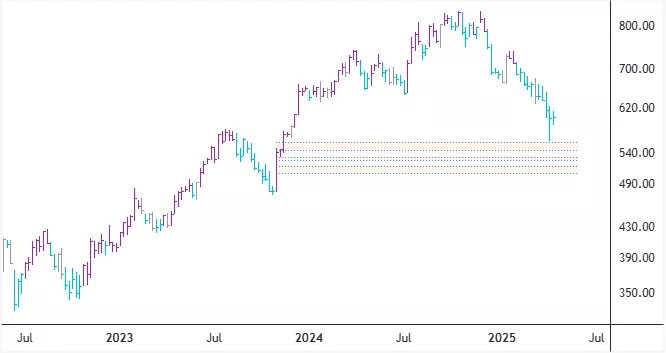
Home building and construction activities are important for the U.S. economy. XHB and ITB are Exchange Traded Funds (abbreviated ETFs) that track two important housing-related stock indices, the S&P Homebuilders Select Industry Index and the Dow Jones U.S. Select Home Construction Index. The ITB can be considered a purer representation of home building/construction than the XHB.
Both ETFs exhibit similar price patterns on their weekly charts as the HGX. On the charts, I have marked a few potential support zones - including unfilled gaps from the daily charts.
XHB – Weekly Chart
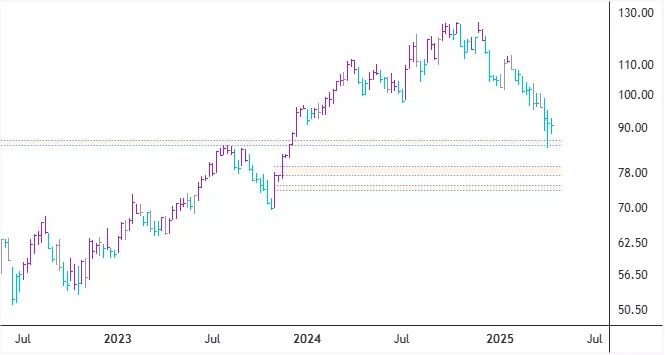
ITB – Weekly Chart

Trying to time the bottom is always very difficult. My approach - as laid out here for HGX, XHB and ITB - is to identify relatively nearby areas of possible support and then look for clues of a meaningful price reversal within any of those areas on the daily charts. If all three instruments decline further and take out their swing lows from late 2023, then I will re-evaluate my analysis and search for the next potential support zones.
Tip: It is wise to treat potential price support on a chart as a general area, as opposed to an exact level. I like to think of support as a mattress that prices sink into.
More By This Author:
XAU Has Likely Broken Out To The Upside
Leadership And Breadth In The U.S. Equity Market
Financial Sector At Important Inflection Point
Disclosure: The author of the analysis presented does not own shares or have a position or other direct or indirect monetary interests in the financial instrument or product discussed in his ...
more

