
The market started moving higher on Monday but pared its gains by the end of the session, ending more or less in the same place where it started. U.S. Treasury yields also, declined in early action today. U.S. Federal Reserve Chair Jerome Powell is expected to testify before Congress today and Wednesday and market direction is seemingly on hold pending his remarks.

Monday the S&P 500 closed at 4,048, up 3 points, the Dow closed at 33,431, up 40 points and the Nasdaq Composite closed at 11,676 down 13 points.
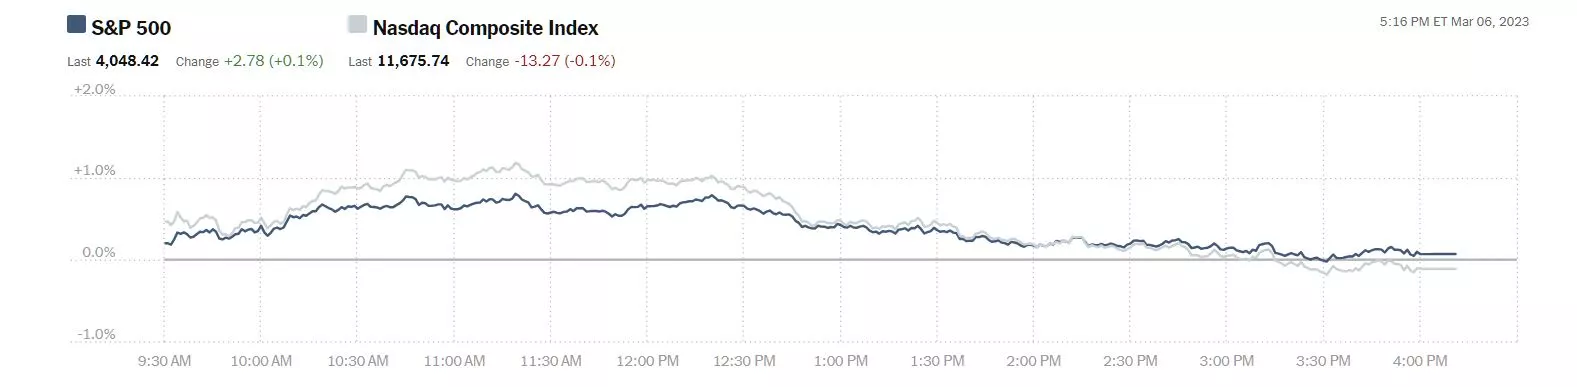
Chart: The New York Times
Top gainers were in Energy and Tech sectors, save for consumer cyclicals heavyweight, Domino's Pizza (DPZ), up 3.8%.
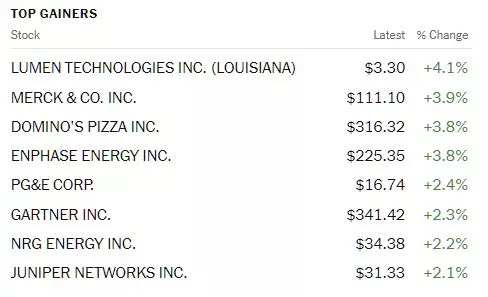
Chart: The New York Times
In futures trading this morning, S&P market futures are currently up 6 points, Dow market futures are up 12 points and Nasdaq 100 market futures are up 29 points.
TalkMarkets contributor Patrick Munnelly highlights China and the Fed in his Daily Market Outlook - Tuesday, March 7.
"China data once again put a lid on risk appetite, as Chinese trade data confirmed further contraction on dollar-denominated imports and exports, leading to a mixed performance on the Hang Seng and Shanghai Comp. The standout performer in the Asian region was the Australian ASX200 as the Reserve Bank of Australia hiked rates again but the move was accompanied by a less hawkish statement which buoyed investor sentiment...Today’s investor focus will be firmly on comments from US Federal Reserve Chair Powell’s semi-annual testimony on monetary policy to Congress. Today’s appearance before the Senate Banking Committee is the first of two days of the Fed Chair headlining central bank speakers, as he will also be on deck before the House Financial Services Committee Wednesday...Markets are currently pricing a 25bp rate rise at the next FOMC policy announcement on March 22...if the US central bank intends to hike by more, then today’s testimony provides the platform for Powell to alert market participants to this possibility before the Fed goes into its pre-meeting blackout period."
Contributor Declan Fallon provided a Weekly Chart Review at the top of the week which tries to provide some trend analysis. Below are his comments on the S&P 500 and Russell 2000, respectively.
"When you are getting spun around by daily charts, it's always good to fall back on weekly charts to see the big picture. If you are an investor, then the weekly charts are all you need.
On the weekly chart, there is a well-established break of the bearish trend, but this hasn't yet shaped the move to build the right-hand-side of a new base. In the case of the S&P (SPX), the summer high is the more important resistance level (currently at 4,325). Technicals are moving out of bearish territory, in particular, the MACD is working its way above the bullish mid-line. On-Balance-Volume is also about to turn bullish (on the weekly time frame). The caveat, as a weekly chart, it could be the end-of-the year before we even see a challenge of 4,325, but I do see this chart as more bullish."

"The Russell 2000 (IWM) has a well-established resistance its knocking up against. On the daily chart, we are working support of November, but on the weekly chart, we have already tested summer resistance and are well positioned to start a right-hand base. The Russell 2000 has a strong weekly chart and excellent technicals. It's also well above its 200-week MA. Again, as an investor, there is little to dislike here."

"Going forward, there is solid strength in the Russell 2000. This index is well placed to form a right-hand base (on a push above psychological resistance of $200 in $IWM), which in itself, won't take much to see a test of all-time highs. If this index can lead out, it will help bring the S&P and Nasdaq along with it, When in doubt, stick to the weeklies. "
Positive upward sentiment also comes from contributor Douglas Gammons who in a TM Editor's Choice column finds markets may be Approaching A New Short-Term Uptrend.
"The market is just starting, or is very near to starting, a new short-term uptrend. Early last week, the PMO touched the bottom of its range and then bounced upwards, indicating just a tiny bit of strength. Something similar happened in December with the PMO, but then it reversed lower, so we need to be careful and to be prepared for any outcome.
However, this hint at strength, combined with the favorable market action seen as we headed into the weekend, is making me optimistic that we are going to encounter a new rally.

Late in the session on Thursday, the market bottomed and then bounced higher. Thursday's late strength carried over to Friday which resulted in a solid day in the market, as shown in the chart below. All three major indexes have shown very nice action above their 5-day averages. It's a very convincing look for the bulls.

Above optimism aside Gammons says he is still bearish. See the full article for a slew of interesting charts. Below is his current thinking in a nutshell:
"I am still a bear, but I am positioning my accounts to follow the market higher. I consider almost all of the positions to be short-term holdings that will be quickly sold to protect profits and capital. At the moment, I have no short positions, and I am long about 80% and ready to deploy the remaining cash into long positions when the short-term uptrend is confirmed.
Why am I long stocks? Because I don't fight the market, and if it wants to go higher in the short-term, then I will follow along with it."
TalkMarkets contributor and economist Scott Sumner, often at odds with the Fed says QE And Low Inflation Are Not Alternatives.
"I think it’s a mistake to adopt asymmetrical policy targeting, where you combat above-target inflation and tolerate below-target inflation. Better to set a target path (preferably NGDP) and eliminate deviations in either direction."

"Raghuram Rajan recently offered some advice on monetary policy regimes:
[T]he balance of risks suggests that central banks should reemphasize their mandate to combat high inflation, using standard tools such as interest rate policy. What if inflation is too low? Perhaps, as with COVID-19, we should learn to live with it and avoid tools like quantitative easing that have questionably positive effects on real activity; distort credit, asset prices, and liquidity; and are hard to exit... Decades of low inflation are not what slowed Japan’s growth and labor productivity. Aging and a shrinking labor force are more to blame.
While Rajan doesn’t say this explicitly, his comment implies that tolerating low inflation is an alternative to quantitative easing (QE).In my view, toleration of very low inflation is a cause of QE...Toleration of very low inflation is not an alternative to QE; in the long run it’s the primary cause of QE. There is a close analogy with monetary policy and interest rates. On any given day, a cut in the central bank’s interest rate target is expansionary (for any given natural rate of interest). But over the longer run, a central bank with a contractionary policy regime that leads to low inflation will end up with lower nominal interest rates than a central bank that tolerates a high trend rate of inflation.
In the long run, there are three regimes that central bankers can choose from:
Regime A: Very low trend inflation. Very low nominal interest rates. Lots of QE and a large central bank balance sheet. (Japan and Switzerland are examples.)
Regime B: Moderate trend inflation. Moderate nominal interest rates. Very little QE and a moderate size balance sheet. (The US prior to 2008.)
Regime C: High trend inflation. High nominal interest rates. Substantial QE (financing budget deficits), but small central bank balance sheets as a share of GDP. (Argentina and Turkey.)"
I guess we want to get to choice B. ![]()
Rounding out the column this morning TM contributor James Harte provides his Global Indices Commentary.
Here is his current technical analyses of the Dax, FTSE and Nikkei:
"DAX
.webp)
The rally off the 15163.41 lows has seen the market trading back up to test above the 15642.76 level, trading new 2023 highs. Momentum studies are still quite flat though, with price now back above the bullish trend line, focus is on a continuation higher near-term.
FTSE
.webp)
The index is hugging the bull channel lows and support at the 7904.7 level. Momentum studies have flattened here, suggesting two way-risk. However, while price holds above the channel lows the focus is on a continued push higher. Should we slip below here, however, 7678.8 is the next support to note.
NIKKEI
.webp)
The rally in the Nikkei has seen the index breaking out above the bear trend line from last year’s highs and above the 27422.9 level. Price is now testing the 28356.6 level resistance and while this area is holding for now, the focus is on an eventual break higher in line with bullish momentum studies readings."
That's a wrap.
Waiting for Godot, umm, Powell, like the rest of you.

Have a good one.
More By This Author:
TalkMarkets Image Library
Thoughts For Thursday: Still Slipsliding
Tuesday Talk: A Whole Lotta Shakin' Goin On


Comments
Log in or sign up to join the conversation.