
Tuesday Talk: Red October
Q4 began on Friday and although October 1, ended with a slight bump upwards from Thursday's September 30 close, it was not a harbinger of things to come on Monday, October 4, when the market closed close to it's lows of July 19, which were 4,258 for the S&P 500 and 14,273 for the Nasdaq.

There are enough underlying concerns to keep the market volatile such as China issues (Evergrande, regulatory changes, economic contraction), world supply chain bottlenecks, COVID-19, and inflation without Monday's US debt ceiling alarms and Facebook's worldwide outage, both which surely did their part in contributing to yesterday's continued sell-off in the equities markets.
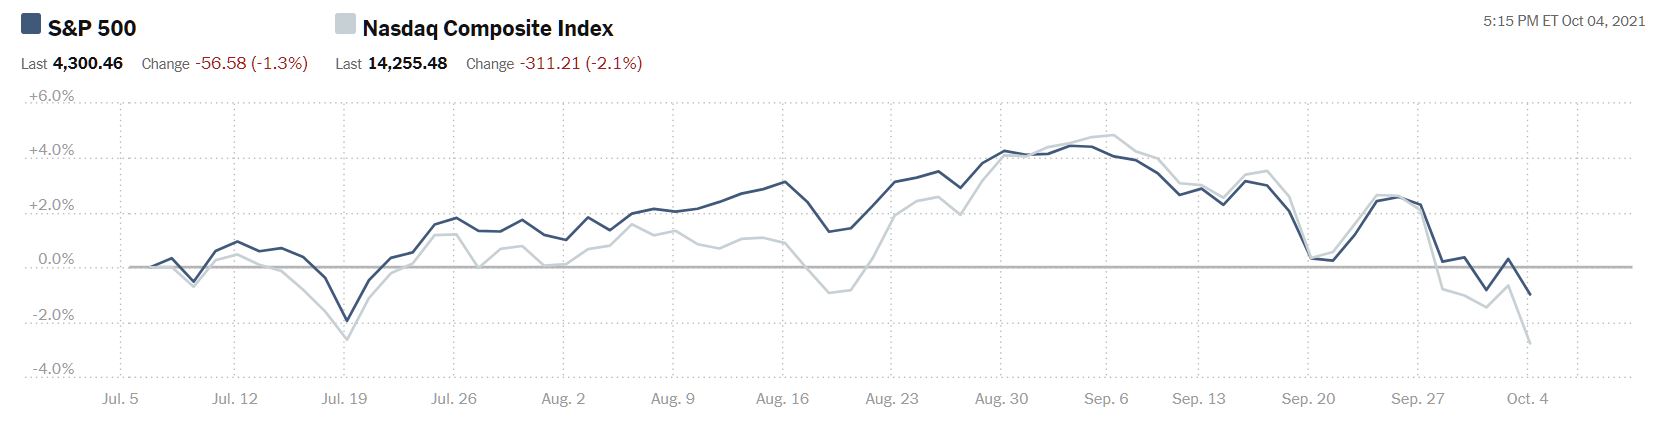
Yesterday the S&P 500 closed at 4,300, down 57 points or 1.3%, the Dow closed at 34,003, down 323 points or .94% and the Nasdaq Composite closed at 14,255, down 311 points or 2.14%. One can get a broader perspective of the downward action by looking at the 3-month chart below:
And this (monthly) close-up:
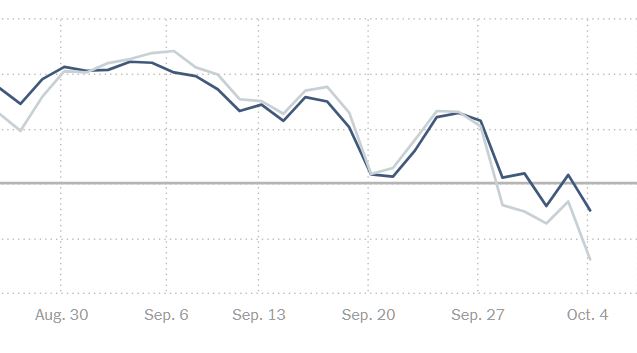
Charts: The New York Times
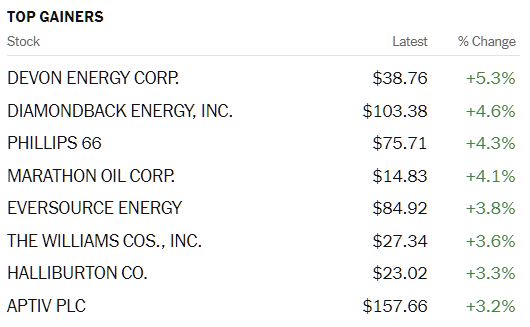
Monday's top Gainers were in the Energy and Oil sectors, while top losers were in tech. Solar energy software maker Enphase (ENPH) headlined that list with a one day take down of -6.6%. In the gainers column Devon Energy (DVN) led with an uptick of +5.3%. Stacked and racked below:
Gainers...
And Losers...

Currently market futures are green with S&P futures up 18 points, Dow futures up 131 points and Nasdaq 100 futures up 70 points.
The Staff at LMAX group in their short video Loss Of Confidence In US Government And Fed note that, "...concerns over US government disruption, which clearly weighed on investor confidence. Bickering between the Dems and Republicans around the debt ceiling and other things were behind this latest drag (downwards)..."
Time for a breather of good news. TalkMarkets contributor Ironman gives a rundown on Q3 dividend performance in Dividends By The Numbers In September 2021 And 2021-Q3.
"September 2021 closed out a strong quarter for dividend paying stocks in the U.S. stock market. Our first chart shows the number of dividend increases and decreases for each month from January 2004 through September 2021:

Here's the dividend metadata for the month, which compares September 2021 with the previous month of August 2021 and the year-ago month of September 2020.
- 5,205 U.S. firms declared dividends in September 2021, a decline of 55 from the 5,260 recorded in August 2021. That figure is also an increase of 1,607 over the 3,598 recorded in September 2020.
- There were 54 U.S. firms that announced they would pay a special (or extra) dividend to their shareholders in September 2021, a decline of one from the 55 recorded in August 2021 and an increase of 36 over the 18 recorded in September 2020.
- 70 U.S. firms announced they would increase their dividends in September 2021, a decline of 99 from the 169 recorded in August 2021 and an increase of 9 over the 61 recorded in September 2020.
- Eight publicly traded companies cut their dividends in September 2021, an increase of one over August 2021 count. That's a decrease of 4 from the 12 recorded in September 2020.
- Zero U.S. firms omitted paying dividends in September 2021, the same as August 2021. Year over year, that's down 18 from September 2020's figure."
Ironman also includes a stacked bar chart showing the number of firms increasing and decreasing dividends for the quarters Q3 2020 through Q3 2021.
And now back to our regular programming...
The Staff over at Bespoke Investment group explain how they see the beginning of October trading in a piece entitled First And Second Day Of The Quarter Volatility.
1. "A rally of more than 1% on the first trading day of a quarter is not that uncommon as it has happened just over 20% of the time since 1990. Since 1990, though, this quarter is on pace to be just the third time that a quarter has started with a 1%+ gain only to be followed by a 1%+ decline. The first occurrence was at the start of Q3 in 2000 just after the dot-com bubble burst. The only other occurrence was just over two years later at the start of Q4 2002 just as the 2000 – 2002 bear market was ending. Given the small sample size and the completely disparate paths of the S&P 500 following both periods, there’s really not much you can read from these two occurrences except perhaps that they were both periods of extreme volatility for the equity market."
2. "As far as the inverse situation is concerned, there are more occurrences when the S&P 500 dropped 1% on the first day of a quarter only to rally 1%+ the following trading day. Since 1990, this has occurred seven times. Occasionally, this signifies the bottom of a market pullback, such as April of 2020, April of 2018, October of 2011, and October of 1998. "
There are charts to illustrate the above sets of data in the article. However, as we read elsewhere: this is post-pandemic 2021 and the current economy can't be compared to anything that's come before it. Really?
With Energy and Oil at the forefront of the action TM contributor Thomas Westwater updates readers on just where crude oil and natural gas are in his piece Crude Oil, Natural Gas Forecast: OPEC, Seasonal Trends Put Bulls In Strong Position.
"The price of oil is responding to higher global economic activity as key economies exit strict Covid strategies and instead opt for a more lenient policy amid climbing vaccination rates. A sharp rise in natural gas prices is also helping feed the higher oil prices, as some utility operators switch to oil to produce energy. Natural gas rose nearly 35% in September versus crude oil’s 9.53% gain."
In addition...
"...the monstrous rise in natural gas prices helped tee up oil’s rise, and the heating gas looks set to remain in heavy demand. US storage levels for the heating gas remain below the 5-year average, according to the Energy Information Administration (EIA). That, along with increased export demand of liquified natural gas (LNG) from Europe and Asia, is likely to keep prices elevated as the Northern Hemisphere enters the heating season."
Hardly a question that both OPEC and Russia would like to see oil prices hit the $80 per barrel barrier and here readers are reminded that supply can also be a political issue, in addition to a demand one.
More from the Department of Gloom and Doom:
Contributor Greg Feirman in Inflation, The End Of The Bond Bull Market And The Second Great Depression presents a tutorial on inflation and cuts to the chase about how bad he thinks things are. The article provides both historical comparisons and charts. Here are some of the takeaways:
"For the first time in 40 years, we have real inflation in the US and the implications are enormous. It means the end of the 40-year bond bull market, a stock market crash, and The Second Great Depression."
"Crescat Capital (recently) outlined “The 3 Pillars of Inflation”. The first pillar is what they call demand-pull. Due to all the fiscal stimulus since COVID, the balance sheets of the bottom 50% are in great shape: “The total liability to asset ratio for the lower class is not only in a long-term downward trend, but it is now at its best condition in almost two decades”. All this money in their pockets will drive spending creating inflation from the demand side.
The second pillar of inflation is what Crescat calls cost-push. All of this demand is putting stress on the supply chain resulting in bottlenecks and raw material inflation for businesses. As I have recently written about, businesses such as Federal Express (FDX), Carmax (KMX), and Nike (NKE) are having trouble meeting the demand for their products and services. The retail inventory to sales ratio is at record lows.
The third pillar of inflation Crescat calls monetary debasement. As we all know, global central banks have been creating money out of thin air to buy financial assets (called “Quantitative Easing”) since 2008 but that process has gone parabolic since COVID."
Feirman concludes as follows:
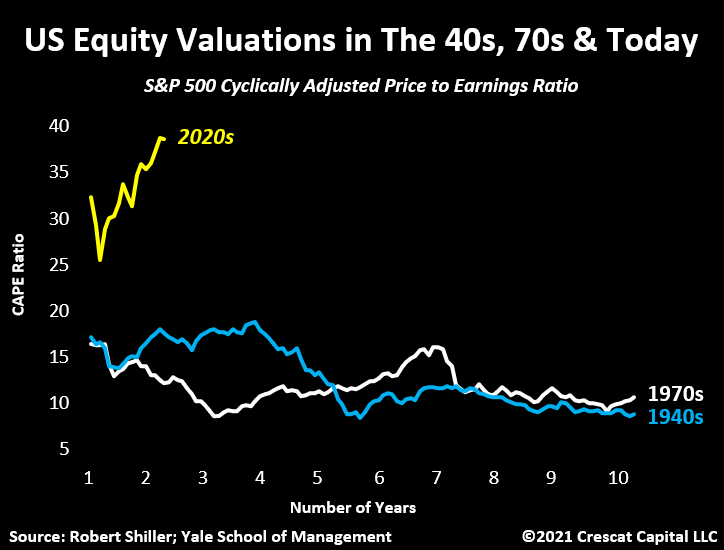
"Interest rates are a big deal for stocks because they affect intrinsic values through the discount rate used to value future earnings. The higher the discount rate, the lower the present value of future earnings. This especially hurts growth stocks, like technology, where a lot of the value lies in future earnings. Combine rising interest rates with record high valuations and you have the recipe for a stock market crash."
Included is this rather haunting chart as well:
To close out this week's column I draw your attention to Jeffrey P. Snider 's article What’s The Real Downside To Some Of These Key Commodities? which starts off by zeroing in on the effect of the semiconductor shortage in the automotive industry.
"Last night, Autodata reported its first estimates for September auto sales in the US. According to its own estimates as well as those compiled by the Bureau of Economic Analysis (the same government outfit which keeps track of GDP), vehicle sales have been sliding overall ever since April. For a couple of months in the middle of Uncle Sam’s helicopter-fed frenzy, the number of vehicle units had surged to a high of more than 18 million (seasonally-adjusted annual rate) in both datasets.
It’s been all downhill ever since, with estimates sales dropping to just barely 13 million (again, both) during August. For September, though, Autodata’s newly released figure was an astoundingly low 9.66 million.
How low is that? COVID-level low; bottom of the Great “Recession” territory. Off the (my) chart."

Snider continues further down in his article with at look at other commodities such as Palladium (PALL), Copper (JJC), Iron and Lumber and also, voices some disturbing thoughts that are easily lost among all the supply side charts and statistics:
"But is that all (supply chain issues)? ...there are more fundamental questions appearing more and moreover on the demand side...Something is going on here which defies in time and substance all the common explanations."
Read on and remember that it's October, a time for both scary tales and seasonal weakness in the stock market.
I'll see you next week. In the meantime, if you haven't been vaccinated, go and get jabbed.


