Tuesday Talk: Rally In The Alley
Yes, stocks did rally last Thursday only to fall back on Friday and move sideways on Monday, while managing to keep the S&P 500 above 4,000.
A picture is worth 1,000 words.
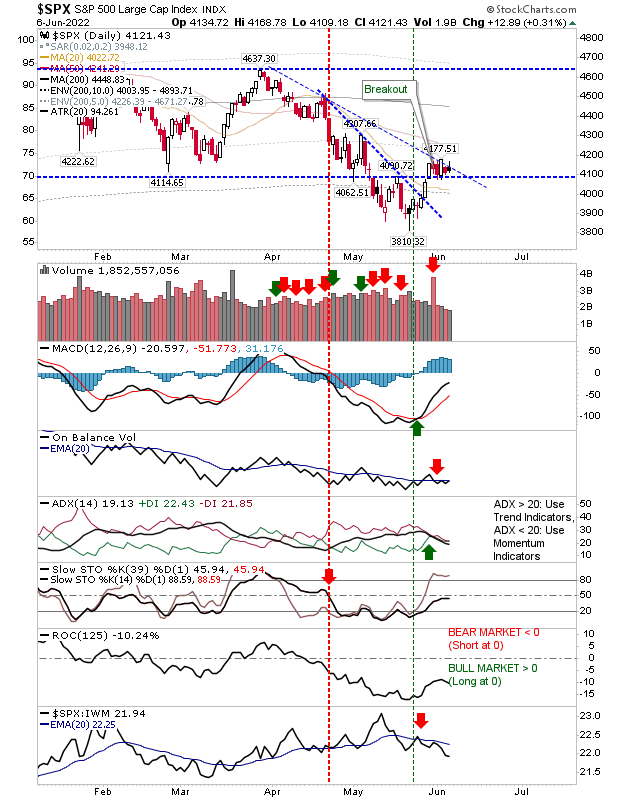
Yesterday the S&P 500 rose 13 points to close at 4,121, the Dow Jones Industrial Average closed at 32,916, up 16 points and the Nasdaq Composite gained 49 points, closing above 12,000 at 12,061.
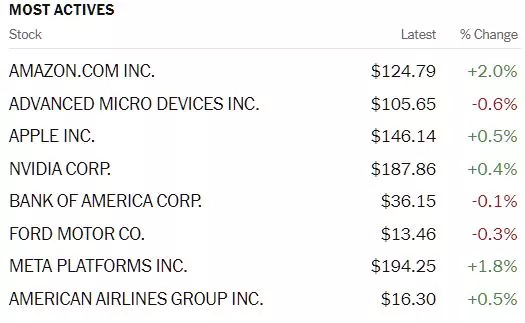
Most actives were a mix with post-split Amazon (AMZN) the number one mover, gaining 2% and closing at $124.79.

Chart: The New York Times
Morning trading in market futures is thus far red: S&P market futures are down 19 points, Dow market futures are down 137 points and Nasdaq 100 futures are down 79. One might expect more chop in the run-up to Friday's release of May CPI data.
TalkMarkets contributor Ryan Mallory asks What's Next For Stocks? in this 8 minute video:
Contributor Declan Fallon similar to Ryan Mallory in the video above is mostly waiting to see which way this current period of "market consolidation" plays out as he runs us through Monday's charts in his article, Black Candlesticks Are A Warning, But Not Necessarily A Reversal.
"When you see 'black' candlesticks; i.e a higher open, a lower close, but a close still above the prior day's close - you need to pay attention. The only good thing is that these warnings typically only matter when 'black' candesticks occur at the end of a rally - not in the middle of a mini-consolidation. "

"The S&P remains primed to accelerate beyond declining resistance but was pegged back by today's close despite the intraday move higher. Technicals haven't changed from yesterday, but there is room for optimism for stochastics and on-balance-volume." (SPY)

"The Russell 2000 (IWM) did end with a 'black' candlestick at the end of a rally and is vulnerable to a gap down tomorrow. The 'black' candlestick has also occurred at 50-day MA resistace. Assuming a down day tomorrow, we need to consider if mini-breakout support can hold (near $182).
The bearishness of today's candlestick will be undone if there is a close above the open of the 'black' candlestick. The Russell 2000 is the index to watch as while I like its bullish tendencies, it had the weakest finish today. "
See Fallon's article for the Nasdaq chart.
TM contributor Forrest Crist-Ruiz cautions 3 Things Need To Align For The Next Big Market Move.
"Let's analyze what to look for next in the SPY and QQQ along with the subtle clues volume can give when watching for the next big price move.

Looking at the SPY, if we want to clear our mini consolidation area, we will need to pass $417.44.
If this price level does clear, next we can look for momentum to follow with RM clearing over its 50-DMA.
When using RM (Real Momentum) as a trade confirmation indicator, it helps to wait for both price and RM to align, meaning that both price and RM will have to trade over its 50-DMA to show agreement.
The same goes for the tech-heavy Nasdaq 100 (QQQ) which also has RM and price underneath its 50-DMA.
With that said, let’s turn our focus on volume.
Notice that across-the-board volume is lower than average.
This is one reason why Monday’s attempted breakout in IWM didn’t work.
While low volume is fine for consolidation areas, when looking for meaningful breakout days, it helps if a pivotal price is cleared along with increased volume.
Price will often continue in the breakout direction if accompanied by high volume.
Therefore, we have 3 things to watch for when looking for the next major market move to the upside.
Big volume days, momentum confirmation, and for our pivotal price levels to clear and hold over Thursday’s high of last week."
Moving over to the Statistics Department contributor Jill Mislinski takes a look at The Big Four Economic Indicators: May Employment
This article is a big deep dive into the stats and charts. I've just included a smidgen of what's on offer, below:
"Official recession calls are the responsibility of the NBER Business Cycle Dating Committee, which is understandably vague about the specific indicators on which they base their decisions. This committee statement is about as close as they get to identifying their method.
There is, however, a general belief that there are four big indicators that the committee weighs heavily in their cycle identification process. They are:
- Nonfarm Employment
- Industrial Production
- Real Retail Sales
- Real Personal Income (excluding Transfer Receipts)"
The chart and table below illustrate the performance of the generic Big Four with an overlay of a simple average of the four since the end of the most recent recession (2020). The data points show the cumulative percent change from a zero starting point for April 2020."

"The NBER declared the recent recession to be just two months, ending in April 2020. This is the shortest recession on record - here is their announcement on the topic.
Retail sales bounced back most rapidly, due to pent-up demand and savings by consumers. This continues to improve but causes issues for producers and suppliers.
Industrial Production has shown the second-best recovery out of the four. Producers and suppliers struggle with limited inventory and continued supply-chain issues.
Employment has improved since the official "end" of the recovery, but employers cannot fill many open positions for a variety of reasons.
Real income has shown the weakest recovery. Income has been an ongoing issue in terms of trends and matching inflation over the years.
Here is a percent-off-high chart based on an average of the Big Four. The average set a new all-time high in November of 2018."

Still in the Statistics Department, TalkMarkets contributor Ironman notes Mortgage Payments For Median New Homes Rocket Upward.
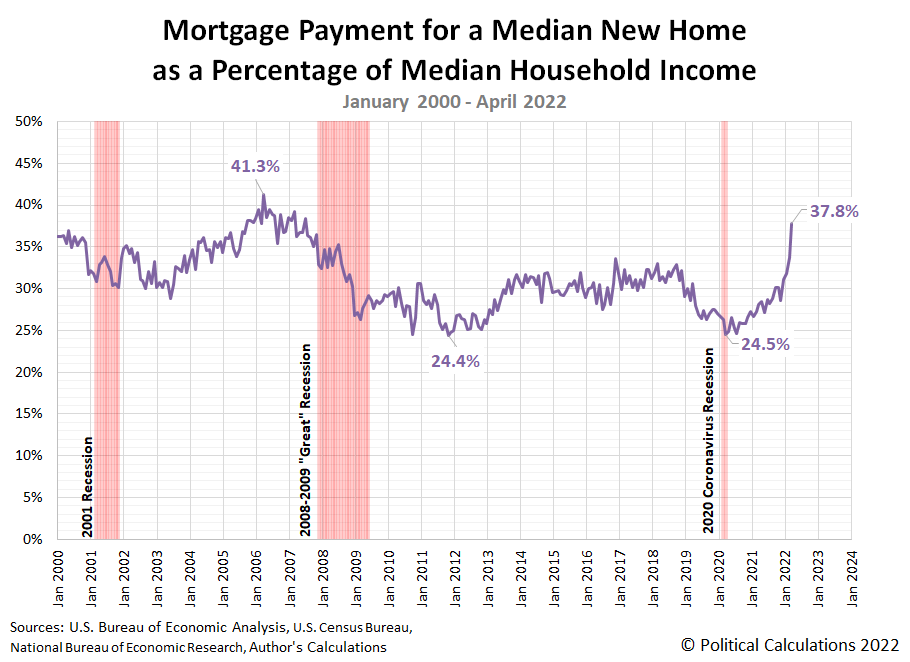
"After reaching a new low for affordability in March 2022, the median new home in the U.S. became even less affordable for the typical American household in April 2022.
That's especially clear in the following chart. It shows the basic mortgage payment for a median new home as a percentage of median household income rocketed up from 33.8% of that income in March to 37.8% in April 2022."

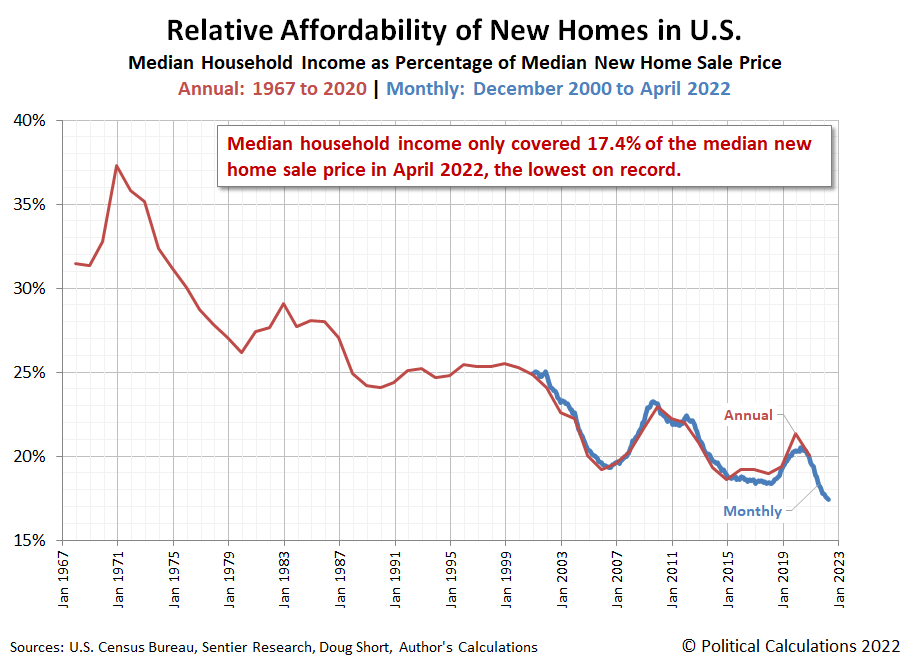
Our next chart confirms the raw affordability of new homes has achieved a new record low.

When it's ugly, it's ugly and when it's not, it's not. It's ugly.
Have a good one.


