
Tuesday Talk: Back In The Same Place
It's been quite a month, in fact it's been quite a summer but with two trading days left to go in August the market indices are back to about where they started.

One might have expected a spring-back from last Friday's tumble yesterday, but it was not forthcoming; though today may see a bit of a rebound. At the close of trading on Monday, the S&P 500 was down 27 points, closing at 4,031, the Dow Jones Industrial Average was down 184 points, closing at 32,099 and the Nasdaq Composite was down 124 points, closing at 12,017.
A look at the 1 month and 3 month charts show that for all its running around our proverbial hound is back on the bench wondering which way to go next:
August M-t-D
8/3 close: S&P 500 4119, Nasdaq Composite 12,369

May 31 - August 29
5/31 close: S&P 500 4132, Nasdaq Composite: 12,081

Charts: The New York Times
Monday's most actives were mostly down, and some of the issues are ones that have been around the block more than once, summer to date.

Chart: The New York Times
The game is afoot this morning with S&P market futures currently trading up 33 points, Dow market futures trading up 212 points and Nasdaq 100 market futures trading up 141 points.
Contributor Mish Shedlock writes that The Fed Is Openly Cheering The Stock Market Plunge Following Jackson Hole.
"Actively Promoting Bubbles
The Fed actively promoted a housing bubble to bail out banks following the DoCom crash. Of course, the DotCom bubble was openly embraced by Greenspan as a productivity miracle.
Not understanding bubbles and crashes, the Fed promoted the "Everything Bubble" as it is now called in response to the housing crash and great recession.
Finally, the Fed actively promoted the biggest bubble of them all in response to the Covid pandemic by the most QE and monetary stimulus ever coupled with the biggest fiscal stimulus in history.
Actively Popping Bubbles
Now, the Fed has decided it does not like the inflation it created.
The only way it knows how to fix inflation is via demand destruction. The way to do that is to kill the wealth impact from the bubbles it created.
So now the Fed is cheering the stock market decline.
Gaps Galore on the Stock Market, Where Is the Market Headed and When?
I think the S&P is headed to the 2400 level and the Nasdaq to the 6,000 level.
That's roughly a 50% decline from the top on the S&P 500 and a 64% decline from the top on the Nasdaq."
Careful, reading that is enough to make you spill your coffee, I almost did. ![]()
More interesting perhaps are the quotes from the Minnesota Fed President, Neel Kashkari which Shedlock also, includes in his article.
""I was actually happy to see how Chair Powell's Jackson hole speech was received,” Kashkari said in an interview with Bloomberg’s Odd Lots podcast on Monday, reflecting on the steep drop after Powell spoke. “People now understand the seriousness of our commitment to getting inflation back down to 2%.”
“I certainly was not excited to see the stock market rallying after our last Federal Open Market Committee meeting,” he said. “Because I know how committed we all are to getting inflation down. And I somehow think the markets were misunderstanding that.”
“One of the biggest mistakes they made in the 1970s at the Fed is they thought that inflation was on its way down. The economy was weakening. And then they backed off and then inflation flared back up again before they had finally quashed it,” Kashkari said. “We can't repeat that mistake.”"
TM contributor and stock maven Michael Kramer posits Maybe It’s Time For The Market To Stop Fighting The Fed?
"The S&P 500 fell 67 bps on August 29, a modest decline following the sharp sell-off on Friday. The index had a very weak close, finishing below the afternoon’s lows. Additionally, it appeared to spend the day consolidating after filling the opening gap.
The S&P 500 futures may show the picture the best, as it appears to have formed a bear flag. The flag started developing very early today and continues to consolidate all day. If the flag breaks lower, which I think it will, then the S&P 500 should fall comfortably in that 3,950 range we have been talking about for some time.

"If it wasn’t clear that the Fed needs stocks to fall to tighten financial conditions to beat inflation, it should be very clear now. "
TalkMarket contributor Alex Barrow lays out the way forward in an Editor's Choice column entitled 100% Recession Odds. It's a long piece, with his usual twelve charts and well worth your full attention. Below is some of what he has to say.
"This is my base case for the path of the market as of now. A strong selloff this week followed by a bottom and hard reversal that leads to another leg up. The environment is fast-moving, and there are many variables at play, so naturally, my conviction is low." - Note the broken-red line on the chart takes you to June 2023.

"The market recently saw a number of breadth thrusts fire. Breadth thrusts are a solid point for the bulls. They mark instances of large buying pressure. These types of demand imbalances are what drive large trends. The chart below shows the % of stocks trading above their 50-day moving average (yellow) and 200-day moving average (white). The red triangles mark instances where the % of stocks above their 50dma jumped above 80% while the % above their 200dma was recently below 20%. This marks a strong breadth thrust from broad oversold conditions (the index below is the Russell 3k)."

"The 12 (green) and 24-month (tan) US recession probability model has perked up dramatically over the past two months. This probability model uses 17 various hard econ, financial, and market inputs to assess the probability of a recession over the coming 12 and 24 months. It currently assigns a 100% probability of a recession within the next two years and a 30% probability of one within the next 12 months.

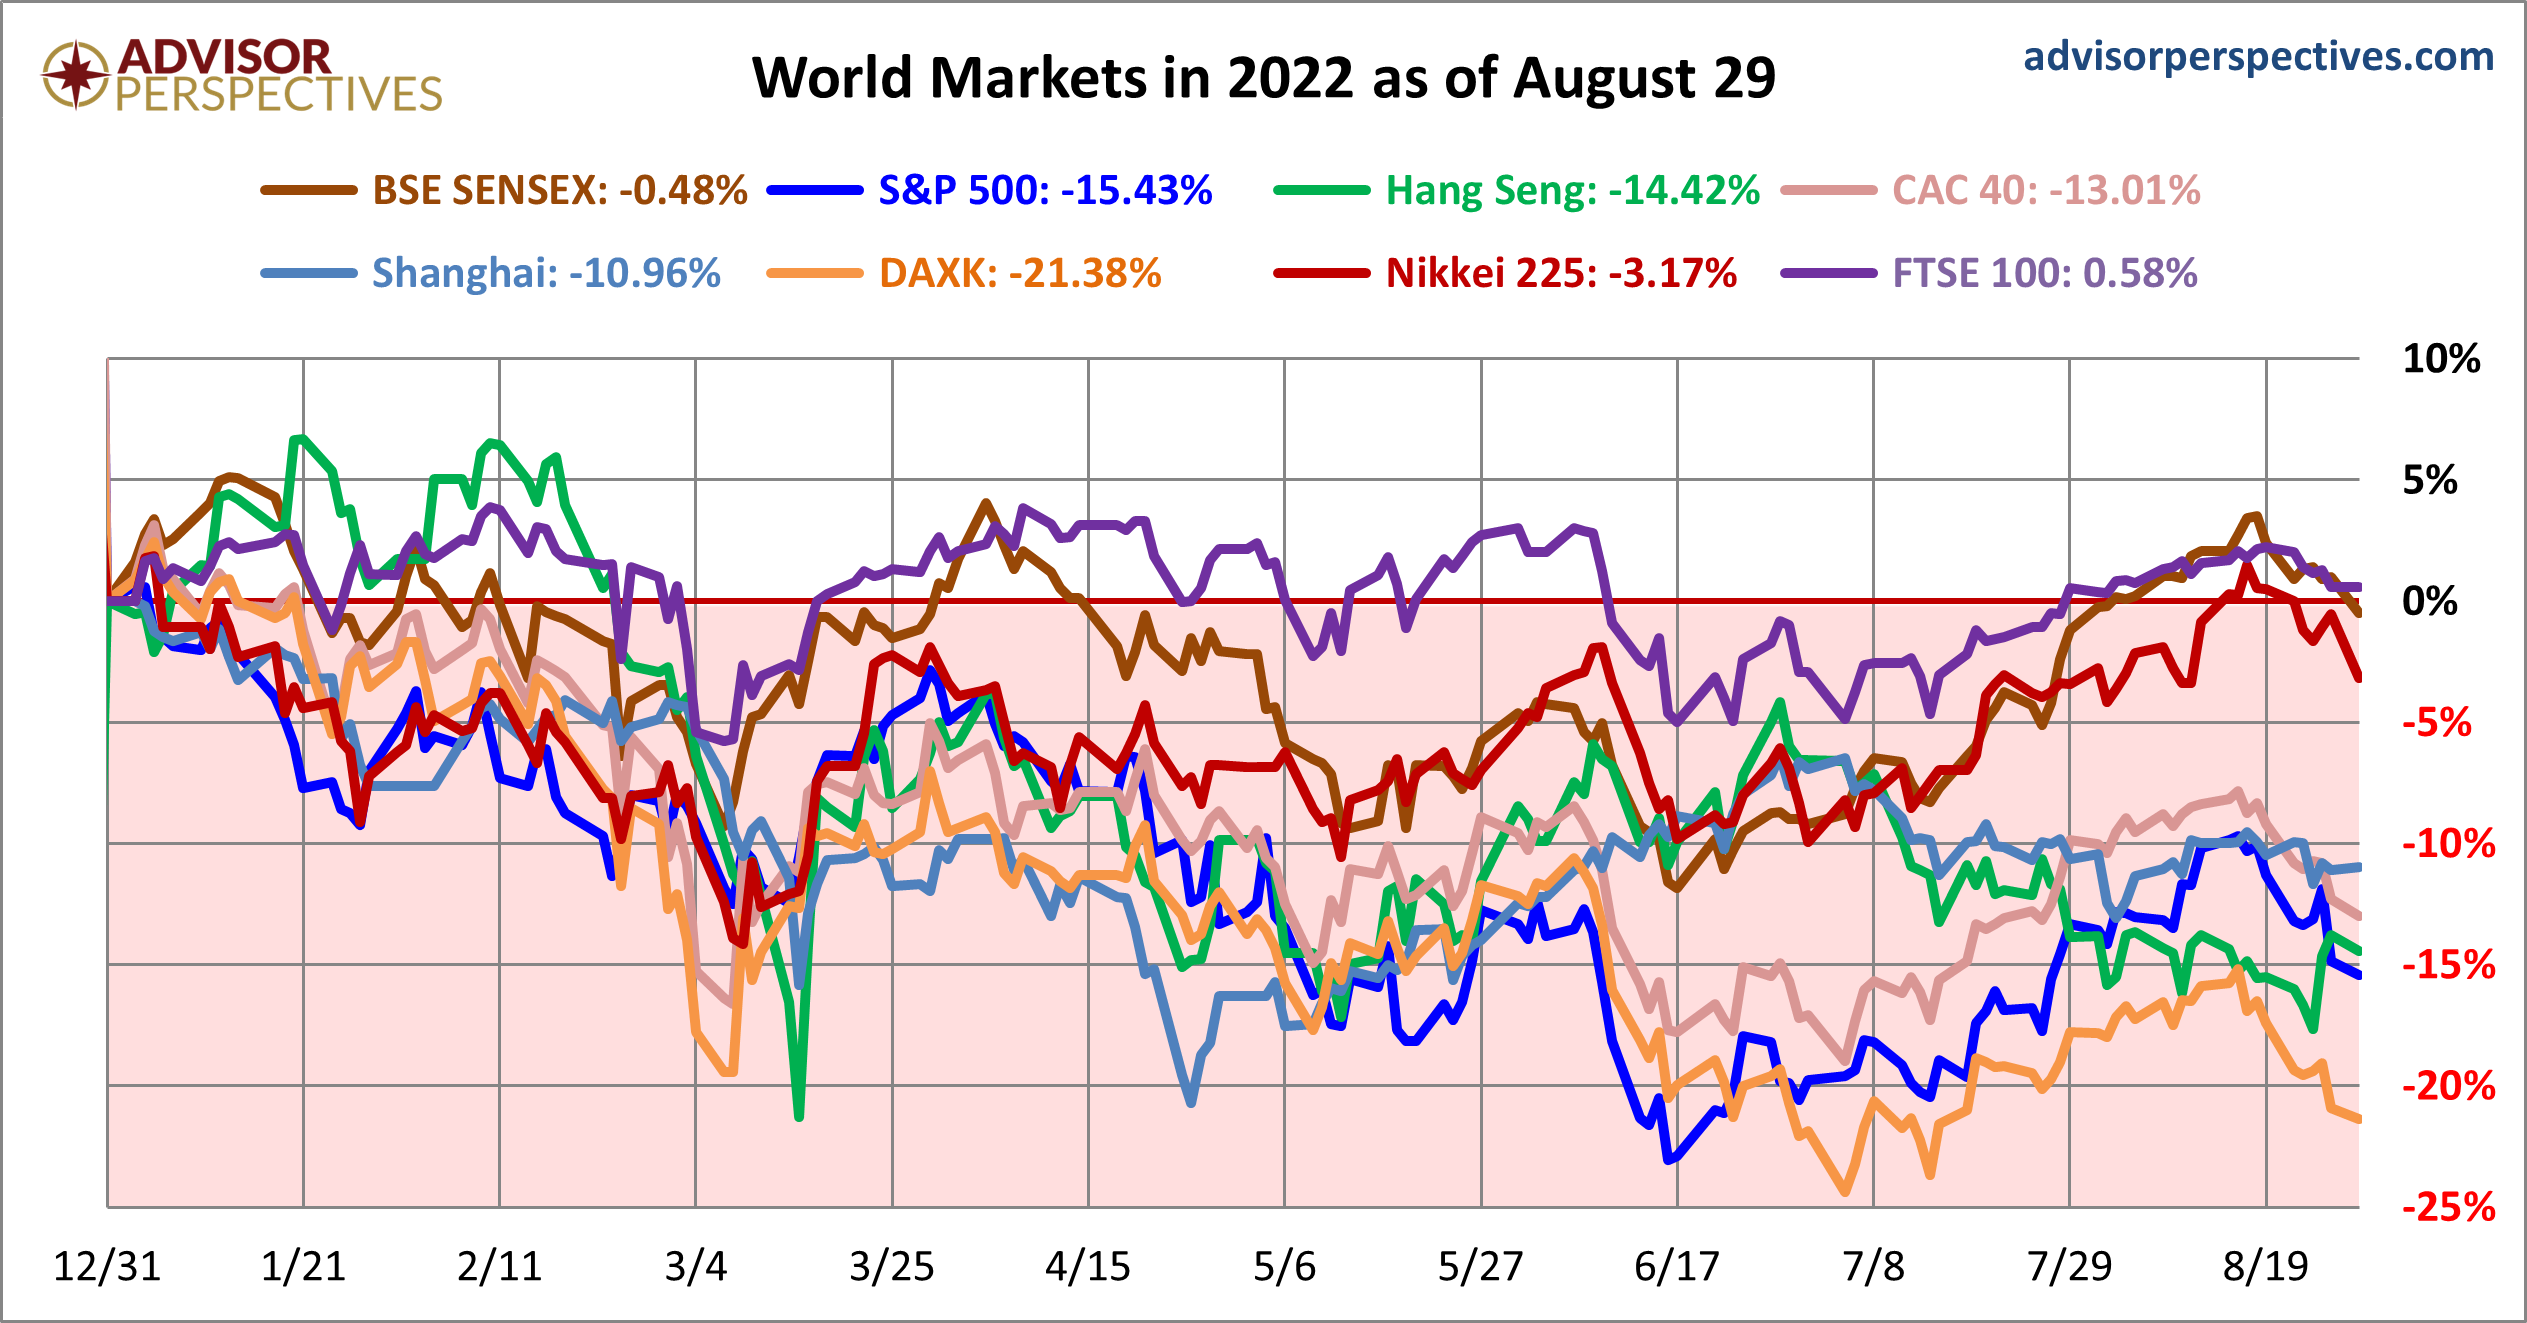
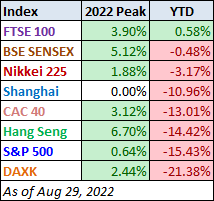
Just how good or bad are world markets faring year to date? Contributor Jill Mislinski provides the following look in her World Markets Update - Monday, Aug. 29.
"One of eight indexes on our world watch list posted gains through August 29, 2022. The top performer is London's FTSE 100 with a YTD gain of 0.58%. India's BSE SENSEX is in second with a loss of 0.48% and Tokyo's Nikkei 225 is in third with a loss of 3.17%. Coming in last is Germany's DAXK with a loss of 21.38% YTD."
In passing contributor Christopher Lewis notes that the Euro-Dollar rate Continues To Bounce Around The Parity Level.
"The EUR/USD has gone back and forth during trading on Monday, as we continue to see the parity level attract a lot of attention. It’s worth noting that the market is simply chopping around...That does make a certain amount of sense that we are going to continue to see a lot of confusion around this area, just simply because there’s a lot of psychology attached to the idea of parity. The US dollar will continue to be stronger than the Euro in general since the European Union has a whole host of issues that the United States does not have to deal with."
In the "Where to Invest Department" TalkMarkets contributor Aristofanis Papadatos spotlights 3 Oil Refiners To Hold For Dividends.
"Given the prevailing uncertainty and the material downside risk, it is only natural that investors are looking for safe havens. Oil refiners have provided a safe haven to their shareholders so far, as they have outperformed the S&P 500 by an impressive margin. To be sure, while the S&P 500 has declined 16% this year, Valero Energy (VLO), Marathon Petroleum (MPC) and HF Sinclair (DINO) have rallied 60%, 60% and 63%, respectively."

Here are a few comments for each company. See the full article for more details.
"Valero
Valero is currently offering a dividend yield of 2.4%. As the company has a payout ratio of only 17% and a solid balance sheet, its dividend is safe for the foreseeable future. On the other hand, as the stock has enjoyed a breathtaking rally this year, its dividend yield has fallen to an 8-year low level. Given also the high cyclicality of refining margins, investors should probably wait for a more attractive entry point.
Marathon Petroleum
Given the blowout refining margins, which have remained in place in the running quarter due to the war in Ukraine, the company is on track to achieve record earnings per share of about $20.00 this year.
Marathon is currently offering a dividend yield of 2.2%. As it has a payout ratio of only 12%, its dividend should be considered safe. On the other hand, just like Valero, Marathon is currently offering an 8-year low dividend yield due to its relentless rally. Therefore, investors should probably wait for a more opportune entry point.
HF Sinclair
HF Sinclair enjoys ideal business conditions this year. In the second quarter, its refining margin more than tripled over the prior year’s quarter, from $11.7 to $36.4 per barrel...HF Sinclair is poised to achieve record earnings per share of about $12.80 this year.
HF Sinclair has reinstated its dividend and is now offering a 2.9% dividend yield. The stock has a payout ratio of only 13% and hence its dividend is entirely safe. It is also worth noting that its dividend yield is significantly higher than the yields of Valero and Marathon. Given also that HF Sinclair has the strongest balance sheet in its peer group, the stock seems more attractive than its peers."
Caveat Emptor.
That's a wrap for today.
Have a good one.

More By This Author:
TalkMarkets Image Library
Thoughts For Thursday: Waiting By The Fishing Hole
Tuesday Talk: The Moose In The Room


