
Tuesday Talk: A Pause Before The Santa Claus Rally
Before heading out for the Thanksgiving holiday amidst a strong forward blast in the stock market, some commentators were noting that the Santa Claus rally had arrived early. This morning after yesterday's more or less static performance commentators are saying a correction of sorts may be in the offing before the kick-off of said Santa Claus rally. Caution and patience advised.

Monday the S&P 500 closed at 4,550, down 9 points, the Dow closed at 35,333, down 57 points, and the Nasdaq Composite closed at 14,241, down 10 points.

Chart: The New York Times
Top gainers on the day were led by Domino's Pizza (DPZ), up 4.5%, followed by International Paper (IP), up 3.6%, and Crown Castle Inc. (CCI), up 3.4%.

Chart: The New York Times
In morning futures trading, S&P 500 market futures are trading down 9 points, Dow market futures are trading down 29 points, and Nasdaq 100 market futures are trading down 39 points.
TalkMarkets contributor Mark Vickery writes Successful Cyber Monday, Markets Take Profits.
"Another successful Cyber Monday is in the books — well, it still continues past the closing bell, but it has helped keep an otherwise profit-taking trading day from giving too big a sell-off. All four major indices closed the day in the red, though marginally: the Dow was -56 points, -0.16%, the Nasdaq was -0.07%, the S&P 500 -0.20% and the small-cap Russell 2000 -0.35%.
This Cyber Monday saw 77 million U.S. consumers participate in temporary sales on goods, most of which are for the benefit of early holiday shopping. This is in-line with data we saw two years ago. As for the first full week of holiday shopping, both in-store and online, we see a +9.8% increase year over year. This accounts for 76% of all U.S. consumers shopping this past week, up +6% from 2021. This has been especially beneficial to companies such as Affirm (AFRM), which gained +12% today."
Contributor George Valantasis discusses The November 2023 Rebalance Of The S&P 500 Low Volatility Index.
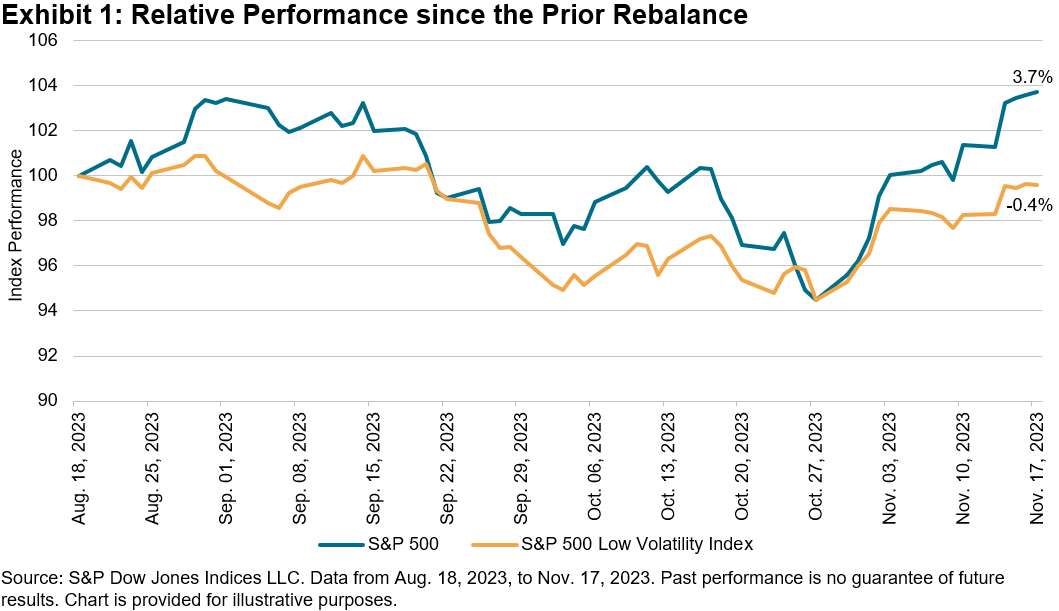
"The S&P 500® continued its strong performance this year after posting a 9.8% gain in a span of less than three weeks from Oct. 30 to Nov. 17, 2023. During this period, the 10-year U.S. Treasury yield dropped approximately 45 bps1 and October’s year-over-year headline CPI inflation cooled to 3.2%.2 As Exhibit 1 shows, since the previous rebalance for the S&P 500 Low Volatility Index on Aug. 18, 2023, through the most recent rebalance on Nov. 17, 2023, the S&P 500 was up 3.7%, versus a decline of 0.4% for the S&P 500 Low Volatility Index. This type of divergence can happen especially during periods of strong performance and low volatility for the S&P 500. During this period, the annualized daily standard deviation for the S&P 500 was a relatively low 13.6%.
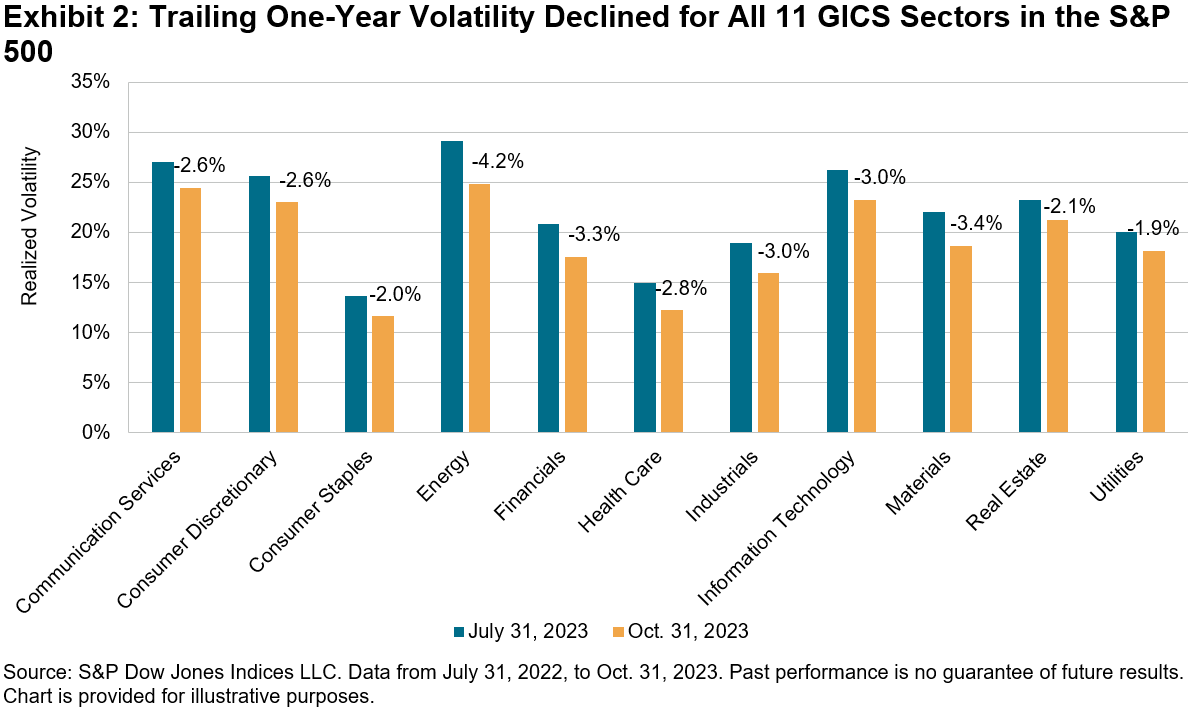
As Exhibit 2 shows, the trailing one-year volatility decreased for all 11 GICS sectors from July 31, 2023, to Oct. 31, 2023. The widespread decline in volatility across all 11 GICS sectors followed the same pattern in the three months prior to this period. Measured in absolute terms, volatility decreased the most for the Energy sector, although it remained the most volatile sector at 24.9%. As of Oct. 31, 2023, Consumer Staples was the least volatile sector, with a daily realized volatility of only 11.6%.
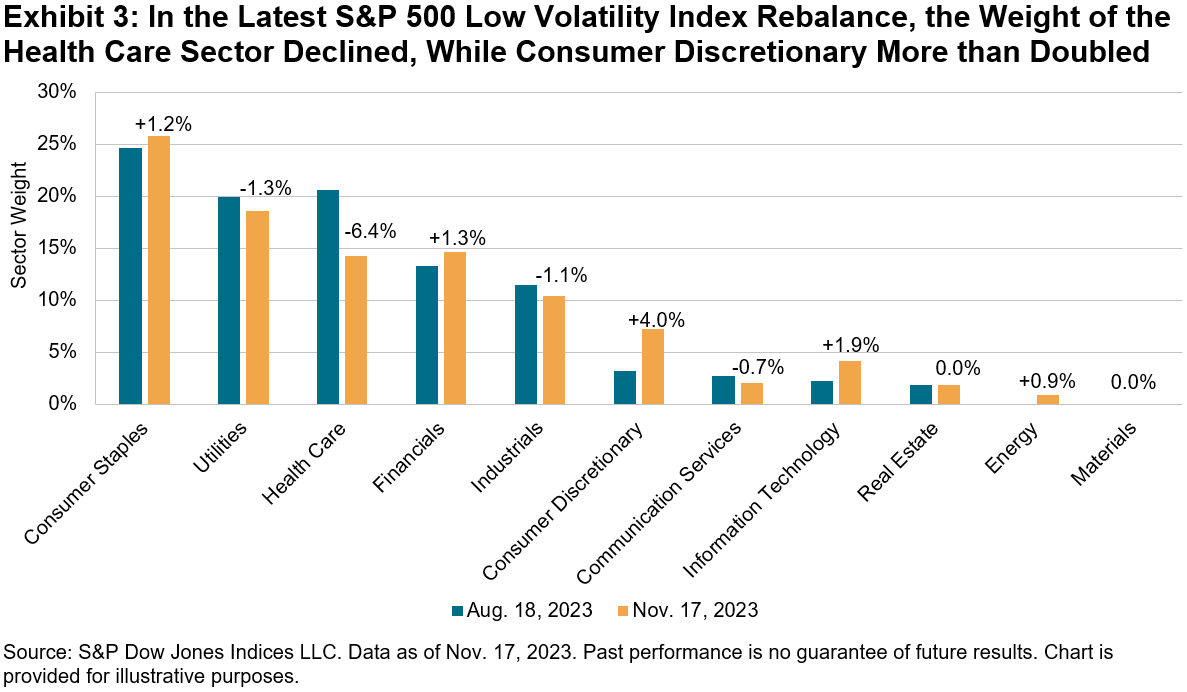
Amid the overall decrease in volatility, the latest rebalance of the S&P 500 Low Volatility Index brought some material changes to sector weightings, most notably in the Health Care and Consumer Discretionary sectors.
Following the most recent rebalance, Health Care’s weight dropped by 6.4%. Approximately 4.0% shifted to the Consumer Discretionary sector, more than doubling its weight to 7.3%. Other notable recipients were the Information Technology sector, which saw its weight almost double from 2.3% to 4.2%, as well as the Consumer Staples sector, which increased its weight to 26%."
Once again economist and contributor Menzie Chinn takes up the question of a Soft Landing?

"I’ve wondered about what a “soft landing” entails, and whether we are headed toward one. This is despite findings that, based on historical correlations, just about any term spread-based regression will predict a recession by around mid-2024.
Booker and Wessel discuss the issue of soft landings, and cite this table adapted from Blinder.
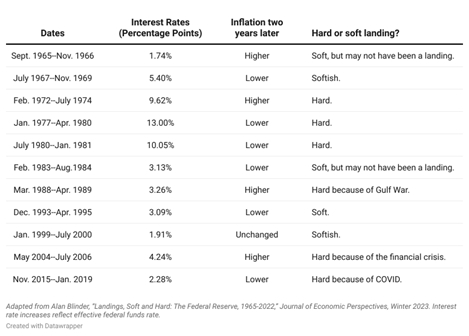
Source: Boocker and Wessel (2023).
I’d only been familiar with the 1993-95 and 1999-2000 episodes. I think it of interest to compare the 1993-95 episode to the current, in terms of real rates and GDP. First, 1993-95:
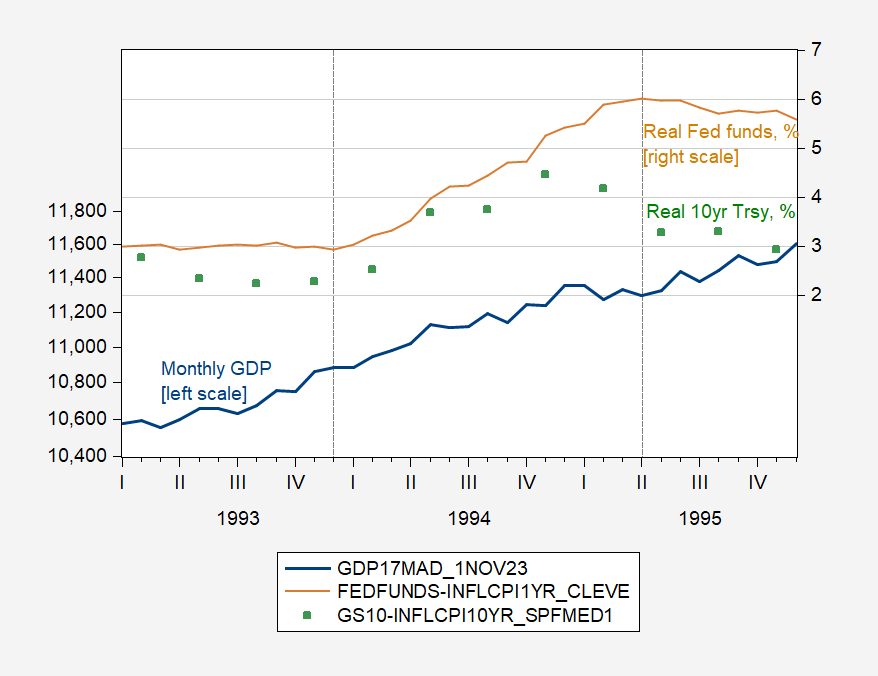
Figure 1: Monthly GDP in bn.Ch.2017$ SAAR (blue, left log scale), Fed funds adjusted by Cleveland Fed 1 year expected inflation, % (tan, right scale), and ten year Treasury yield adjusted by SPF 10 year median expected inflation, % (blue, right scale). Dashed lines at Boocker-Wessel-Blinder soft land start/end. Source: SPGMI, Federal Reserve Board and Treasury via FRED, Cleveland Fed, Philadelphia Fed, and author’s calculations.
And here’s the current episode of some sort of landing, yet to be determined…
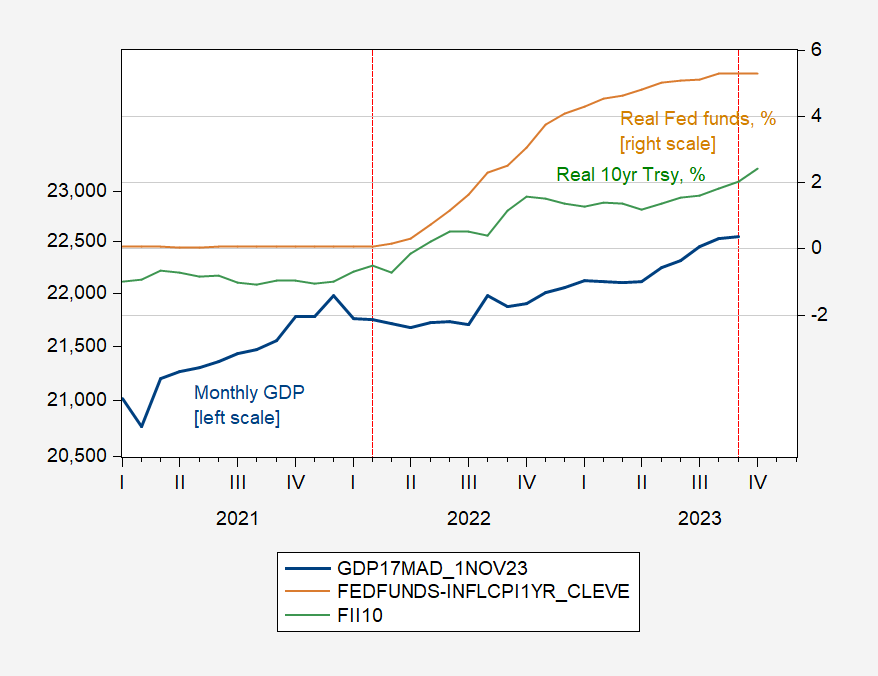
Figure 2: Monthly GDP in bn.Ch.2017$ SAAR (blue, left log scale), Fed funds adjusted by Cleveland Fed 1 year expected inflation, % (tan, right scale), and ten year TIPS, % (blue, right scale). Dashed lines soft land start/end as determined by author. Source: SPGMI, Federal Reserve Board and Treasury via FRED, Cleveland Fed, and author’s calculations.
The recent episode has witnessed a larger jump in real Fed funds rate (over 4.5% vs. 3%), a similar increase in the real 10-year Treasury, while output actually decreased when the Fed funds rose (in 2022Q2) while it continued to rise in 1994. Also in contrast, by the end of the soft landing as defined by Blinder, the 10-year real rate was declining, while in the current episode, that rate continues to rise.
The debt service ratio has risen more, as a consequence of the larger interest rate increase.
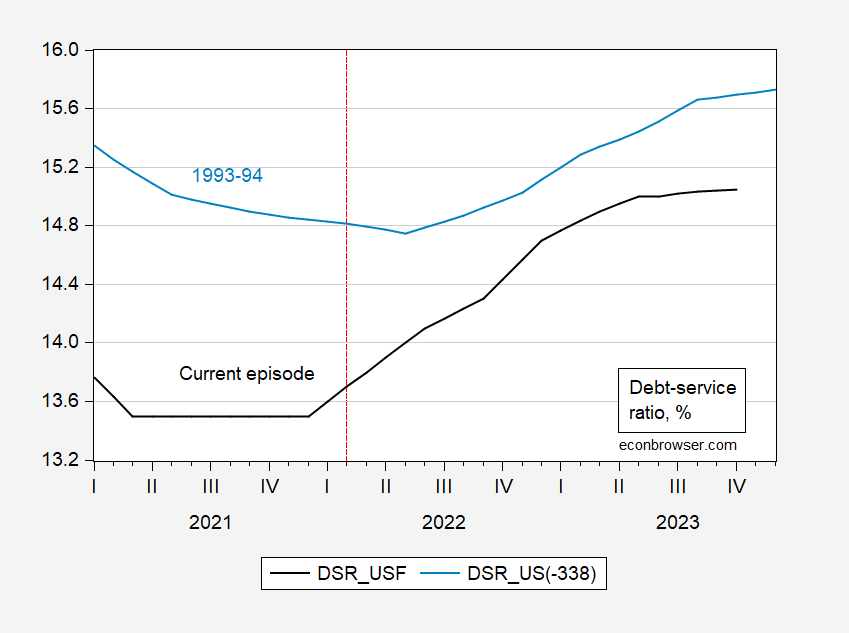
Figure 3: Debt service ratio for private nonfinancial sector now, in % (black), in 1993-95 in % (light blue). 2023M04-10 period extrapolated using 3 month interest rate in first differences. Source: BIS, and author’s calculations.
According to my guesstimates, the debt service ratio trajectory has flattened (actual data only extends up to 2023M03), but at a level substantially higher than existed before tightening began.
As the soft landing calls continue, it’s useful to recall that if historical correlations hold, recession probabilities from spread-based probit models breach the 50% threshold around November-December of this year and peak around May-June 2024.
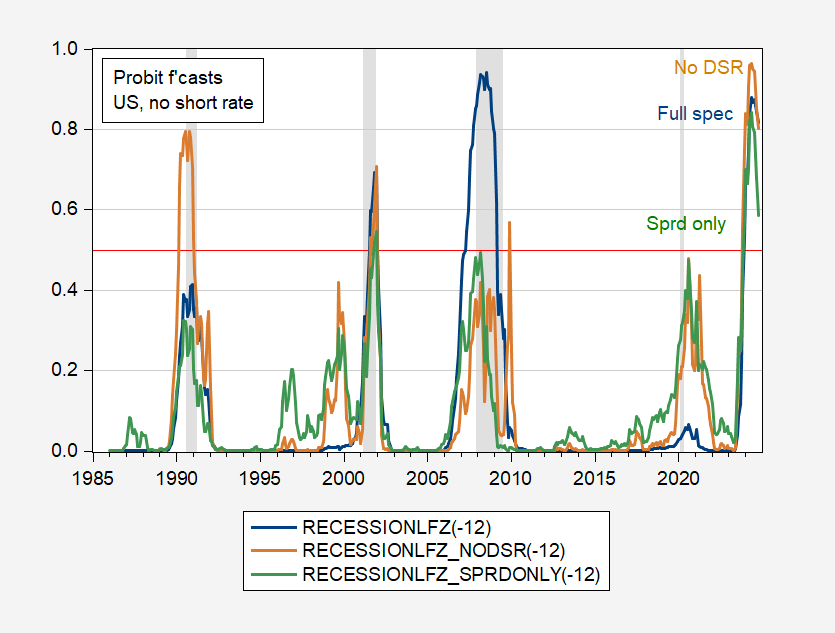
Figure 4: Recession probability from probit model with only 10yr-3mo spread (green), spread, NFCI, foreign term spread (tan), and spread, NFCI, debt-service ratio, foreign term spread (blue). NBER defined peak-to-trough recession dates shaded gray. Source: Author’s calculations, NBER.
The important caveat is that historical correlations hold."
Contributors Warren Patterson and Ewa Manthey note that Gold Holds Above $2,000.

"Gold climbed to its highest level since May yesterday amid USD weakness and lower US Treasury yields. The market will be closely watching US data releases this week, including inflation data and Q3 GDP numbers. Meanwhile, gold premiums in Asia, particularly in India and China, have been under pressure as higher prices hamper seasonal demand. Gold dealers in India were heard to be offering discounts of up to US$6/oz (vs. US$3/oz a week earlier) over official domestic prices, while premiums in China fell to US$20-US$40/oz (vs. US$43-US$58/oz a week earlier) over global spot prices last week.
In base metals, aluminum prices have been supported by ongoing production curbs in China’s southern Yunnan province. Smelters in the region are reportedly planning to reduce aluminum output again this winter amid declining hydropower supply during the dry season. A total 1.16 mtpa of aluminum smelting capacity is set to be halted and is expected to remain offline until May 2024, when the rainy season usually begins. This will mark the third consecutive year that Yunnan smelters have reduced output during the dry season. Further cuts are possible."
See the full article for additional commodity updates.
Lance Roberts writes Stock Market Correction Coming Before The Santa Claus Rally.
"Is a stock market correction coming before the Santa Claus rally at the end of the year?
It is a fascinating turn in sentiment, given that investors were convinced of the bear market’s return just a month ago. Now, investors are “making their list and checking it twice.” Given the 10% advance over the past month, it isn’t surprising, as hope rises that the Fed will return to more accommodative policies next year. Earnings remain very “nice,” and the market views the economic risks as primarily priced in.
There are indeed “naughty” economic indicators, but the market seems convinced it will all be transient. Furthermore, companies seem to be able to pass costs along to consumers, at least for now. The hopes are high that profit margins will remain strong and earnings will eventually catch up to valuations.
Investors’ “wish lists” are hung by the chimney with care, hopeful the “Santa Claus rally” will soon be there. While they remain “snug in their beds, the historical data dances in the heads.” The chart below from EquityClock.com shows the annual S&P 500 index “seasonality.”

There is little to worry about, and a significant stock market correction is unlikely.
However, notice that dip at the beginning of December...
The one thing the market does well is doing precisely the opposite of what you would expect.
However, there is a strong likelihood that with the market short-term overbought, deviating from the 50-DMA, and volume declining, any additional selling pressure from mutual fund distributions could pressure prices short-term. As shown, a correction generally occurs whenever most indicators are as overbought as they are currently. That does NOT mean the bull market is over. It only means that before the market can move higher, it needs a healthy reset to bring buyers back into the market."
See the full article for a more in depth explanation.
Contributor James Picerno notes US Q4 GDP Nowcast Still Points To Moderate Growth.
"The recession that was widely predicted when the year began has only been postponed, some forecasters warn. The US is likely to contract at some point in the new year, runs the updated outlook. Maybe, but 2023 remains on track to exit this year in a growth mode, according to the latest nowcasts.
US output for Q4 is projected to increase at an annualized 2.0% for GDP in the final three months of 2023, based on the median for a set of estimates compiled by CapitalSpectator.com. The current nowcast reflects a sharp deceleration from the 4.9% surge reported for Q3, but today’s revised Q4 median data still suggests that recession risk will remain low for the remainder of the year.

Today’s update for Q4 output is virtually unchanged from the previous estimate published on Nov. 16. The stability is encouraging because it suggests that incoming data aligns with a moderate growth trend."
Ending today's column on a slightly somber note, TM contributor Tim Knight provides this chart in A Nation Of Debtors.
"The citizens of the U.S. are simply aping what their fallen republic is doing – – borrowing with abandon and pretending everything is just peachy. This. Is. Not. Sustainable."

Have a good one.
Peace.
More By This Author:
Tuesday Talk: Thanksgiving Week
Thoughts For Thursday: The Market Is Firming Higher, Tread Carefully
Tuesday Talk: What's Going On?


