Soft Landing?

Image Source: Pixabay
I’ve wondered about what a “soft landing” entails, and whether we are headed toward one. This is despite findings that, based on historical correlations, just about any term spread-based regression will predict a recession by around mid-2024.
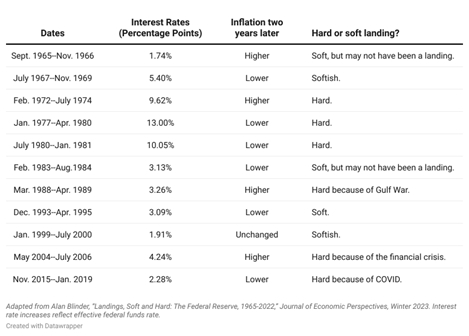
Booker and Wessel discuss the issue of soft landings, and cite this table adapted from Blinder.
Source: Boocker and Wessel (2023).
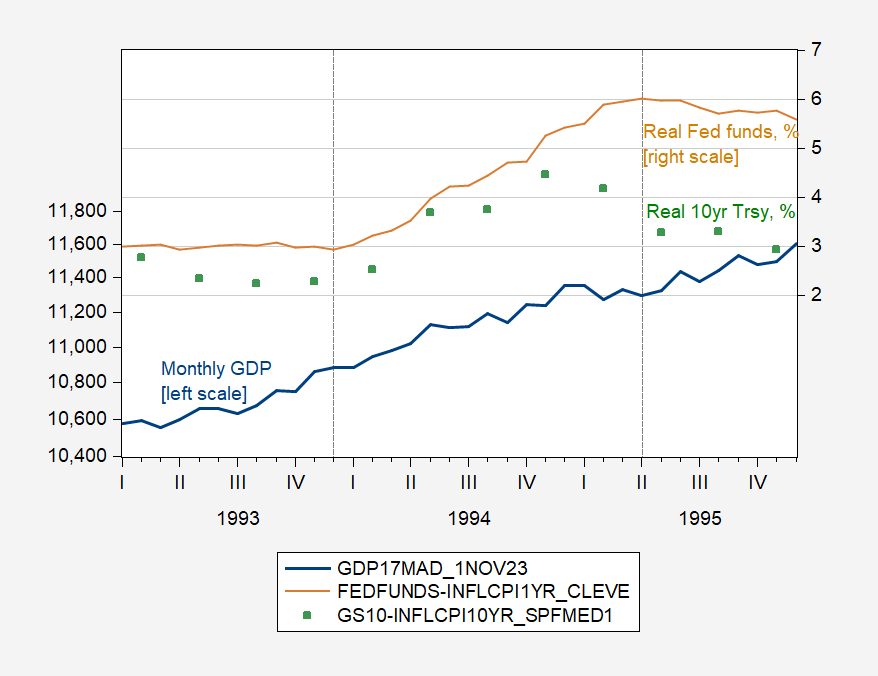
I’d only been familiar with the 1993-95 and 1999-2000 episodes. I think it of interest to compare the 1993-95 episode to the current, in terms of real rates and GDP. First, 1993-95:
Figure 1: Monthly GDP in bn.Ch.2017$ SAAR (blue, left log scale), Fed funds adjusted by Cleveland Fed 1 year expected inflation, % (tan, right scale), and ten year Treasury yield adjusted by SPF 10 year median expected inflation, % (blue, right scale). Dashed lines at Boocker-Wessel-Blinder soft land start/end. Source: SPGMI, Federal Reserve Board and Treasury via FRED, Cleveland Fed, Philadelphia Fed, and author’s calculations.
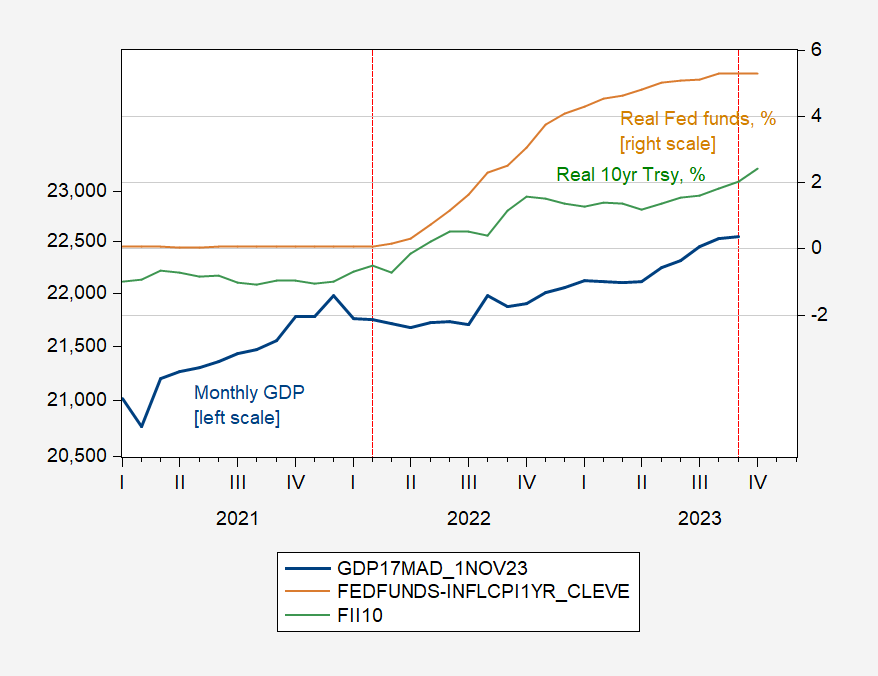
And here’s the current episode of some sort of landing, yet to be determined…
Figure 2: Monthly GDP in bn.Ch.2017$ SAAR (blue, left log scale), Fed funds adjusted by Cleveland Fed 1 year expected inflation, % (tan, right scale), and ten year TIPS, % (blue, right scale). Dashed lines soft land start/end as determined by author. Source: SPGMI, Federal Reserve Board and Treasury via FRED, Cleveland Fed, and author’s calculations.
The recent episode has witnessed a larger jump in real Fed funds rate (over 4.5% vs. 3%), a similar increase in the real 10-year Treasury, while output actually decreased when the Fed funds rose (in 2022Q2) while it continued to rise in 1994. Also in contrast, by the end of the soft landing as defined by Blinder, the 10-year real rate was declining, while in the current episode, that rate continues to rise.
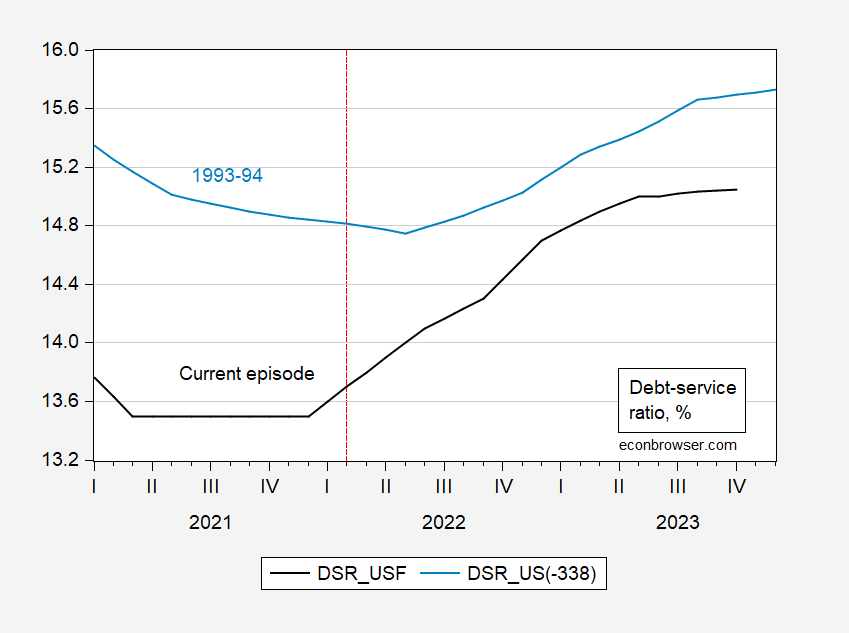
The debt service ratio has risen more, as a consequence of the larger interest rate increase.
Figure 3: Debt service ratio for private nonfinancial sector now, in % (black), in 1993-95 in % (light blue). 2023M04-10 period extrapolated using 3 month interest rate in first differences. Source: BIS, and author’s calculations.
According to my guesstimates, the debt service ratio trajectory has flattened (actual data only extends up to 2023M03), but at a level substantially higher than existed before tightening began.
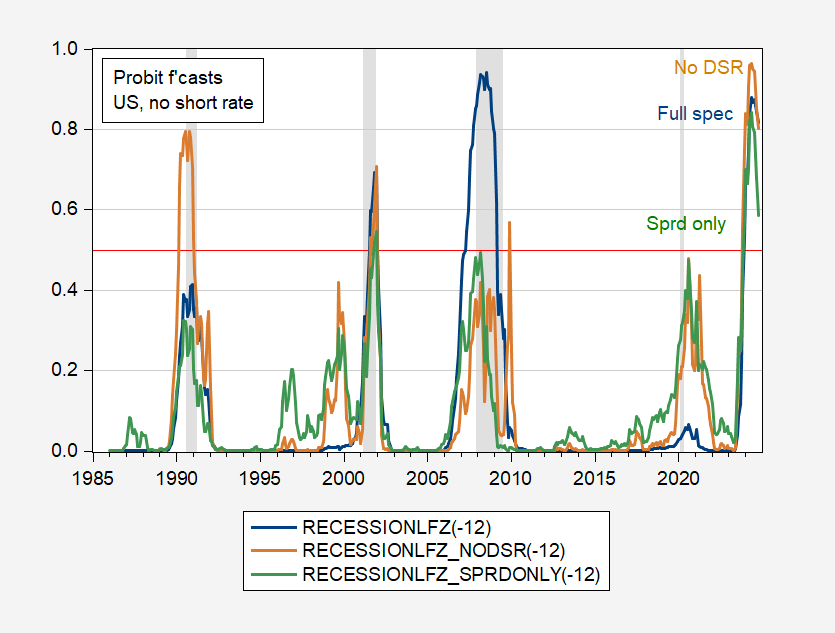
As the soft landing calls continue, it’s useful to recall that if historical correlations hold, recession probabilities from spread-based probit models breach the 50% threshold around November-December of this year and peak around May-June 2024.
Figure 4: Recession probability from probit model with only 10yr-3mo spread (green), spread, NFCI, foreign term spread (tan), and spread, NFCI, debt-service ratio, foreign term spread (blue). NBER defined peak-to-trough recession dates shaded gray. Source: Author’s calculations, NBER.
The important caveat is that historical correlations hold.
More By This Author:
World Coal Consumption Trends – American SourcesWorld Coal Consumption Trends
One Year Ahead Inflation Expectations

