Thoughts For Thursday: How Now Brown Cow, How High CPI?
After two days of strong gains, all eyes are on Thursday morning's release of January 2022 CPI data by the Bureau of Labor Statistics. A smaller rise than December's is anticipated. A little to no surprise change is expected to spur the market forward further.

Wednesday the S&P 500 closed at 4,587, up 66 points or 1.5%, the Dow closed at 35,768, up 305 points or 0.9% and the Nasdaq Composite closed at 14,490, up 296 points or 2.1%. Currently market futures are mixed, S&P futures are trading down 11 points, Dow futures are trading up 8 points and Nasdaq 100 futures are trading down 65 points.
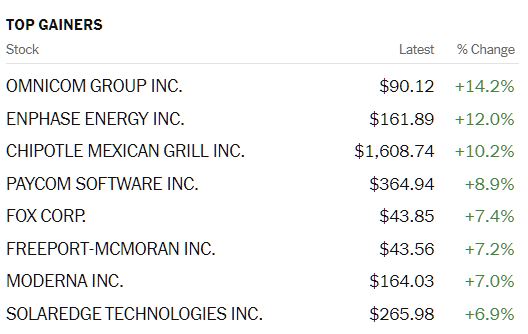
Yesterday's top gainers were across many sectors, Media Communications, Consumer, Alternative Energy, Technology, Biotech and Services. The leader was advertising giant Omnicom (OMC) which closed at $90.12 per share, up 14.2% or $11.15, after strongly beating both the Street's revenue and earnings estimate for the company. Another company with strong one day gains was sometimes troubled Chipotle Mexican Grill (CMG) which was up 10.2%.

TalkMarkets contributor Jim Mosquera has a name for the current action in the market and he says the Omnibubble Is Bigger Than Ever.
"Why OmniBubble? The word “omni” means “all” or “everywhere” and frequently connects in words like omnipotence. The inescapable conclusion is that we're encircled by a series of omnipotent financial bubbles that will ultimately suffocate the world economy and financial markets...
What does the omnibubble look like today? Below are twelve indicators of just how much larger the bubble is now.
- S&P 500 price to sales ratio well exceeds the bubble highs of 2000 and 2007. (1)
- The Wilshire 5000 index is twice the size of the U.S. economy. (2)
- NYSE margin debt has surpassed all previous stock market peaks. (3)
- Everyone's all in as evidenced by record low money market participation and low cash to asset ratios. (4)
- Rydex Funds participation demonstrate overwhelming bullishness far surpassing the levels in 2000, 2007, and 2020. (5)
- Put-call ratios are at all-time levels of bullishness and the amounts paid for call options far exceed levels of 2000, 2007, and 2020. (6)
- Traders are confident when IPOs are blossoming. Last year saw record volume. (7)
- You might conclude with record IPOs we'd also have record number of companies making money. We have the opposite. (8)
- A special type of IPO is a Special Acquisition Company (SPAC), which is a company raising capital with no stated purpose. You might say they're being flexible. The last two years exhibit explosive growth in the issuance of SPACs. This type of undefined capital raising was evident in a prior bubble. (9)
- More fund managers are admittedly taking more risk. (10)
- Households are all in with the all-time highest percentage of their financial assets being allocated to equities. That's saying something. considering the explosion of residential real estate prices. (11)
- What can we conclude about insiders (company managers/executives) who are selling at eight times the ratio at which they're buying? In case you're wondering that level is higher, by far, than any in history. (12)
In late 2019 discussing how stocks were at the riskiest levels in history, I suspected a correction was around the corner. That came early in 2020. The ensuing fall into the March 2020 low did little to dampen the animal spirits of investors. While the omnibubble's existence doesn't tell you when it will pop, we should not be surprised when it does. There's much air to let out of this bubble. The consequence of this deflating bubble will devastate many."

Well, that certainly is one way to put things in perspective this morning.
Contributor Chuck Carnevale brings us his latest thoughts about Meta (FB) in a ten minute video entitled Facebook – What Does The Future Hold?.
"After recording the largest one-day drop in market value in history for a U.S. company, what does the future now hold? We all know that Facebook (Meta Platforms Inc.) has been one of the market’s greatest success stories. Shareholders have made fortunes owning Facebook because of its extraordinary rate of growth. However, the company is facing challenges that it never had before. The real question now is Facebook attractive or that they still have farther to fall?"
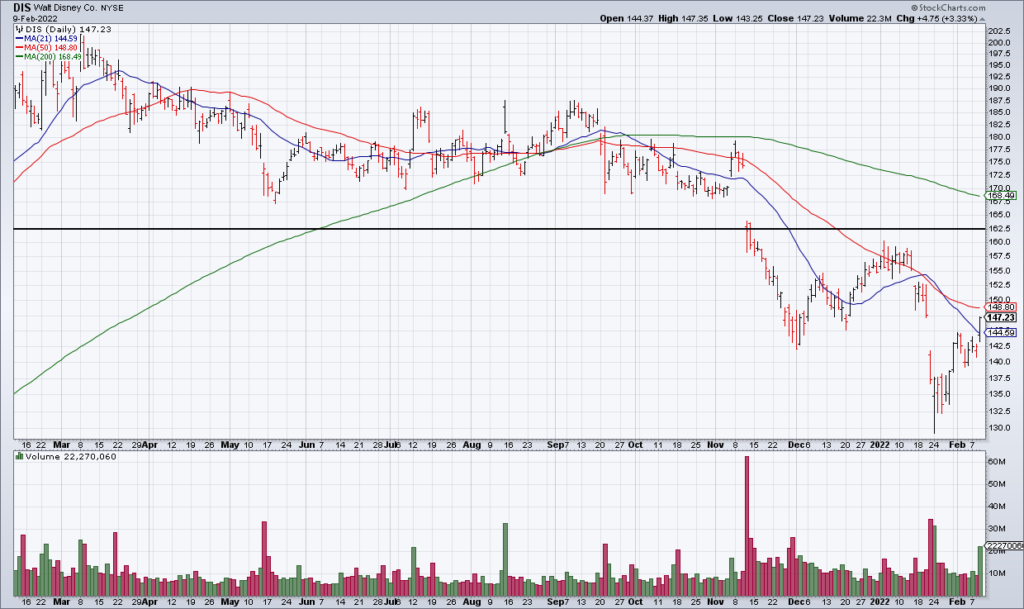
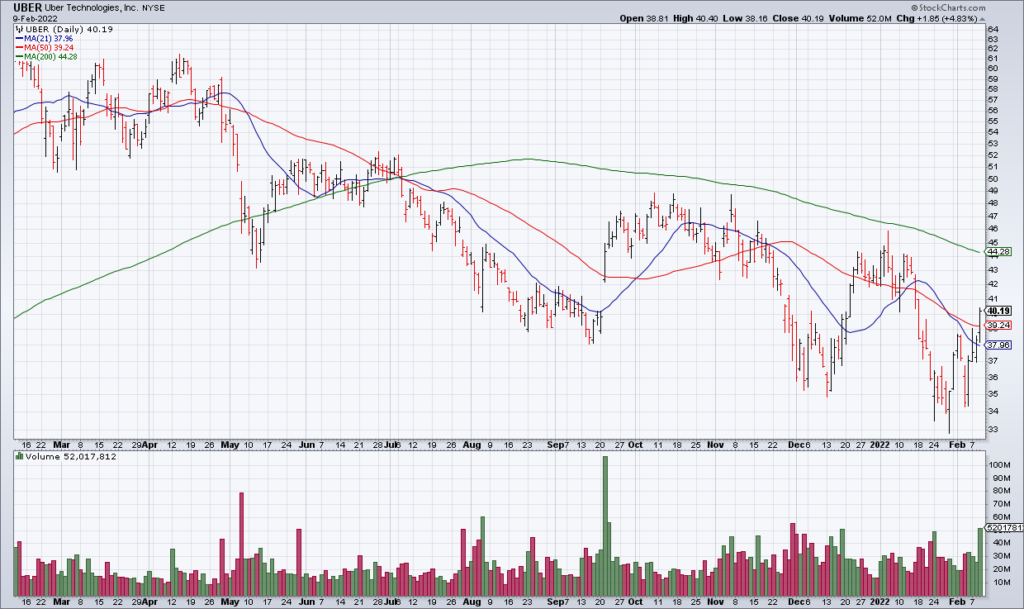
While waiting for this morning's CPI contributor Greg Feirman has a look at the recent performance of both Disney (DIS) and Uber(UBER) in Impeccable DIS & UBER Earnings Ahead Of The Jan CPI.

Disney reported sparking 4Q21 earnings after the close of Wednesday. Disney’s streaming service Disney+ continues to grow extremely rapidly adding more than 10 million subscribers in the quarter to reach 129.8 million from 118.1 million at the end of 3Q21. Another bright spot was their Parks & Experiences segment which continues to recover as the economy reopens. Revenue of $7.2 billion was just shy of the $7.6 billion they reported in the pre-pandemic 4Q19. As a result DIS shares are currently +7% in after-hours to about $157 – though they still have a gap to fill at about $162.50 from the gap down in the wake of 3Q21 earnings last November."

Uber also reported an impeccable 4Q21 after the close Wednesday. Gross Bookings in their Mobility segment continued to improve as the economy reopens reaching $11.3 billion compared to $13.5 billion in the pre-pandemic 4Q19. Their Delivery (food) segment continues to grow rapidly as consumers continue the pandemic trend of having food delivered rather than going out. Bookings reached an all-time high of $5.8 billion – a 19% sequential increase from the previous record set in 3Q21. UBER shares are currently +5% in the after hours."
Feirman concludes with this pre-CPI release quip:
"The wildcard for the current rally is the January CPI Report out Thursday morning at 8:30 am EST. A hot print could rekindle fears that The Fed is behind the curve on inflation and may even do a 50 basis point hike at its March meeting. This could also cause the 10-year treasury yield to test 2%. On the other hand, a cooler than expected number could allow the relief rally to continue – though I don’t see the Nasdaq getting much above its 200 DMA at 14,737."
Michael Kramer in his article A Miss On The CPI Print Tomorrow Can Still Tank Stocks suggests that even good news could be bad.
"Stocks rallied today (Wednesday) but based on all the data I saw, puts were being bought, and calls sold on the SPY and QQQ ETFs, which isn’t bullish. Additionally, the 2-Year Treasury surged to a new cycle high by the close, while the dollar dropped. Even real rates on the 5-Yr TIP ended up surging higher into the day’s end despite being lower all day.
So if the stock market is expecting a miss on CPI, then it is out there alone because not one other part of the market is looking for a miss, and the stock market is the last indicator I would use to guide me on economic data.
If a miss were being priced, yields on the short end of the curve would be falling, and options traders would have been buying calls and selling puts to get ahead of a market pop."
Hmm, 8:30 am eastern, can't come early enough for some, today.
In a concise but detailed article TM contributor Mike Zaccardi discusses Global Sovereign Rates On The Rise As The US 10yr Yield Breaks Out: What It Could Mean For Stocks.
Below is an excerpt which gets to the crux of the matter:
"Developed Market Bonds Under Pressure
While the US 10yr holds above 1.9%, global 10yr sovereign interest rate breadth has pushed to extreme levels. Our composite bread indicator in the featured chart below is at one of the highest levels that we have ever seen.
Featured Chart: Higher Intermediate-Term Sovereign Rates – A Global Thrust

Watch your Duration
What does it mean for stocks? High-duration assets – like nonprofitable tech and many small and mid-cap US growth stocks – could be under pressure. High current cash flow machines like many energy stocks could feature continued relative strength, but much will depend on how oil moves in the face of hawkish policymakers.
Bottom Line: Bond yields are breaking out. It is not just a US story. We see widespread weakness among global developed market sovereign bonds as our breadth indicator runs to extreme levels. Real yields are particularly moving higher and could be the next indicator to watch for a breakout as the 10yr nominal rate eyes a move above the key 2% level. That would likely mean more weakness for high-duration assets like long bonds and growth/tech."
Taking another look at where the Fed comes in contributor Jesse Felder asks Can The Fed Afford To Tighten Into An Economic Slowdown?
Here is some of what he has to say:
"There’s an important disconnect between stocks and bonds today. Especially, I am looking at two fundamental indicators for evaluating long-term interest rates. The first is the performance of small-cap stocks relative to large caps. Typically, this ratio has moved in concert with the 30-year treasury yield. For the past few months, however, we have seen a major divergence between the two as small-cap stocks, which are more sensitive to shifts in the economy, have led the broad stock market to the downside even as interest rates have shot higher.
The second indicator...is the relative performance of the most economically-sensitive sectors in the stock market (something I call the Economic Predictors Index)...we have seen a steady decline in this indicator after it put in a peak nearly a year ago. But while the decline in the EPI has continued recently, interest rates have reversed higher...
...for now, it looks like economic fundamentals are in the process of weakening (see: GDPNow) which would explain the performance of the stock-market-based indicators above. At the same time, after financing the majority of issuance over the past couple of years, the Fed is now attempting to end...its purchases of treasuries which may be putting some strain on the bond market. The question then becomes, can the Fed afford to allow interest rates across the curve to continue to rise even as the economy slows? I guess we will find out soon enough."
See Felder's article for the accompanying charts.
Here's something to listen to with your morning coffee while waiting in anticipation for the January CPI data to be released.
Have a good week.


