
Lots of things going on, but AI is what is moving the market. Nvidia put out good results yesterday and we can expect interest in smaller rivals to add action to the mix.

On Wednesday the market corrected down just slightly. The S&P 500 closed at 5,307, down 14 points, the Dow closed at 39,671, down 202 points and the Nasdaq Composite closed at 16,802, down 31 points.
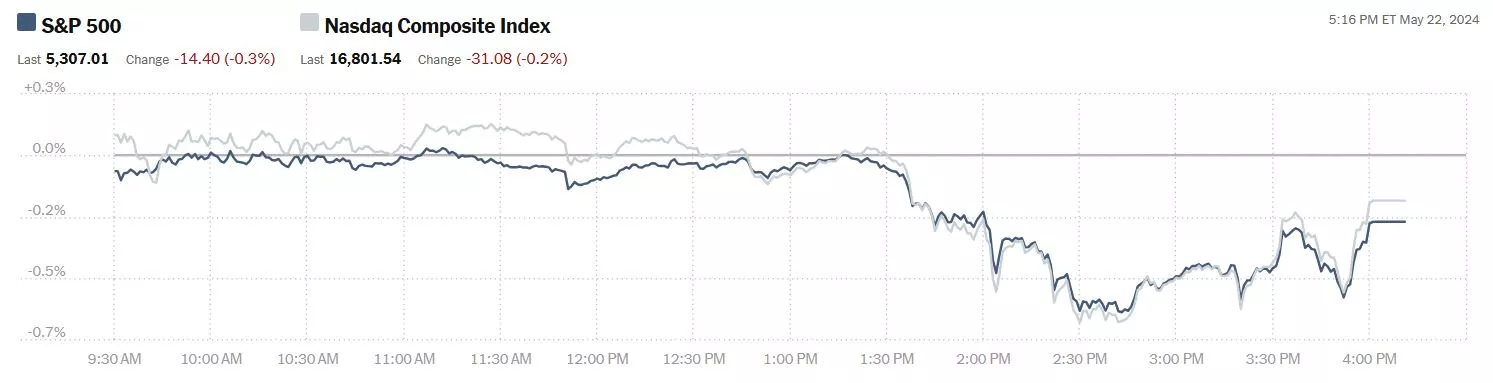
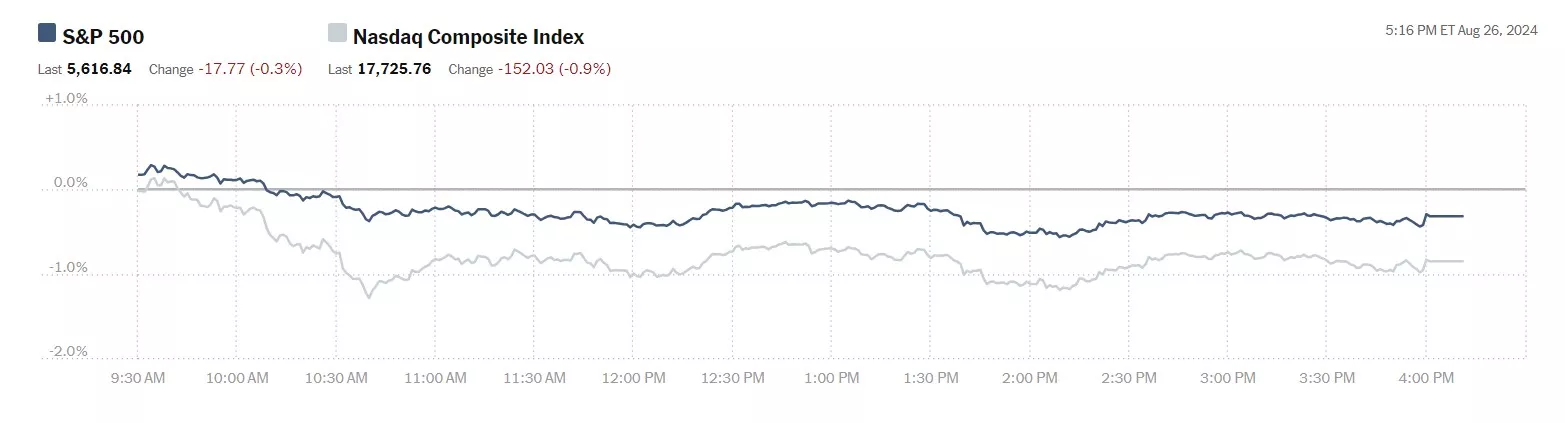
Chart: The New York Times
Most actives were led by Tesla (TSLA), down 3.5%, followed by Nvidia (NVDA), down 0.5% and Advanced Micro Devices (ADM), up 0.5%.
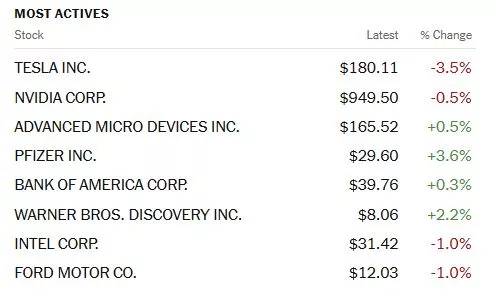
Chart: The New York Times
In morning options trading, S&P 500 market futures are up 27 points, Dow market futures are up 24 points and Nasdaq 100 market futures are up 162 points.
TalkMarkets contributor Mark Vickery reports Nvidia Puts Up Great Q1 Numbers, +100% YTD.

"Markets closed in negative territory across the board today. After a rather uneventful morning that saw major indices tread water at the breakeven point with yesterday’s close, the FOMC minutes from the April 30-May 1 meeting were released at 1:30pm ET this afternoon. An hour later, the indices were at session lows...
What was in the Fed minutes? Basically, the lack of recent progress toward their +2% inflation objective has frustrated some of the FOMC members. There was even a willingness — on the part of some, not all — to actually raise rates in the future should risks to inflation materialize. Many of these concerns have been abated since, however: a somewhat shrinking labor force and a dwindling Consumer Price Index (CPI) shows that the economy appears to have righted its course in the past few weeks.
None of this really matters at this hour, anyway. NVIDIA, perhaps the world’s most important company as of today, reported Q1 earnings after Wednesday’s close. Unsurprisingly, the graphics chips innovator clobbered expectations on the bottom line — earnings of $6.12 per share, well above the $5.49 anticipated and a whopping +561% year over year. Revenues of $26.00 billion outpaced the $24.33 billion in the Zacks consensus.
Next-quarter revenue growth has been raised to roughly $28 billion, +/-1-2%. Q2 non-GAAP gross margins reached +75.5% in the quarter with record-setting Data Center revenues: $22.6 billion — nearly the full amount of sales NVIDIA had in the quarter — amounts to +23% growth quarter over quarter, and a jaw-dropping +427% year over year.
“The next industrial revolution has begun,” crowed CEO Jensen Huang. Further, the company is offering a 10 to 1 stock split to investors to go along with a cash dividend of 1 cent per share post-split. In short, this may be the most impressive earnings report since Steve Jobs was still making it rain for Apple (AAPL)."
Cpntributor Declan Fallon posits on yesterday's action in Russell 2000 Drops Back Into Consolidation.
"Sellers made more of an impression on the markets today. The Russell 2000 (IWM) dropped out of its 'bull trap' challenge and into its prior base. In doing so, the underperformance relative to the Nasdaq accelerated, although other technicals are net positive. After today, the move to test the 20-day MA looks the most likely outcome over the coming days.

The S&P managed to hold on to its breakout. Today's losses were relatively minor, and the index finished with a 'bullish hammer', although the significance of this candle requires an oversold momentum state for it to act as a rallying point. Volume rose to rank as confirmed distribution, but until the breakout reverses the volume selling is not so relevant.

The Nasdaq experienced a similar level of selling as the S&P. Unlike the S&P, the Nasdaq registered a 'sell' in On-Balance-Volume. The key advantage this index has over its peers is that it's the relative outperformer, and therefore the market leader. What goes here should go for other indices."
See the full article for the Nasdaq chart.
Commodities and Forex take us away from the NYSE and pull us into the ROTW. Contributors Warren Patterson and Ewa Manthey take on natural gas and metals in The Commodities Feed: Gas Supply Risks.

"European natural gas prices have hit their highest level since January. TTF prices settled 4.2% higher yesterday at almost EUR34.39/MWh. This is after the Austrian energy company, OMV, warned that there was a risk that Russian pipeline flows to Austria could be halted after a court ruling that would block payment for natural gas delivered by Russia’s Gazprom Export. However, it is unclear if the ruling will be enforced. The supply at risk is 6 bcm per year supplied by Gazprom under a long-term contract to OMV for delivery into Austria. Austria still receives almost all of its gas supplies from Russia. In March, 93% of Austria's gas imports came from Russia. While a potential stoppage in these flows could lead to some localized tightening in the gas market, Europe as a whole should manage...
Weakness in oil prices increases the likelihood that OPEC+ members fully roll over their additional voluntary supply cuts into the second half of the year.
Weekly data from the EIA yesterday showed that US commercial crude oil inventories increased by 1.83m barrels WoW, while crude oil stocks at Cushing increased by 1.33m barrels. For refined products, gasoline stocks fell by 945k barrels and distillate stocks increased by 379k barrels...
The latest data from the World Steel Association (WSA) shows that global steel production declined by 5% YoY to 155.7mt in April, following lower output from major producers like China, Japan, Russia and South Korea. Cumulatively, global steel output fell almost 1% YoY to 625.4mt over the first four months of the year. Chinese steel production decreased 7.2% YoY to 85.9mt last month, whilst cumulative output fell 3% YoY to 343.7mt. Output from South Korea, Russia and Japan declined by 10.4% YoY, 5.7% YoY and 2.5% YoY respectively in April."
Contributor Tyler Durden reports Bean Used In Instant Coffee Soars The Most Since 2011.

"Robusta bean prices in London closed up 6.72% on Tuesday, the largest daily increase since April 5, 2011—or more than 13 years ago. The driver has been droughts crushing production in Vietnam. Even though rains have improved the outlook, supply woes linger throughout the year.
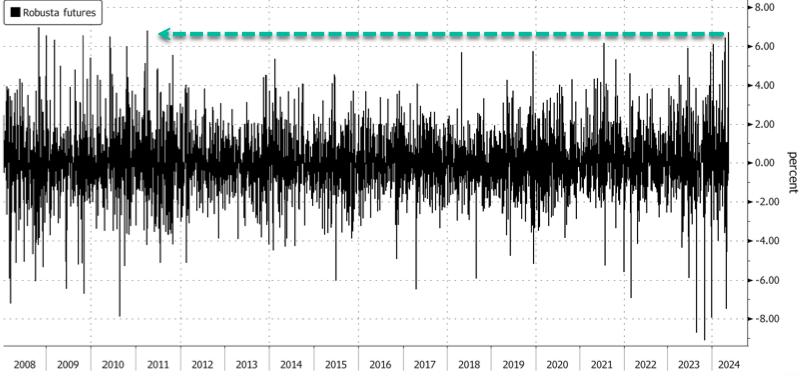
Robust demand for the bean and a recent International Coffee Organization report warning about global supply woes have sent bean prices soaring. Since 2020, the bean has jumped 265%. "
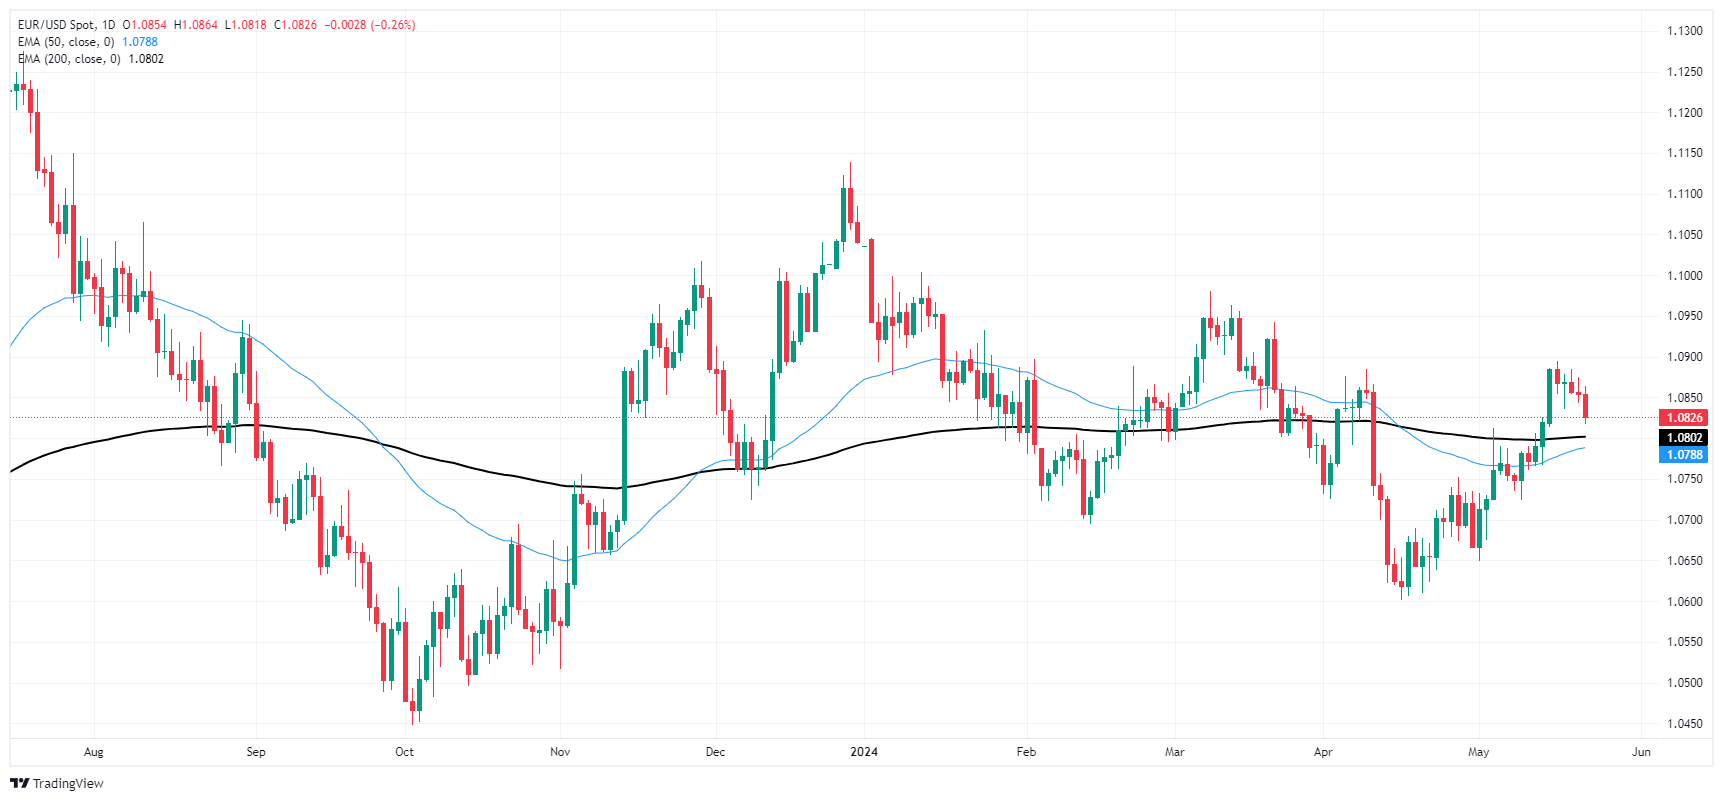
Contributor Joshua Gibson reports EUR/USD Eased Lower On Wednesday After FOMC Meeting Minutes Miss The Mark.
"EUR/USD knocked lower on Wednesday after the Federal Reserve’s (Fed) latest Meeting Minutes revealed the Federal Open Market Committee (FOMC) are grimly determined to wait for more proof inflation will ease to 2%, sending risk appetite lower as rate-cut-hungry investors keep hoping for dovish signs from the US central bank...
Daily candles are inching towards the 200-day EMA at 1.0802, and EUR/USD has closed in the red for three of the last four straight trading days. Despite a near-term bearish pullback, the pair is still up from the last major swing low into 1.0600 in mid-April..."
EUR/USD daily chart
Closing us out for the day TalkMarkets contributor Cullen Roche looks at Three Things – Monetization, Sentiment And Real Wealth.

Here are three things I think I am thinking about this week:
1) Is QE Debt “Monetization”?
It’s been 15 years since I first said that the Fed wasn’t “monetizing the debt”. My original work on this caused a huge uproar as hyperinflation fears were rampant following the financial crisis. I’d learned from studying Japan that QE involves the Fed printing a deposit into your account and removing a money-like instrument from your account. You sell a T-Note and get a bank deposit. Back when rates were 0% this meant that you were selling an AAA-rated higher-yielding instrument and then getting an AAA-rated 0% yielding deposit. You have the exact same quantity of assets and less income and the Fed takes the T-Note out of the economy. You technically have more “money”, but you already had a money-like instrument in the first place so your consumption was unlikely to change after you were given the deposit because you’re actually worse off in financial terms since your income went down. My conclusion 15 years ago was that all of this was unlikely to cause high inflation because it’s the budget deficit that requires new “asset printing” and the Fed just came in after the fact and changed the composition of those assets...
Now, the textbook theory would tell us that more money means more inflation. But it turns out that that was not exactly right. Adding more money to the financial system during QE didn’t create high inflation because the Fed was just swapping money-like instruments for other money-like instruments. It’s a bit more complex than that because QE can involve buying other assets or buying depressed assets like in 2009 when the Fed bought large amounts of MBS from banks thereby creating capital gains that were essentially money printing. I used to joke often that if the Fed had agreed to buy bags of dirt that would have been hugely inflationary. But that’s not what they were doing. And so as a baseline understanding, if the government is running a balanced budget and the Fed buys T-Notes and gives you deposits then this isn’t changing much in the macroeconomy...
Covid taught us that big budget deficits can create big inflation. And that’s the difference between Covid and the GFC. During the GFC we got big QE, but small deficits and the result was small inflation. During COVID, we got big QE big deficits, and big inflation. So, the conclusion should be that big deficits can cause big inflation whereas QE and “monetization” have more tangential impacts on the economy.
And so yeah, these might seem like insignificant wonky monetary semantics, but the details matter because the details can drive policy understanding and future inflation.
2) The Four Types of Wealth
I like this concept from James Clear, the author of Atomic Habits:
There are 4 types of wealth:
- Financial Wealth (month)
- Social Wealth (status)
- Time Wealth (freedom)
- Physical Wealth (health)
I quibble a bit with his definition of Social Wealth as Status because I think status is massively overrated. I’d reframe Social Wealth as relationships. And to me, that’s one of the more important forms of wealth. If you have great relationships in your life the other forms of wealth likely improve or don’t matter as much. But if you have bad relationships it’s likely that all those other forms of wealth will suffer. Of course, physical wealth has to be the most important because if you don’t have physical wealth then it’s hard to have any other type of wealth. But in terms of a hierarchy, I’d argue that the ranking for most people should probably look something like this:
- Physical Wealth (health)
- Social Wealth (relationships)
- Time Wealth (freedom)
- Financial Wealth (money)...
3) Why Does Sentiment Still Stink?
Consumer sentiment took a big dive again last week as inflation continues to drag down sentiment. A lot of this appears to be a huge political divide depending on which guy is your guy. If Biden is your guy then you might be more inclined to say everything is great. And if Trump is your guy then you might be more inclined to say everything stinks. Of course, I am just a data-driven and objective nerd who doesn’t care about politics so I am immune to political bias (haha) so let me explain why this is happening.
My basic view is that inflation has ravaged consumer sentiment. We went 20+ years without having meaningful inflation and then we got a 20%+ bump in the price level in just 3 years. And it was most exaggerated in some of the most consumer-sensitive items like housing and food. Meanwhile, real wages are basically stagnating, and real household net worth has been flat for 3+ years. And that’s important because housing is the majority of household net worth. And there are two sides to that coin. You’re either in the 40% of the population who rents and is hoping to buy at some point and you now feel screwed by rising prices and higher mortgage rates. Or you’re part of the 60% homeowners who have unrealized wealth gains that are nice on paper, but don’t change your day-to-day life at all. So even if you’re a homeowner who benefited from the Covid house price boom you might not feel much better about your lot in life because you’re probably locked into a low-rate mortgage with unrealized gains that you can’t do anything with. Meanwhile, 100% of us jump in the car headed to the grocery store every week, see high gas prices, and then see how expensive food is and come home angry because you know the government spent $25 trillion in three years and it feels like nothing’s better than it was before.
And I don’t think it’s a lot more complex than that..."
See Roche's full article for additional comments.
That's a wrap for today.
Peace.

More By This Author:
Tuesday Talk: Relative Calm Prevails
Thoughts For Thursday: New Highs Are Here
Tuesday Talk: Market Stays Steady


Comments
Log in or sign up to join the conversation.