The Path To Stock Market Capitulation Based On This Spooky Analogue?
Although the current up wave is unfolding as supported by the bullish divergence in the market breadth, the potential Wyckoff sign of weakness together with the inability to rally up is tracking the bearish structure in the global financial crisis in 2008.
Watch the video below to find out how to seek confirmation for the path to stock market capitulation, the potential price target for S&P 500 and at what point could the bearish scenario be violated using the Wyckoff trading method.
Video Length: 00:17:10
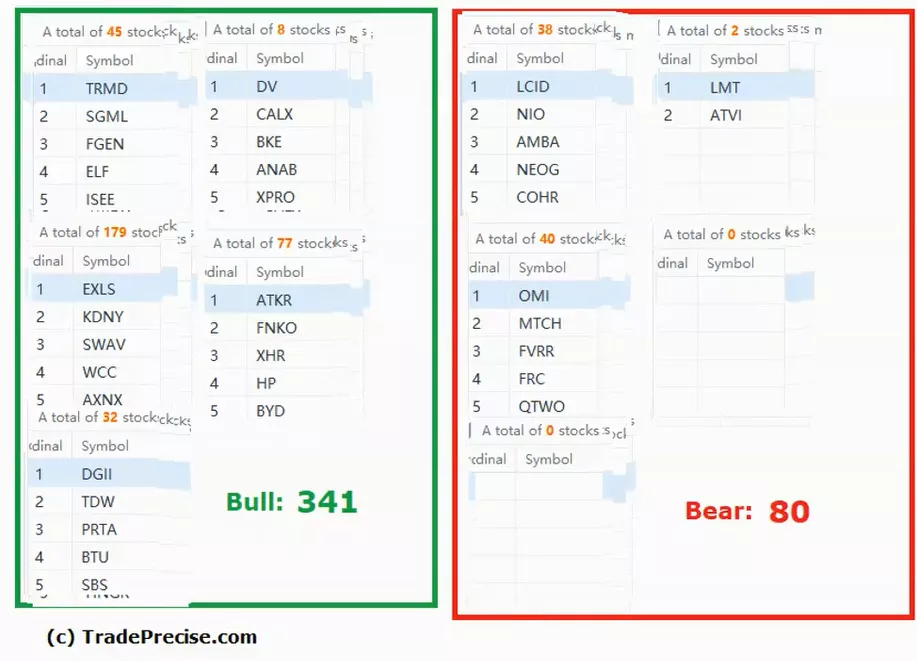
The bullish setup vs. the bearish setup is 341 to 80 from the screenshot of my stock screener below.

Although there are many bullish trade setup, there is still no leading industry group, which is an unhealthy sign in the stock market. If you plan to go short selling, just make sure that you know how to pick the winning stocks, manage your risk with proper position sizing in order to avoid the whipsaw by the huge volatility in both directions.
More By This Author:
Here’s What Could Happen To S&P 500 According To Wyckoff’s Efforts Vs. Results
Is The Current Rally In S&P 500 A Dead Cat Bounce Or Sign Of Strength?
Here Is How To Anticipate If A Relief Rally Or A Capitulation Will Show Up In The S&P 500
Disclaimer: The information in this presentation is solely for educational purpose and should not be taken as investment advice.


