
Does this mean we should be expecting the recession, in next month’s or month after’s data? Maybe, maybe not.
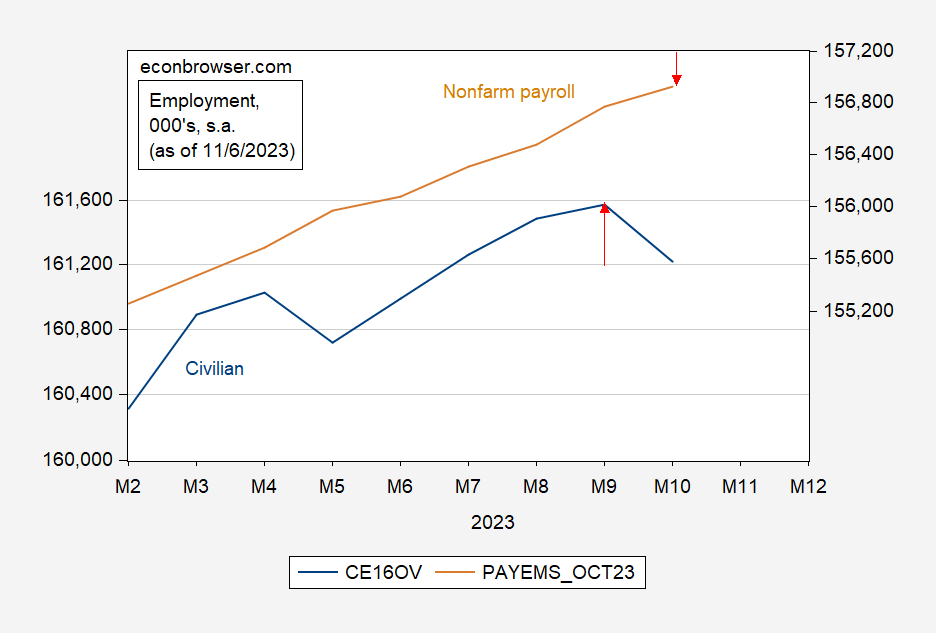
Figure 1: Civilian employment over age 16 (blue, left log scale), nonfarm payroll employment (tan, right log scale), both in 1000’s, seasonally adjusted, both as of 11/3/2023. Source: BLS via FRED.
Consulting the currently available data over the past four recessions, one would find that in two cases the household series peaks before the establishment — in one case three months earlier. However, the results are somewhat different in real time, i.e., as observers were contemporaneously assessing the onset of a recession
Figures 2-5 show the real time assessments (see this post for a discussion of final data vs. real time).
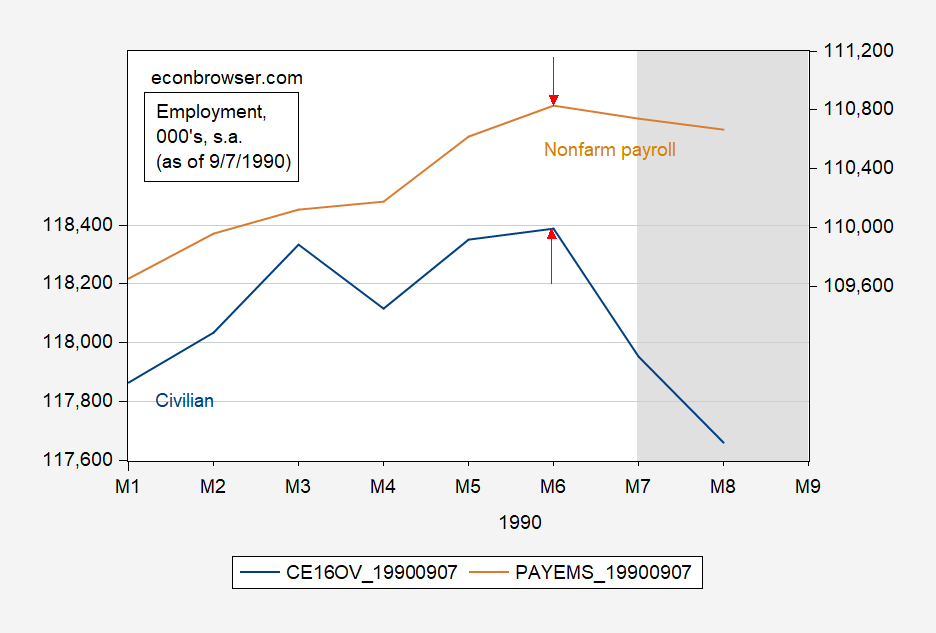
Figure 2: Civilian employment over age 16 (blue, left log scale), nonfarm payroll employment (tan, right log scale), both in 1000’s, seasonally adjusted, both as of 6/7/1990. NBER defined peak-to-trough recession dates shaded gray. Source: BLS via ALFRED, NBER.
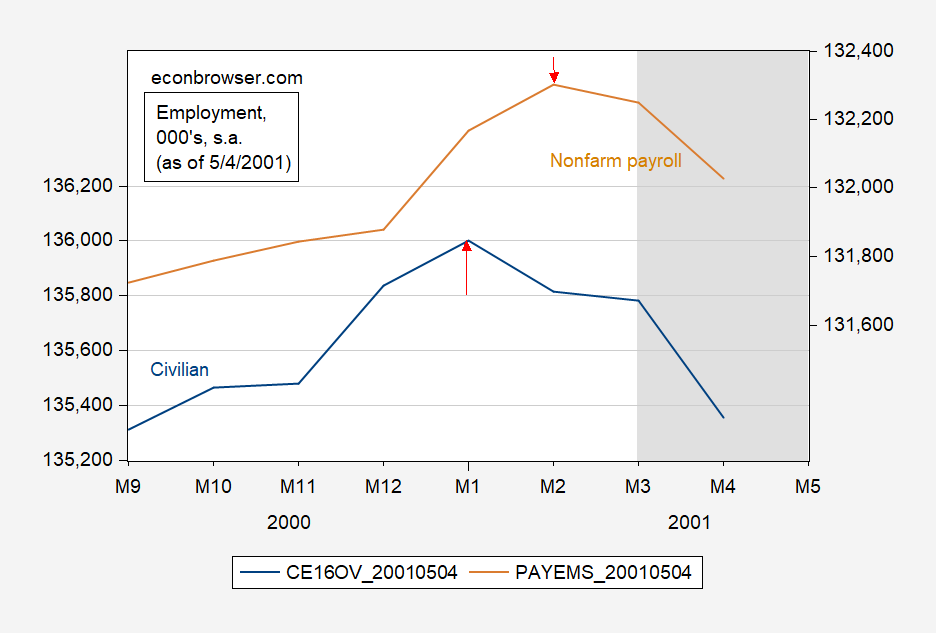
Figure 3: Civilian employment over age 16 (blue, left log scale), nonfarm payroll employment (tan, right log scale), both in 1000’s, seasonally adjusted, both as of 5/4/2001. NBER defined peak-to-trough recession dates shaded gray. Source: BLS via ALFRED, NBER.
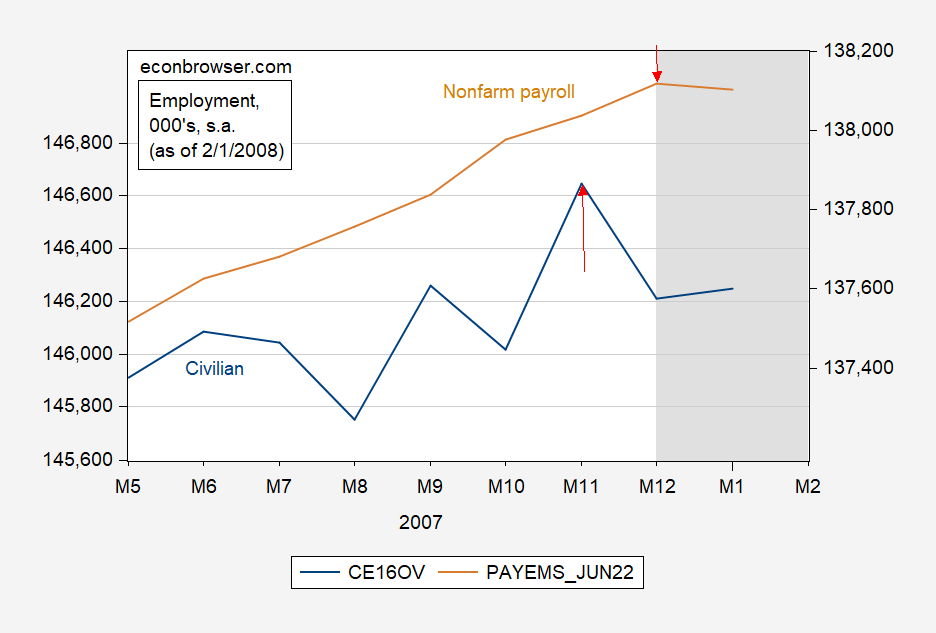
Figure 4: Civilian employment over age 16 (blue, left log scale), nonfarm payroll employment (tan, right log scale), both in 1000’s, seasonally adjusted, both as of 2/1/2008. NBER defined peak-to-trough recession dates shaded gray. Source: BLS via ALFRED, NBER.
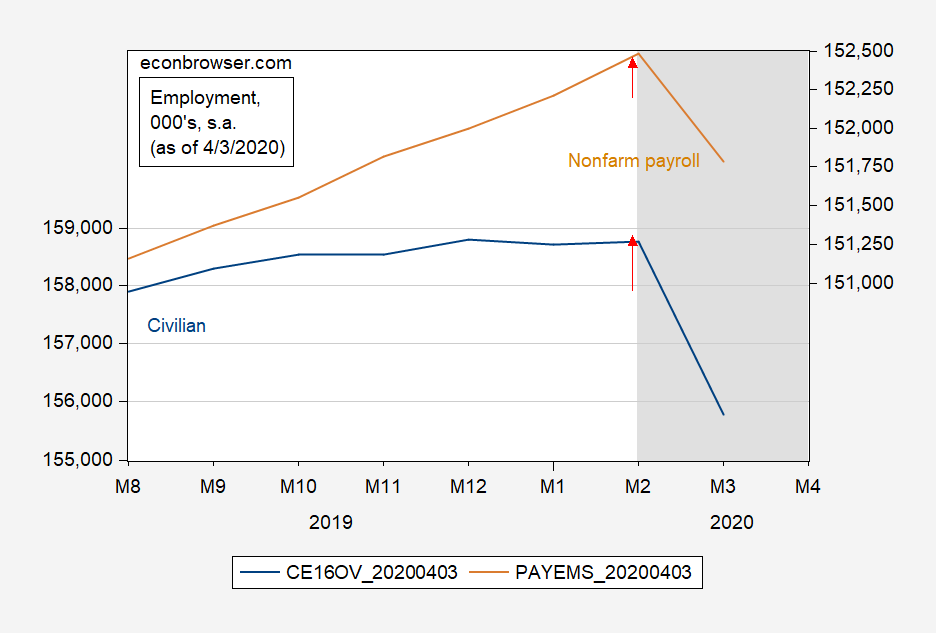
Figure 5: Civilian employment over age 16 (blue, left log scale), nonfarm payroll employment (tan, right log scale), both in 1000’s, seasonally adjusted, both as of 4/3/2020. NBER defined peak-to-trough recession dates shaded gray. Source: BLS via ALFRED, NBER.
In real time, the household series turns one month earlier than the establishment in two cases (2001, 2007), and twice the turning points are the same time (1990 and 2020). In the revisions, the civilian series peaks are moved earlier once (1990), and later by two months (2001). The NFP peak is moved later once (2001 recession).
Extrapolating from the past is always a hazardous enterprise. We now know response rates for the initial reading of the establishment survey has declined substantially, from 60% pre-pandemic to 42% in June (although the final reading is not as bad, roughly at 94%). The household series has also experienced a declining response rate, at 70% in July 2023, vs. 82% just before the pandemic.
In general, most practitioners place almost total weight on the establishment series, which makes sense as the standard deviation of (annualized) m/m growth rates since 2000 of the household series is 3%, and establishment is 2% (where I’ve omitted 2020M02-2022M01).
In any case, it then makes sense to cross-check the data. Here are several indicators of employment growth corresponding to the NFP concept, where the QCEW series does not rely on the BLS birth-death model and the survey response rates. The Philadelphia Fed early benchmark relies on survey data for the period after Q1.
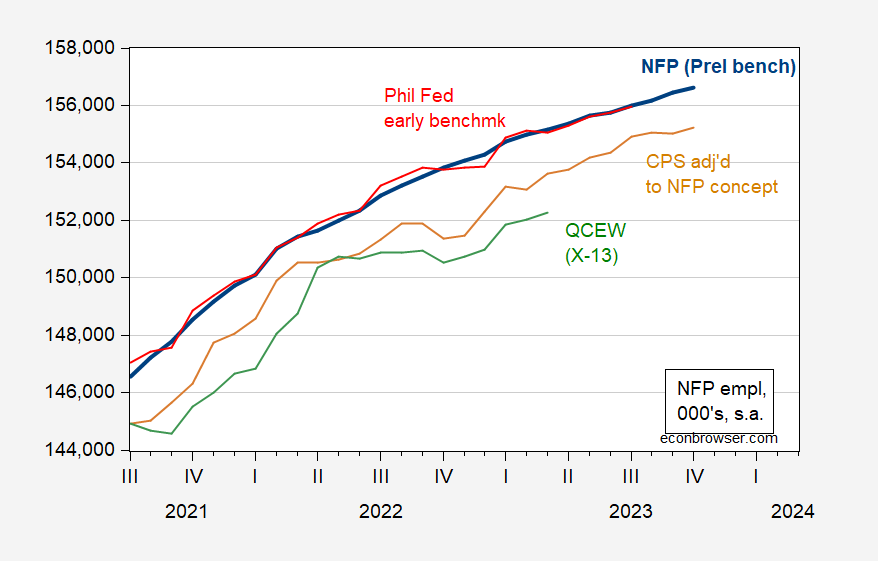
Figure 6: NFP employment incorporating preliminary benchmark calculated by author (bold blue), Philadelphia Fed early benchmark (red), household employment adjusted to conform to NFP concept (tan), and QCEW covered employment adjusted by Census X-13 by author (green), all in thousands, seasonally adjusted. Source: BLS via FRED, Philadelphia Fed, BLS, BLS-QCEW, and author’s calculations.
Another check is for private employment, using ADP data.
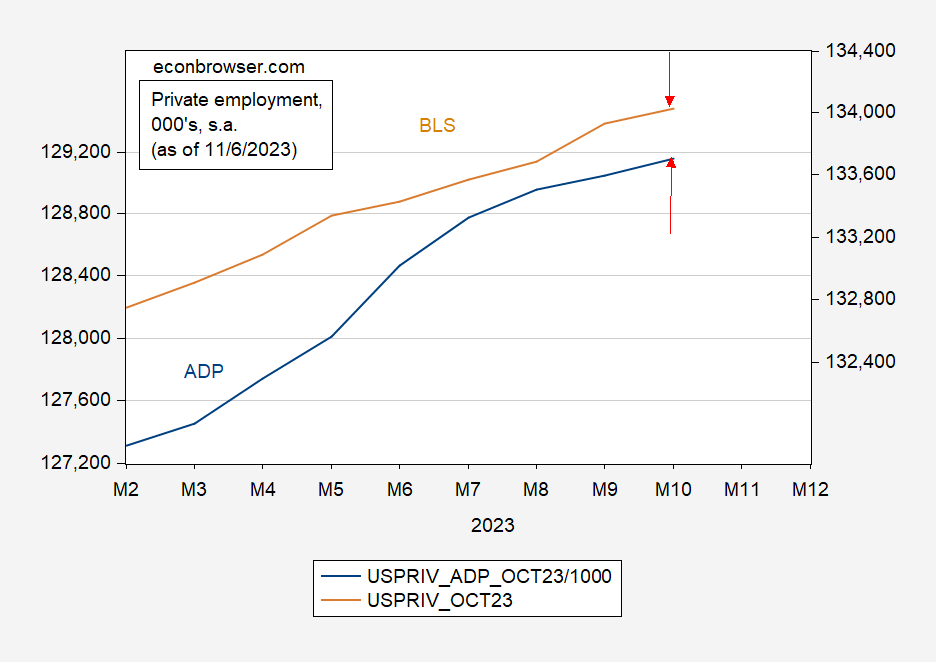
Figure 7: Total private nonfarm payroll employment, from BLS (tan, right scale), from ADP (blue, left scale). Source: BLS, ADP via FRED.
More By This Author:
Weekly Macro Indicators, Through 10/28Risk And Uncertainty, Market And Geopolitical
Interest Rates Decline


Comments
Log in or sign up to join the conversation.