The Employment Situation Release And Business Cycle Indicators For February
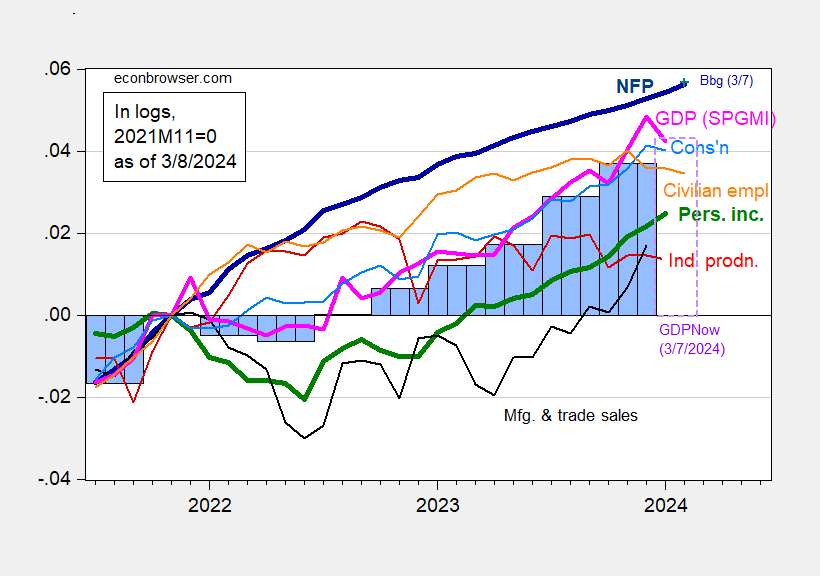
January NFP employment growth surprises on the upside, at +275 vs. +198 thousands consensus. With combined downward revisions in the prior two months totaling 168 thousand, the level of employment is just about consistent with implied consensus. Here’s a picture of key indicators followed by the NBER’s Business Cycle Dating Committee, plus monthly GDP and GDPNow.

Figure 1: Nonfarm Payroll employment incorporating benchmark revision (bold dark blue), implied level using Bloomberg consensus as of 2/1 and December 2023 NFP (blue +), civilian employment (orange), industrial production (red), personal income excluding current transfers in Ch.2017$ (bold green), manufacturing and trade sales in Ch.2017$ (black), consumption in Ch.2017$ (light blue), and monthly GDP in Ch.2017$ (pink), GDP, 3rd release (blue bars), GDPNow for 2024Q1 as of 3/7 (lilac box), all log normalized to 2021M11=0. Source: BLS via FRED, Federal Reserve, BEA 2023Q4 2nd release, S&P Global Market Insights (nee Macroeconomic Advisers, IHS Markit) (3/1/2024 release), and author’s calculations.
While the official NFP series shows continued growth, there is some slower growth evidenced in alternative measures.

Figure 2: Nonfarm payroll employment from February release (bold red), implied level from preliminary benchmark by author and Bloomberg consensus change for February (light red +), Philadelphia Fed early benchmark (light green), household survey series on civilian employment adjusted to NFP concept as reported (pink), and QCEW covered employment for US total (chartreuse), seasonally adjusted using X-13 (in logs). Source: BLS via FRED, BLS, Philadelphia Fed.
The civilian employment series (from the household survey) adjusted to the NFP shows a definite decline (reflecting in part the civilian employment in Figure 1). How much credence to put in this series? I’d say less than that from the CES.
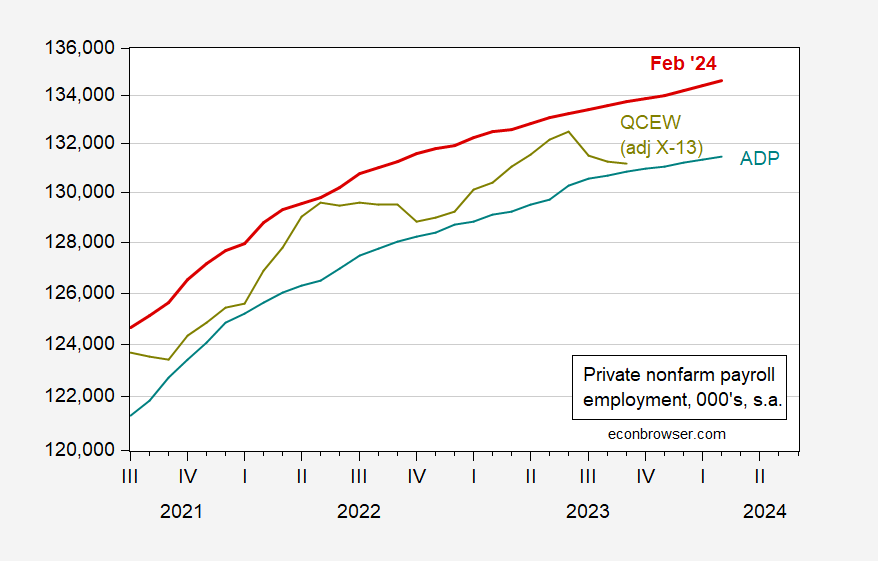
I say this because of the trends in independent series, including the ADP series, and to a lesser extent the QCEW covered employment for private sector.

Figure 4: BLS Private nonfarm payroll employment (red), ADP (teal), and QCEW (chartreuse). Source: BLS, ADP via FRED, BLS, and author’s calculations.
Hard to see the slowdown showing up in the labor market data (putting appropriate weight on CES vs CPS). No recession yet according to the Sahm rule.
More By This Author:
Biden-Trump: Some Economic Comparisons
LP Derived IRFs For Disasters On GDP
Year-On-Year Change In Federal Debt To GDP Or Potential GDP


