

GDP, employment, manufacturing, debt, unemployment, etc.

Figure 1: GDP in bn.2017$ under Biden relative to first quarter of administration (blue), GDPNow for 3/7 (sky blue square), under Trump (orange). Source: BEA, Atlanta Fed, and author’s calculations.
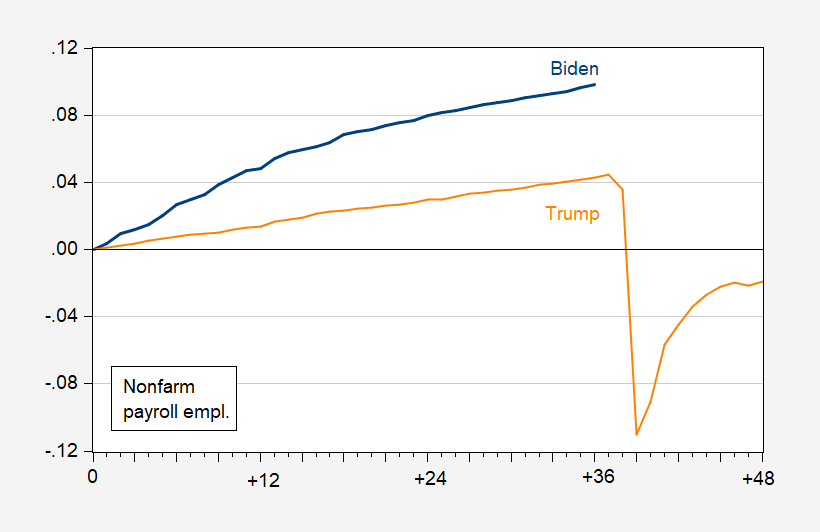
Figure 2: Nonfarm payroll employment under Biden relative to first quarter of administration (blue), under Trump (orange). Source: BLS, and author’s calculations.
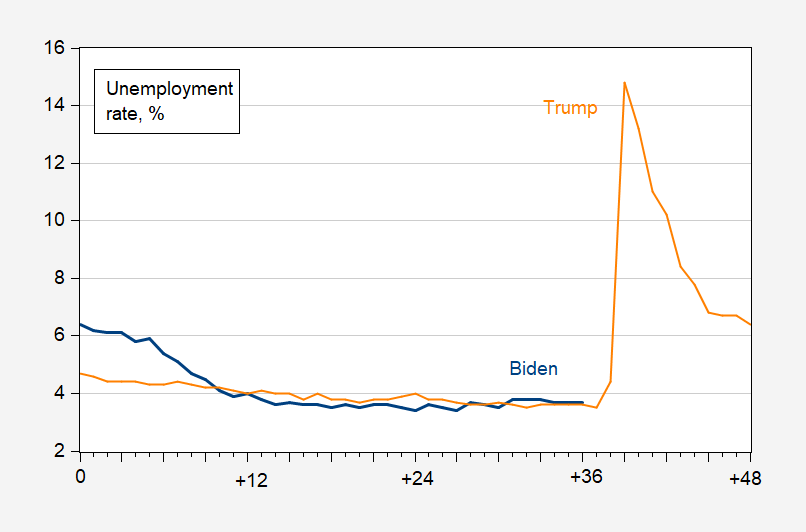
Figure 3: Unemployment rate under Biden (blue), under Trump (orange). Source: BLS.

Figure 4: Manufacturing employment under Biden relative to first quarter of administration (blue), under Trump (orange). Source: BLS, and author’s calculations.
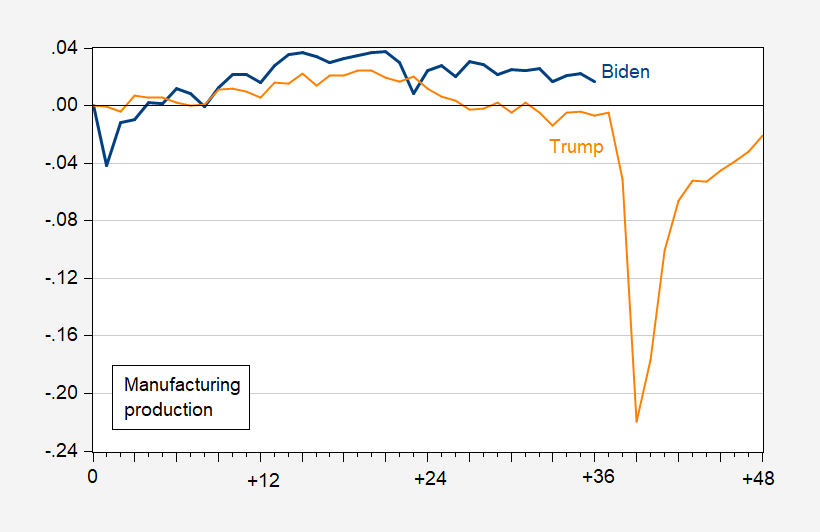
Figure 5: Manufacturing production under Biden relative to first quarter of administration (blue), under Trump (orange). Source: BLS, and author’s calculations.

Figure 6: Change in Federal debt to GDP ratio under Biden relative to first quarter of administration (blue), under Trump (orange). Source: BLS, and author’s calculations.
More By This Author:
LP Derived IRFs For Disasters On GDP
Year-On-Year Change In Federal Debt To GDP Or Potential GDP
Business Cycle Indicators Plus Monthly GDP. And Heavy Truck Sales


Comments
Log in or sign up to join the conversation.