Term Spreads And Break-Evens

As of today:
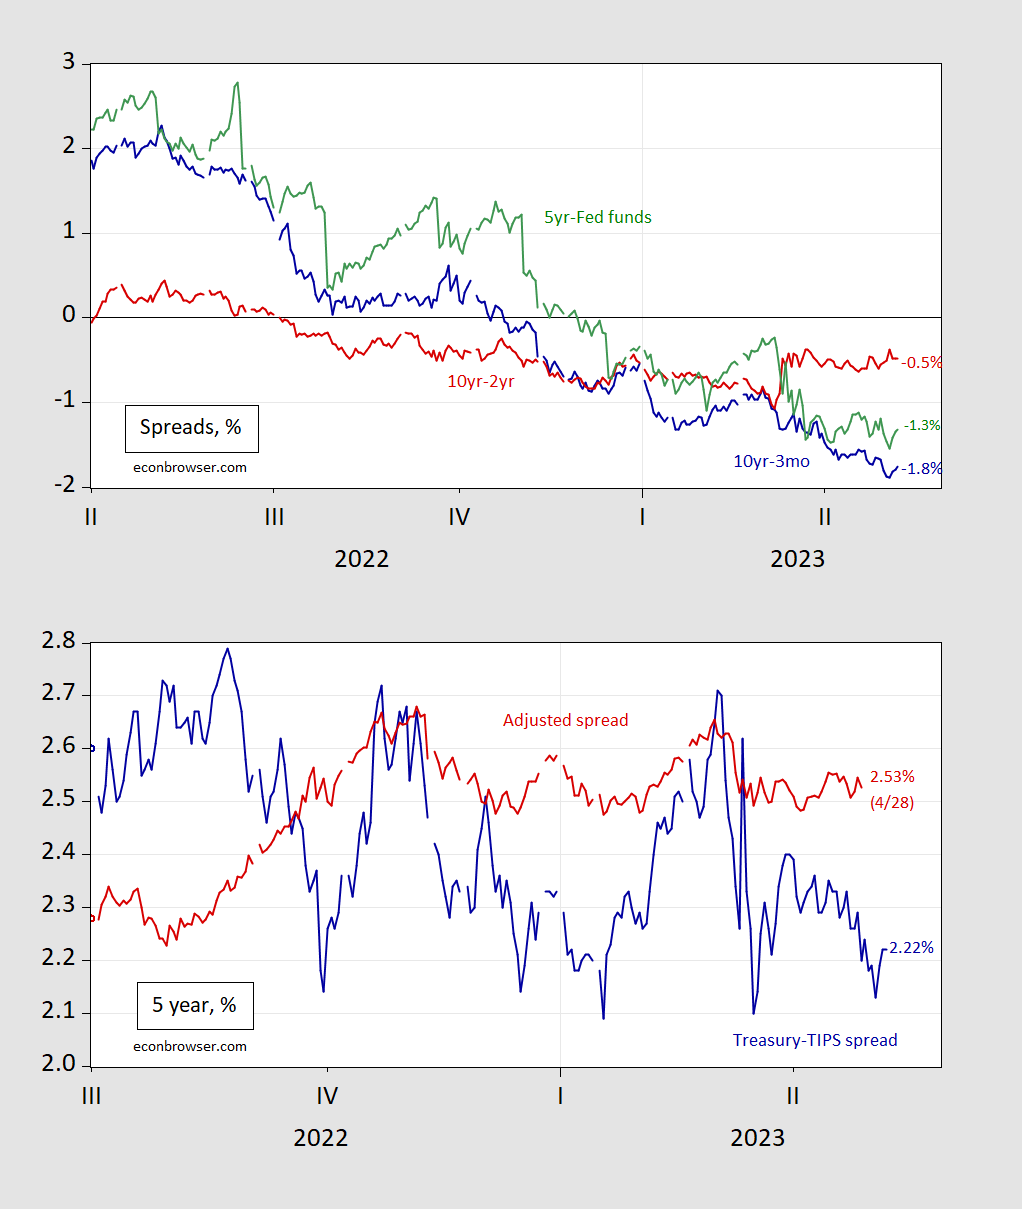
Figure 1, Panel A: Ten year-three month term spread (blue), ten year-two year (red), and five year-Fed funds (green), in %. Panel B: Five year Treasury minus five year TIPS spread (blue), and expected five year inflation (red), in %. Source: Treasury via FRED, KWW (accessed 5/9), and author’s calculations.
The top panel shows two familiar spreads, while the third (5 yr-Fed funds) has the highest AUROC for a six month ahead forecast of recession. As is clear, all the spreads remain inverted.
The bottom panel indicates that inflation expectations for the next five years have fallen, but perhaps not as much as indicated by simple break-even calculations would indicate.
More By This Author:
CDS Spreads On One Year TreasuriesBusiness Cycle Indicators, Incorporating The Employment Release
Real Wages, Overall And Leisure/Hospitality
Comments
Please wait...
Comment posted successfully
No Thumbs up yet!


