
Decidedly up in the latter, even up relative to 2022M02 in the former.
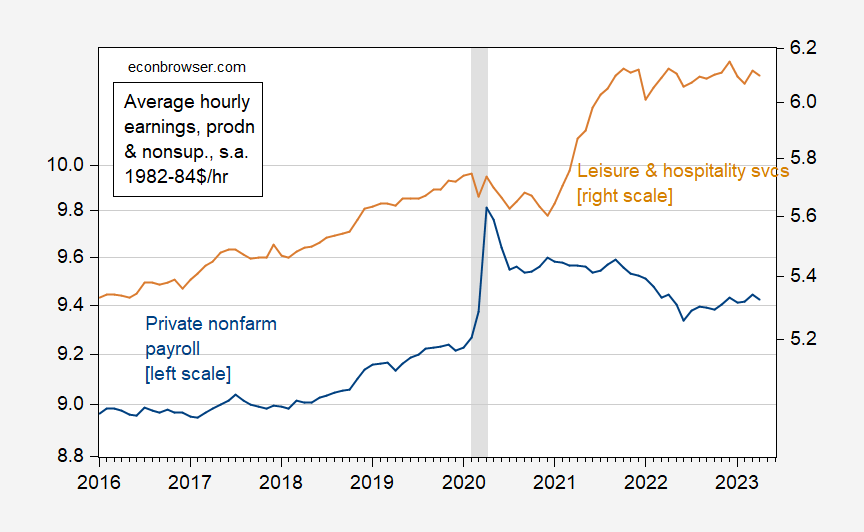
Figure 1: Real average hourly earnings in total private (blue, left log scale), and in leisure and hospitality (tan, right log scale), in 1982-84$, s.a. April figures deflated using Cleveland Fed nowcast for CPI. NBER defined peak-to-trough recession dates shaded gray. Source: BLS, Cleveland Fed, NBER, and author’s calculations.
If using the PCE deflator, one obtains Figure 2:
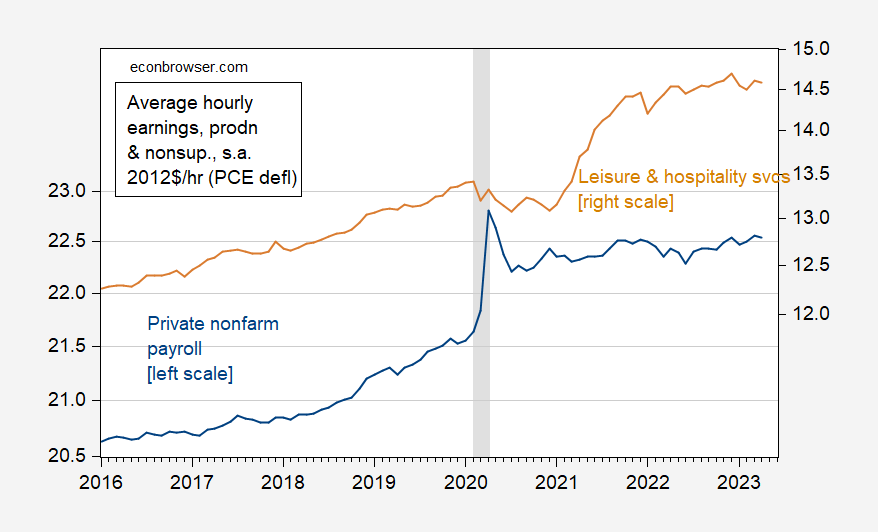
Figure 2: Real average hourly earnings in total private (blue, left log scale), and in leisure and hospitality (tan, right log scale), in 2012$ (PCE deflator), s.a. April figures deflated using Cleveland Fed nowcast for PCE. NBER defined peak-to-trough recession dates shaded gray. Source: BLS, BEA, Cleveland Fed, NBER, and author’s calculations.
Implicitly, I’m addressing an issue of inequality, given leisure and hospitality wages are usually lower than the average (as measured by FRED series AHETPI, shown in the blue lines above.
More By This Author:
Of Nowcasts And RevisionsProductivity And Costs In Q1
Thirty-Year Mortgage Treasury Spread


Comments
Log in or sign up to join the conversation.