
Tariffs, What Tariffs?
The September 2025 edition of the global leading economic indicator chartbook can be found here. Additional details on the methodology are available here.

Image Source: Pixabay
One point on the methodology that I may not have made entirely clear: the aggregate leading economic indicator diffusion referred to below—and shown in the first charts of the chartbook—is not the same as a standard diffusion index. It is calculated as the sum of two figures: the number of leading indicators that are high and rising minus those that are high and falling, and the number of leading indicators that are low and rising minus those that are low and falling.
This approach is designed to provide a more accurate turning point signal than a simple diffusion index. For the September 2025 edition specifically, the value for the G20 leading economic indicators, shown on page three of the chartbook, has been extrapolated to reflect a small rise. This mirrors the increase in the G7 indicator, as the G20 value had not yet been updated when the data was pulled from the OECD.
I seem to have a knack for releasing these chartbooks just as markets are hit with a curveball. The August edition came out in the wake of the soft August payrolls report, which opened the door to a dovish shift by the Federal Reserve and rattled investor sentiment with renewed concerns about a potential slowdown—or even a recession—in the U.S. economy.
At that time, I highlighted three risks to positive investor sentiment and a still-robust economy: the threat of tariffs and trade tensions, the question of whether the AI-driven rally in equity markets and investment would prove sustainable, and rising fiscal risks in major developed economies, including the United States.
The first of these risks materialized on Friday when Mr. Trump threatened a 100% tariff on Chinese consumer goods, in response to Beijing’s decision to impose export controls on rare earth metals. Based on past patterns and the market’s optimistic positioning ahead of the announcement, Mr. Trump is likely to push markets lower in the near-term.
At the same time, most investors expect—reasonably—that he will eventually backtrack. The prevailing belief is that the White House has little appetite for inflicting a sustained economic burden on U.S. markets and the broader economy through a sharp and prolonged tariff-based decoupling from China and other trading partners. Investors are currently counting on this restraint to remain a circuit breaker for downside in markets. Time will tell whether they’re right.
More broadly, global leading indicators remained in a broad-based upturn at the end of the third quarter, as show in the chart below. The latest revisions show a strengthening trend, following a temporary dip in the latter part of the second quarter.
(Click on image to enlarge)
Ten out of twenty leading indicators were trending upward in September, unchanged from August after revisions. These data now suggest that, by the end of the third quarter, momentum in the global economy had regained much of what was lost during the initial chaos and uncertainty triggered by Mr. Trump’s “Liberation Day” announcement.
Whether this recovery will hold remains to be seen, as investors and the global economy may now be facing another round of tariff escalation. If that materializes, downside risks will intensify in the fourth quarter and early next year.
Coincident indicators also firmed at the start of the third quarter, aligning with the continued upturn in leading indicators throughout the period. Growth in global industrial production and trade rose to 4.2% year-over-year in July, up from 3.5% in June. While still below the 5.5% recorded in March—driven by front-running ahead of tariffs—this is a solid pace. So far, the data show little evidence of a meaningful slowdown in global activity in response to U.S. tariff measures.
The three-year rolling Z-score of the global leading economic indicators, often a reliable early signal, appeared to improve further in late Q3. However, since the G20 indicator value had not been updated at the time the data were pulled from the OECD, this signal should be interpreted with some caution in the September 2025 release.
Equity markets have rebounded strongly from the “Liberation Day” lows, a move that is broadly consistent with the improving trend in leading indicators. As noted in earlier analyses, the rally has become increasingly narrow and concentrated, with technology stocks continuing to lead. That said, Friday marked an important reversal day, which likely will trigger further selling pressure through October.
The first principal component (PC1) of global economic indicators remained in a clear and strengthening downtrend in September. PC1 captures common cyclical patterns across countries and typically peaks during synchronized global downturns. Its current weakness suggests divergence between economies and may reflect underlying resilience in parts of the global system.
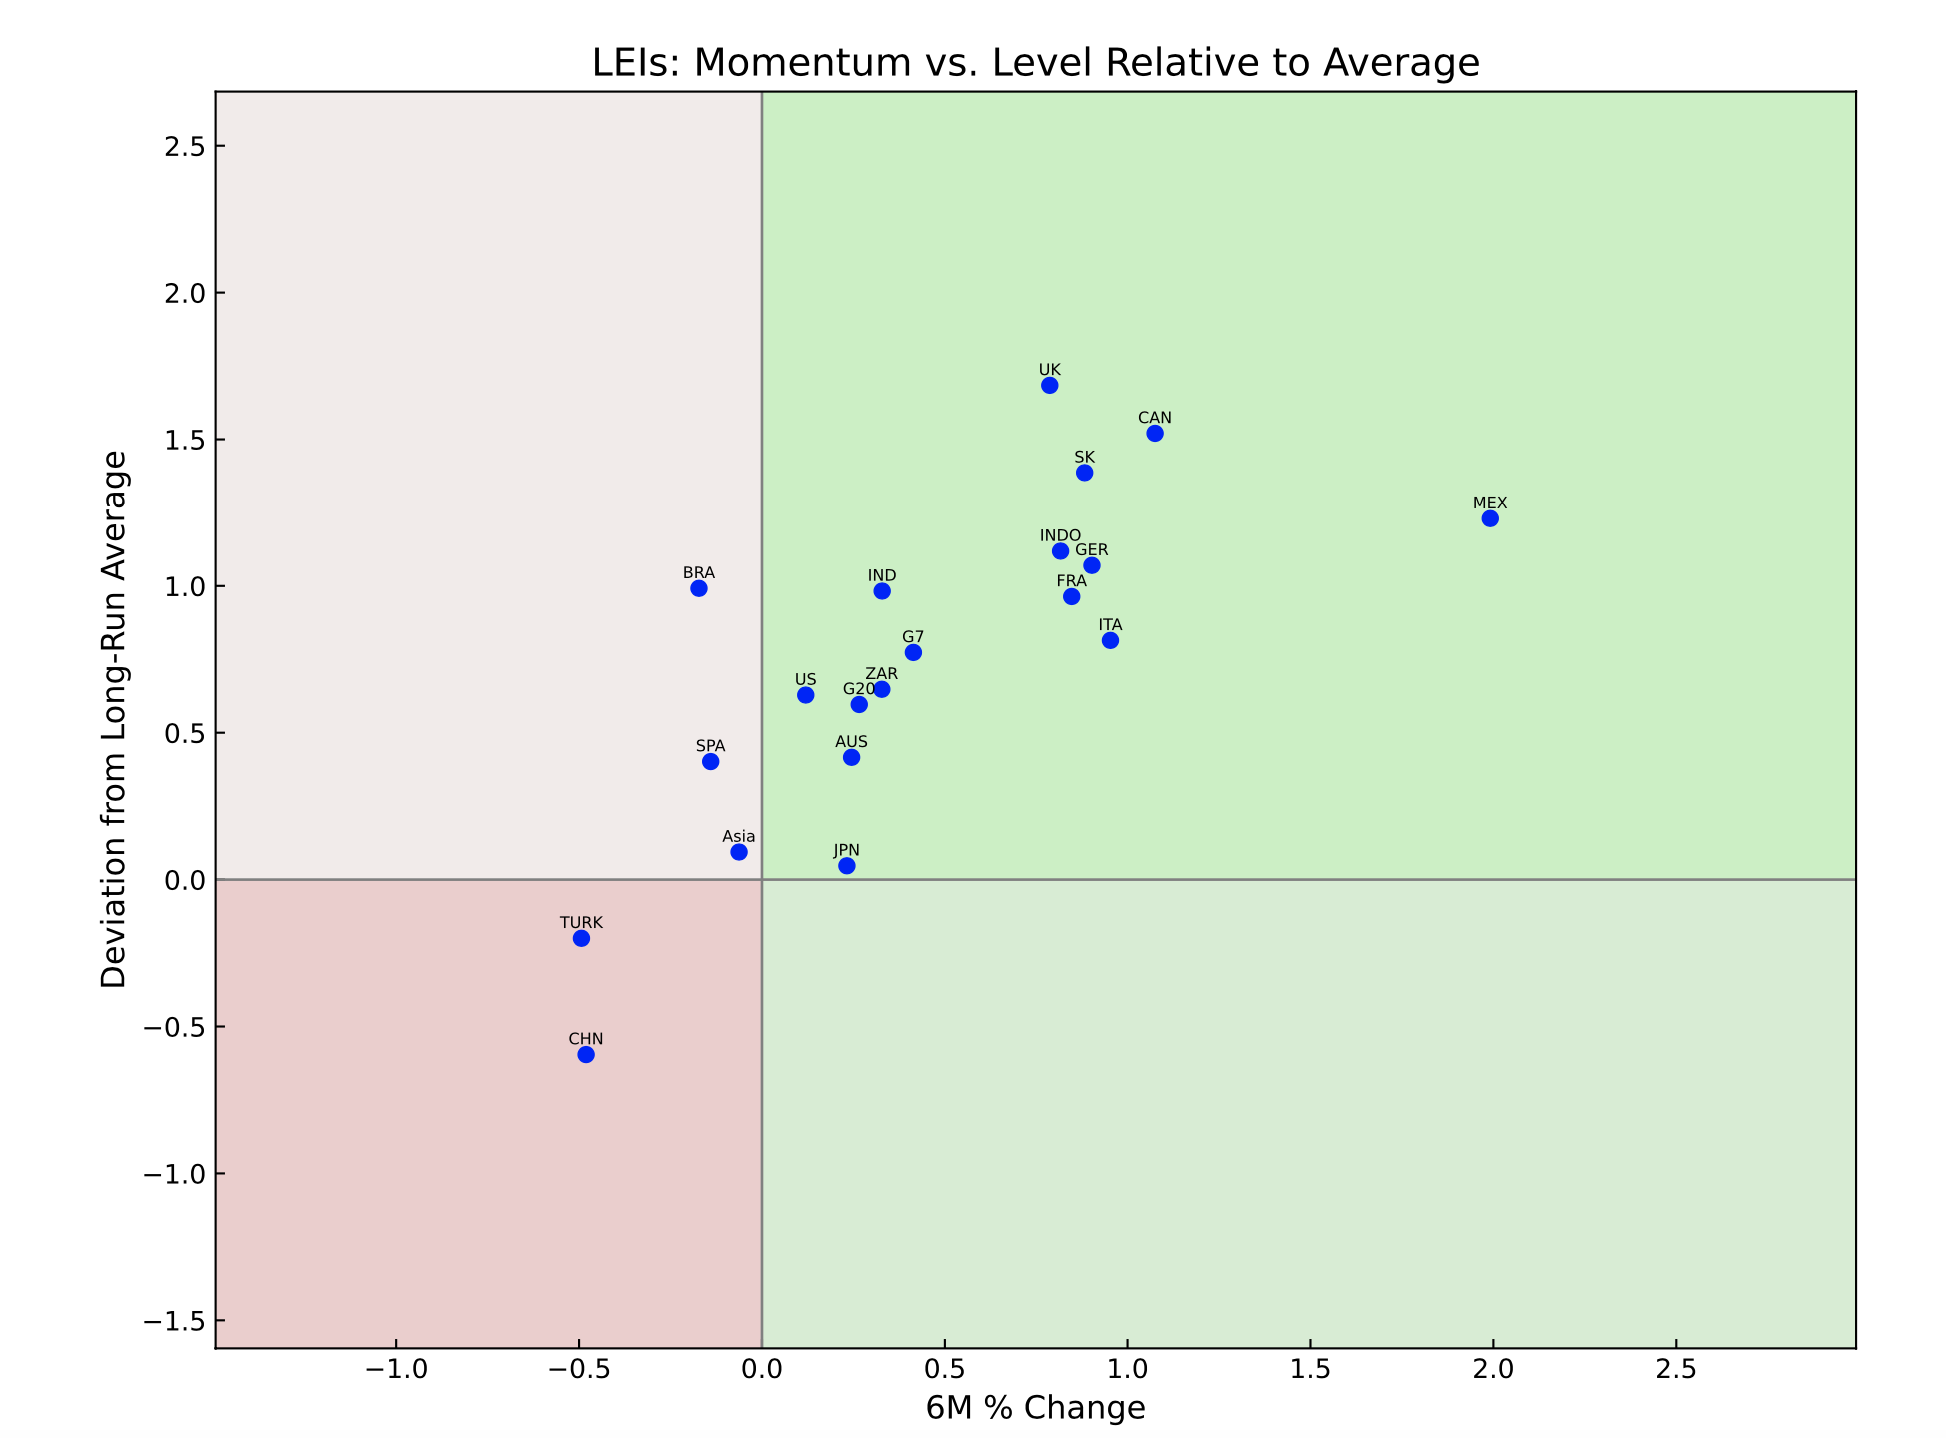
Country-level data remained generally robust at the end of the third quarter, with only a handful of countries showing signs of cyclical weakness. Notably, the ongoing downturn in China’s leading economic indicators and early signs of softness in the broader Asia indicator point to a potentially significant area of weakness in that region.
Elsewhere, Spain, Turkey, and Brazil have now been added to the watchlist for possible cyclical deterioration, based on the September update. Meanwhile, Mexico’s leading economic indicator has completed a strong rebound and now stands out as one of the strongest among individual country indicators. This development had been flagged in prior updates. At present, the model does not point to any clear candidates—defined as having leading economic indicators that are low and rising—for a similar rebound.
More By This Author:
The Siren Song Of Dollar WeaknessEquity Sector Rotation Chartbook For September 2025 - Running Hot, And Narrow
Who's Afraid Of Payrolls Anyway?
Disclosure: None


