
The Bureau of Economic Analysis announced today that seasonally adjusted U.S. real GDP grew at a 2.8% annual rate in the first quarter. That’s close to the long-run historical average of 3.1%, and continues what has now become a fairly impressive record of an economy that continues to chug along despite constant predictions of its imminent demise.
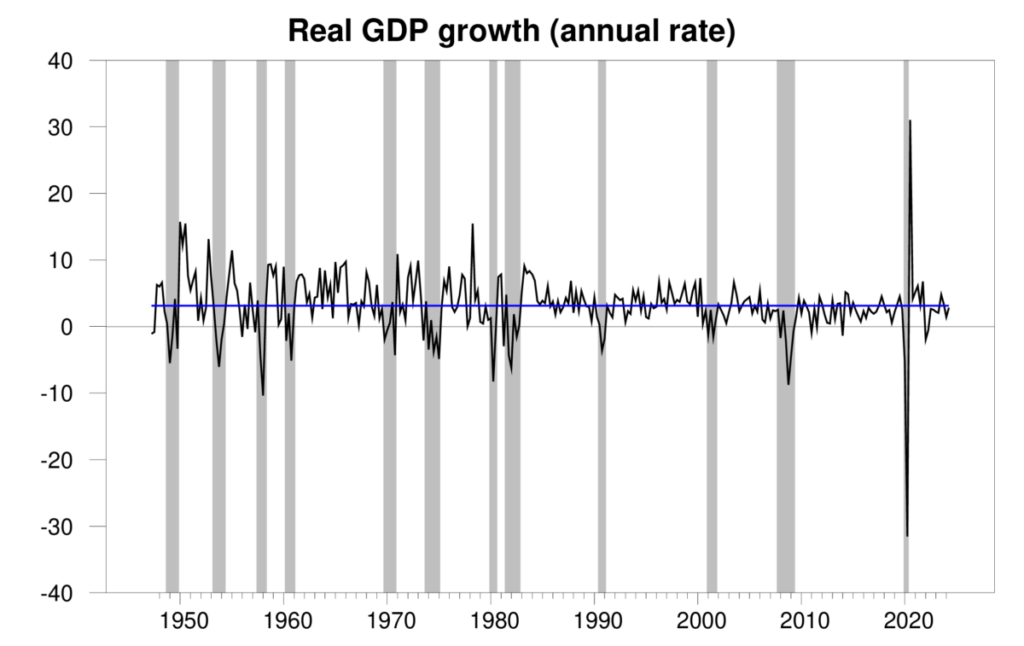
Quarterly real GDP growth at an annual rate, 1947:Q2-2024:Q2, with the historical average (3.1%) in blue. Calculated as 400 times the difference in the natural log of real GDP from the previous quarter.
The new numbers put the Econbrowser recession indicator index at 4.0%. That’s historically a very low level, indicating unambiguous continuation of the economic expansion that began in 2020:Q3.
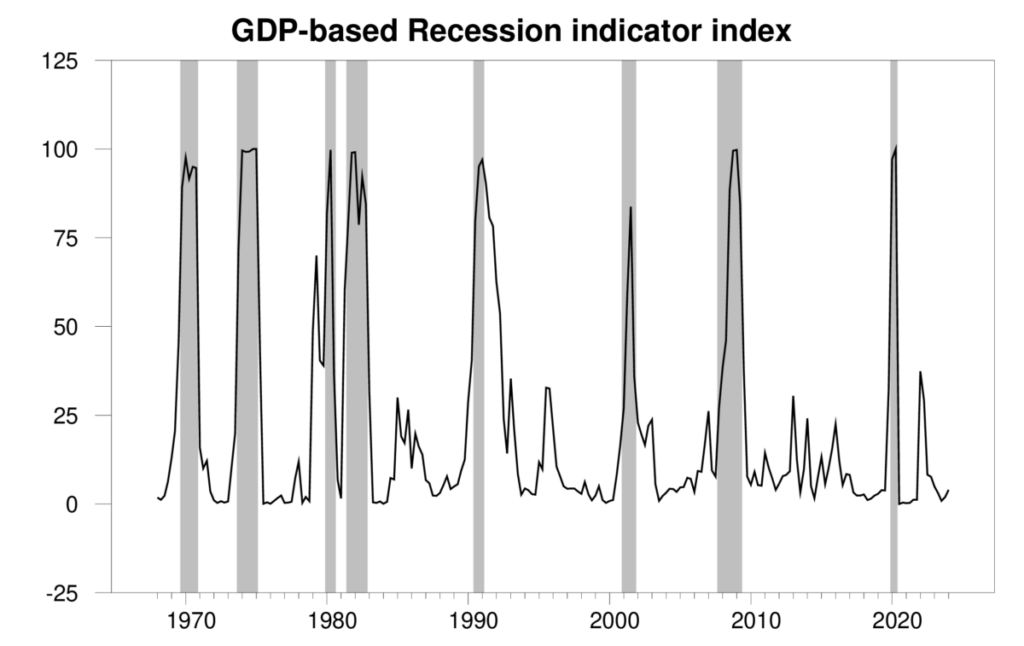
GDP-based recession indicator index. The plotted value for each date is based solely on the GDP numbers that were publicly available as of one quarter after the indicated date, with 2024:Q1 the last date shown on the graph. Shaded regions represent the NBER’s dates for recessions, which dates were not used in any way in constructing the index.
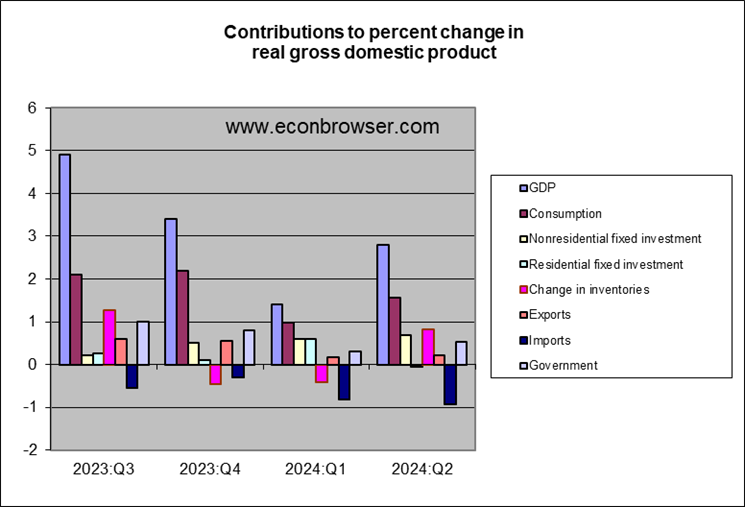
Many analysts commented that the 2.8% Q2 estimate seems a sharp improvement over Q3’s 1.4%. But inventory swings, which tend to be transitory, account for most of the difference. Without the draw-down of inventories in Q1, real final sales would have been up 1.8%, and without the build-up of inventories in Q2, real final sales would have been up only 2.0%.
To paraphrase Mark Twain, reports of the death of the U.S. economy have been greatly exaggerated.
More By This Author:
CBO: Budgetary And GDP Implications Of The Immigration Surge
Instantaneous Core Inflation
Alternative Business Cycle Indicators - Monday, July 22


Comments
Log in or sign up to join the conversation.