Rally In SPX Should Continue

Image Source: Pixabay
SPX Monitoring purposes; Long SPX on 10-29-24 at 5832.92
Our Gain 1/1/23 to 12/31/23 SPX= 28.12%; SPX gain 23.38%
Monitoring purposes GOLD: Long GDX on 10/9/20 at 40.78.

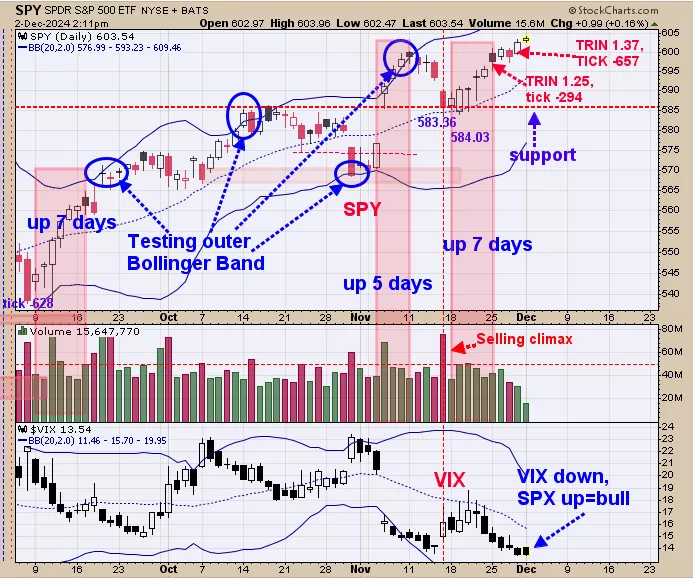
We are up 36%; SPX up 27% so far this year. November 26 marked 7 days up in a row and suggests the market will be higher in 10 days over 80% of the time. Friday and today the market has made higher highs. Last Monday the TRIN closed at 1.25 and the tick at -294 and Friday the TRIN closed at 1.37 and ticks at -657, both of which shows panic and bullish signs. Rally in SPX should continue. Long SPX on 10/29/24 at 5832.92.

Last Thursday we presented the NYSE advance/NYSE decline with a 5 day average. Short term lows have been found when this indicator reaches below .70. November 15 this indicator closed at .68 and pretty much marked the low in the market. Above in the bottom window is the NYSE advancing/NYSE declining issues with a 3 day average.Intermediate bullish signs occur when this indicator goes from .70 to 3.00 in 10 day or less (noted in shaded pink).November 15 marks the start date with a reading of .68 and hit 3.28 on November 25 (10 days). We shaded in pink the previous instances when this indicator was triggered. This indicator suggests an intermediate term rally is starting.

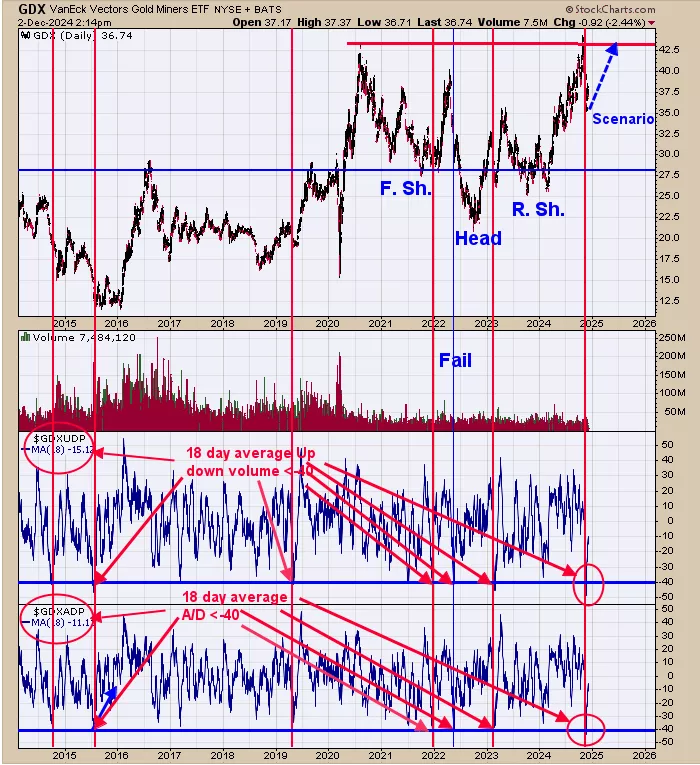
We updated this chart from last week, last week’s commentary still stands, “We have a short term buy and weekly and monthly buy signals.Above is another intermediate term buy signal. The bottom window is the 18 day average of the advance/decline and next higher window is the 18 day average of the up down volume, both for GDX. Buy signals are triggered when both indicator fall below -40 and turn up (noted with red lines). The last signal came in mid November. Turn your attention to the GDX chart (top window). The pattern that may be forming on GDX is a Head and Shoulders bottom where the Head is the 2022 low and the Neckline lies near 43.00. This potential Head and Shoulders pattern has a measured target to over 60.00.According to the monthly charts, GDX has another year to rally at a minimum and the 60.00 range is a possibility.”
More By This Author:
Signals are provided as general information only and are not investment recommendations. You are responsible for your own investment decisions. Past performance does not guarantee future performance. ...
more


