Spike In Volume
SPX Monitoring purposes; Long SPX on 10-29-24 at 5832.92
Our Gain 1/1/23 to 12/31/23 SPX= 28.12%; SPX gain 23.38%
Monitoring purposes GOLD: Long GDX on 10/9/20 at 40.78.

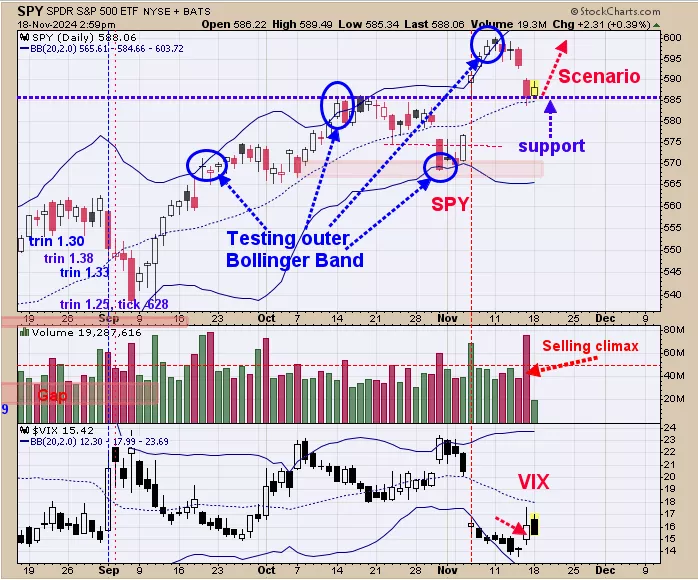
We are up 31.40%; SPX up 25.7% so far this year. The top window is the SPY and next lower window is the volume. Notice on Friday there was a spike in volume that was near 100% increase from the previous days. This spike in volume suggests a “Selling Climax” and stops the decline in the market. Some times there are test of the “Selling climax” low but not always. In general the market is setting at another low and a rally should unfold in the next several days. Long SPX on 10/29/24 at 5832.92.

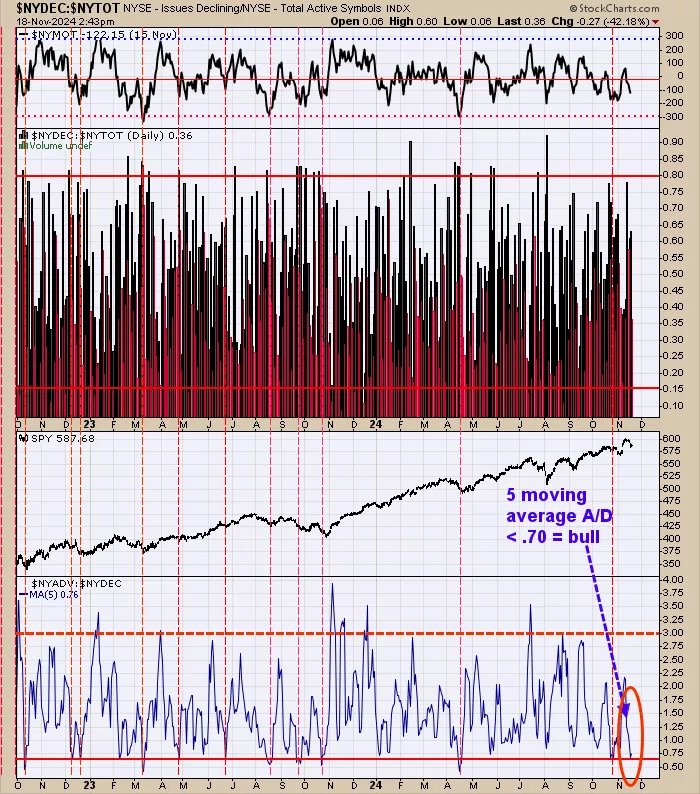
The bottom window is the NYSE advancing/NYSE declining with a 5 day average. Lows in the SPY are found when this indicator falls below .70 (Friday close came in at .68). We use to use .65 but .70 seems to works just as well. We used this indicator at the last low in late October. The intermediate term trend is up until at least year end.

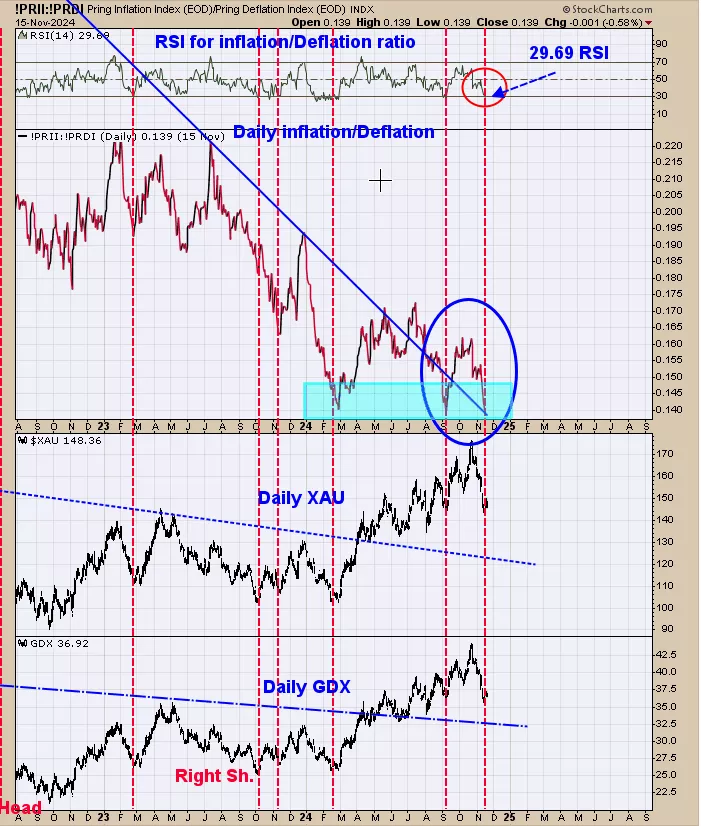
Last Thursday we said, “Monday we showed the monthly cumulative up down volume for GDX with its Bollinger band and the monthly cumulative advance/decline for GDX with its Bollinger band. Buy signals where triggered when both indicators close above their mid Bollinger band which came in May 2024. Most signals of this type last 1 ½ years or longer. We updated the shorter term view for GDX yesterday suggesting a low was near (see yesterday’s report). Above is another bullish signal for GDX short term. The second window down from the top is the daily inflation/deflation ratio with its RSI in the top window. Bullish signals for GDX are triggered when the RSI nears 30 and turns up (current reading is 31.13). We noted is shaded green on the inflation/deflation ratio graph the times when this ratio reached .14 which appears to be a triple bottom. This chart gives another clue that GDX is making a low in this area.” The chart above is updated to current statistics; top window is the current daily RSI for the inflation/deflation ratio which stands at 29.69 suggests a low for GDX and XAU.
More By This Author:
Stalling Short Term
Market Could Stall Short Term
Bullish Seasonality
Signals are provided as general information only and are not investment recommendations. You are responsible for your own investment decisions. Past performance does not guarantee future performance. ...
more


Thanks for reading, all the best, Tim Ord