Stalling Short Term

Image Source: Pixabay
SPX Monitoring purposes; Long SPX on 10-29-24 at 5832.92
Our Gain 1/1/23 to 12/31/23 SPX= 28.12%; SPX gain 23.38%
Monitoring purposes GOLD: Long GDX on 10/9/20 at 40.78.

We are up 31.40%; SPX up 25.7% so far this year. The top window is the SPY/TLT ratio. Its common for this ratio to show a divergence near highs and lows in the SPY. In other words the ratio will made lower highs and the SPY makes higher high or ratio will make higher low as the SPY makes lower lows. We noted in shaded green when both the ratio and SPY are making higher highs and noted in shade pink where ratio is making lower highs as SPY is making higher highs. Currently the ratio is making higher highs suggesting at some point the SPY will make higher highs. We are long SPX position. Long SPX on 10/29/24 at 5832.92.

Above is the weekly SPY with its Bollinger band. The weekly SPY can stall short term when 50% of the trading range closes above its outer Bollinger band. We circled in blue the instances dating back to 2023 when this condition developed. We have a squared box in shaded green pointing to where the SPY is now. The SPY is hovering at the upper Bollinger band and can move higher but probably at a slower rate as the upper Bollinger band act as resistance. Support lies at the previous high near 585 SPY. The intermediate term trend is up until at least year end.

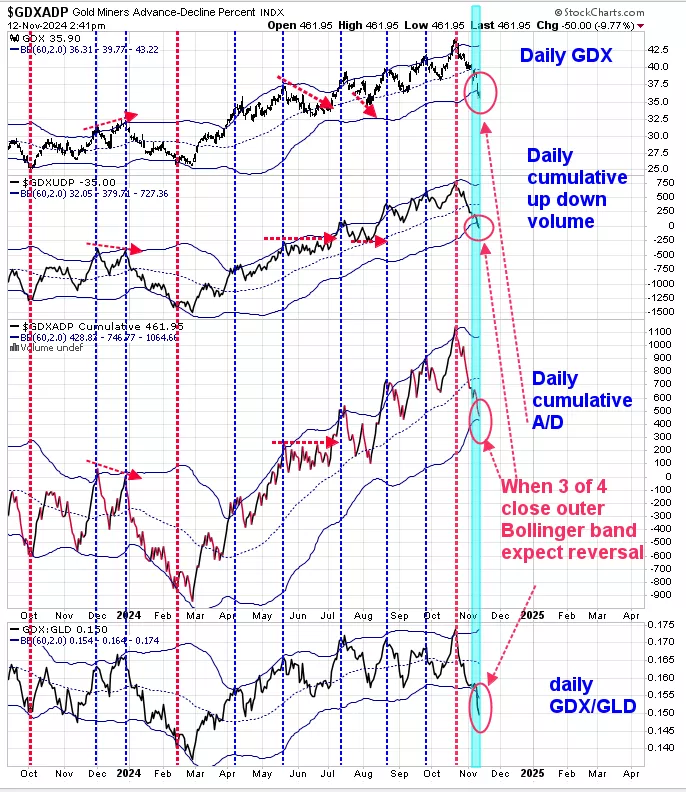
Yesterday we showed the monthly cumulative up down volume for GDX with its Bollinger band and the monthly cumulative advance/decline for GDX with its Bollinger band. Buy signals where triggered when both indicators close above their mid Bollinger band which came in May 2024. Most signals of this type last 1 ½ years or longer. Therefore the current buy signal may last into November 2025 or longer. Above is a shorter term view for GDX. The bottom window is the daily GDX/GLD with its Bollinger band; next higher window is the daily GDX cumulative Advance/decline with its Bollinger band and next higher window is the GDX cumulative up down volume with its Bollinger band and top window is GDX with its Bollinger band. Reversals in GDX are likely when at least 3 of the four indexes above trade out side of their Bollinger bands. We noted with red dotted lines where lows formed for GDX and blue dotted lines when highs formed. We noted in shaded green where the current setup lies and there are 3 indexes below there lower Bollinger bands suggesting GDX is near a low.
More By This Author:
Market Could Stall Short Term
Bullish Seasonality
Upside For The Market Is Limited
Signals are provided as general information only and are not investment recommendations. You are responsible for your own investment decisions. Past performance does not guarantee future performance. ...
more


