
Flashback Hoot of the Day: When Will China Overtake the US?
In Flashback Hoot of the Day: When Will China Overtake the US? I discussed a bet that Michael Pettis made with the Economist on when China would pass the US in GDP.
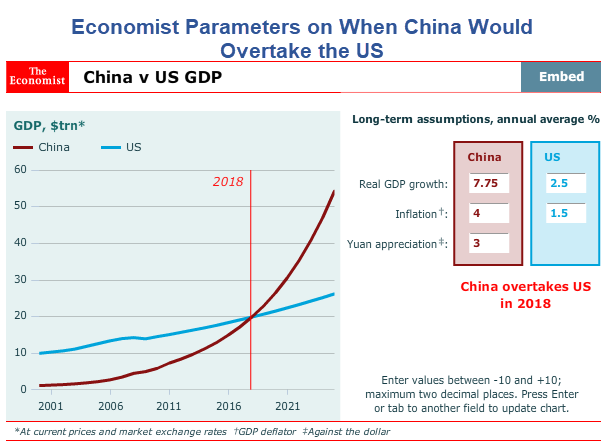
The Economist made a bet with Pettis in 2012 that by 2018 China would pass the US. The Economist lost the bet by a mile. China is still not close to the US in GDP. A couple of my readers say not so, based on PPP.
For starters, the bet was not on a PPP basis. More fundamentally, PPP is horrendously flawed. First let’s discuss reader comments,
Reader Comments
- The best comparative measure of national economies is widely accepted to be Purchasing Power Parity (PPP). Comparison of nominal GDP by converting all output to dollar equivalents is not meaningful. PPP GDP captures the real productive value of an economy. By PPP, China’s economy surpassed that of the U.S. several years ago and is substantially larger.
- Both the IMF and the World Bank recognize that China’s economy is larger than that of the U.S. Only the CIA, which for obvious political reasons continues to cling to nominal GDP measure, offers a different conclusion.
Hoot of the Day
The CIA clings to non-PPP based GDP. What a hoot! The CIA has nothing to do with this. If anything, it is the IMF that wants to back PPP for political reasons. I will skip other inane comments and get straight to the point.
Michael Pettis: “Adjusting GDP for differences in purchasing power makes a great deal of sense in certain cases, but the way it is done is so filled with problems that it is extremely difficult to find any economist who takes these measures very seriously.“
Math Behind the PPP Calculations
The above statement is the opening line in a Michael Pettis 2014 article Math Behind the PPP Calculations?
A new PPP study complied by the World Bank has generated some pretty excited and, to some, alarming headlines about the new world order. There has been limited reference to this in the Chinese press, for reasons I will discuss later, but here is the Financial Times on the subject:
The US is on the brink of losing its status as the world’s largest economy, and is likely to slip behindChinathis year, sooner than widely anticipated, according to the world’s leading statistical agencies. The US has been the global leader since overtaking the UK in 1872. Most economists previously thought China would pull ahead in 2019.
…In 2005, the ICP thought China’s economy was less than half the size of the US, accounting for only 43 per cent of America’s total. Because of the new methodology – and the fact that China’s economy has grown much more quickly – the research placed China’s GDP at 87 per cent of the US in 2011. For 2011, the report says: “The US remained the world’s largest economy, but it was closely followed by China when measured using PPPs”.
And contrary to what the article says later, the World Bank findings should not “intensify arguments about control over global international organisations such as the World Bank and IMF, which,” the article correctly notes, “ are increasingly out of line with the balance of global economic power”.
The concept behind PPP is quite simple. You cannot always compare two countries in a meaningful way by comparing their GDPs at current exchange rates. Prices are different in different countries in ways that current exchange rates do not offset. This means that relative living standards are a function of more than just relative incomes.
While there is no question that countries like China, India and Brazil should see an increase in their representation among international bodies, it is not because the PPP measure tells us much about the relative weight of these countries.
Its usefulness lies elsewhere. The PPP adjustment attempts to measure the relative living standards between the two countries adjusting for the fact that prices are not equal at current exchange rates. A family earning $40,000 in one country, for example, will have the same nominal income but a better standard of living than a family earning $40,000 in another country if both families spend a significant portion of their income on nannies for their children, and if nannies are far cheaper in the first country than in the second.
This is really what the PPP adjustment tells us, but even here there are lots of obvious problems when we try to compare the two countries. One such problem is the assumption that both families have the same consumption baskets, which the PPP adjustment implicitly assumes. It is very unlikely that this is true for all sorts of reasons, not the least being that consumption itself is affected by relative prices. All of us are likely to adjust our consumption baskets in favor of those goods and services that are cheapest in relative terms.
In Beijing, for example, the cost of getting someone to clean your apartment is far, far lower than it is in New York. On the other hand New York has one of the most vibrant theater scenes in the world. No one would be surprised to hear, consequently, that someone currently living in Beijing is likely to have a cleaning lady come to his apartment far more often than he did when he lived in New York, and is less likely to go to the theater in Beijing than he did when he lived in New York. In that case comparing his standard of living in Beijing and New York, even assuming he had the same income in both places, can be pretty difficult.
But these are all obvious problems with the PPP measure, the kinds that are discussed in almost any undergraduate economics class. As long as we keep them in mind we can find the PPP measures to be quite useful in some circumstances, even if in our excitement over the kinds of news stories that generate headlines we interpret PPP to have geopolitical implications that are almost the opposite of reality.
But there is another problem with the PPP measure that is much greater, so much so that in some cases it completely invalidates PPP as having any kind of informational content.
Remember that the PPP adjustment is an attempt to correct for a significant distortion in direct GDP comparisons. The PPP model has two important assumptions. The first assumption, an explicit one, is that different countries assign different prices to the goods and services consumed domestically in a way that is not fully captured in the exchange rate. The PPP adjustment is an attempt to correct for this by taking the US economy as the standard, comparing prices of a specified basket of goods and services in the US with the second country (China, in this case), and adjusting China’s numbers upwards or downwards to reflect these differences.
But the second assumption, implicit but just as important, is that the US GDP numbers very broadly capture economic activity in the US in the same way that China’s GDP numbers capture economic activity in China.
Here, of course, is where the PPP calculation can fall apart, and it is why the assumption should be explicitly stated. If you are comparing the US with an economy that construct GDP in a fairly similar way, Canada for example, PPP adjustments can be very illuminating because it allows you to compare like with like. But if GDP is constructed very differently than it is in the US, the second assumption is violated, in which case the PPP adjustment becomes simply another random comparison, which might or might not be better than the non-adjusted GDP numbers.
In China, it turns out, and not surprisingly, the composition of GDP is very different than it is in the US, mainly because the two countries measure debt very differently. It is not because China sets out to record debt differently – on the contrary, most people will tell you China records it in the same way the US and other countries do, and China certainly intends to. The problem is that in China bad debt is rarely recognized, repayment isn’t enforced, and default is almost non-existent. Banks simply roll bad debt over indefinitely. This makes comparisons between the two countries pretty hard.
It turns out that the difference between the way the US and China implicitly construct GDP shows up in the way bad debts are treated, and by bad debt I mean the excess of the cost of an investment over its value. What happens if you borrow $100 to create an asset that ends up being worth only $80? The best way to treat this would be to create an $80 asset and the equivalent of a $20 expense, with the latter loss showing up as a claim against profits (for a company) or GDP (for a country).
This is effectively what we do when we write down debt in a market-based financial system. If an investor borrows $100 and invests it in an asset that creates only $80 of value, he will either default, and the debt will be liquidated, with the difference between$100 and $80 showing up as an expense (as loan loss provisions in a bank, for example), or he will write down the difference by transferring money from operating earnings or the sale of assets, with the write-down showing up as an expense.
Let’s assume that in China defaults do not happen to the same extent that they do in the US. First of all, is this a reasonable assumption? It clearly is. Except for the occasional insignificantly small one, defaults are extremely rare in China, largely because much of the lending into what we usually assume are the worst projects are implicitly or explicitly guaranteed by the state or by local governments.
Although I don’t have numbers with me I think it is pretty safe to say that the number and value of defaults in China are a small fraction of those in the US. For this there are only two possible explanations. One is if Chinese investors are and have been far, far less likely to make bad investments than US investors (90-95% less likely if there are 10-20 times as many defaults in the US as in China relative to the sizes of their economies).
A few years ago there may have been a few very brave people who still believed this, but not too many still do. With a comparatively short history of making investments, much more rapid credit growth in recent years, extraordinarily low interest rates compared to nominal GDP growth rates, and seemingly near-infinite amounts of moral hazard, it is implausible that Chinese investors are so far less likely to make bad investments than US investors.
That leaves the only other possible explanation, which is that bad investments are simply not recognized within the banking system to the same extent that they are in the US, and are in fact rolled over. Because even government officials and senior bankers have admitted many times that this is what happens, I think we can assume that it does. The automatic consequence, if this is true, is that a lot of what should be recorded as “expenses”, e.g. loan losses, are actually treated in China’s GDP calculations as “assets”.
This matters when we compare China’s GDP with that of the US. The two countries treat the accumulation of bad debt in very different ways (not because China intends to, but simply because it is politically difficult in China to force repayment when most of the borrowers hare politically powerful), and as in the case of the first company relative to the second, this difference means that as long as China is accumulating and rolling over bad debts, China’s GDP and its assets will be significantly overstated relative to those of the US.
One ironic implication of course is that if China were to engage in an orgy of bad investment, it would get poorer (as more and more money goes to what in reality are expenses) while artificially boosting its GDP growth (as more and more expenses are converted into assets). This seems to have been what happened in 2009-10 and thereafter.
Unless you believe that the US fails to recognize losses on investments to anywhere near the same extent, if you really want to compare the two economies more usefully you would have to do at least two adjustments: you would have to adjust China’s GDP upwards for price differentials and also adjust it downwards for unrecorded losses.
The whole issue of measuring GDP is incredibly complex, and it isn’t meaningful at all to say that a country’s real GDP is some quantity more or less than its stated GDP.
My point is a lot smaller and a lot more precise. China and the US compile their GDP data implicitly in very different ways, among the most notable of which is the way Chinese lenders, banks as well as households, treat a substantial portion of the debt as if it were implicitly or explicitly guaranteed by central or local government agencies. This means investment losses don’t show up as losses (expenses) because it is politically difficult to do so, and are instead rolled over and so show up as assets.
But another difference – and this may be just as important, or even more so, then relative price differentials – is that the two countries’ balance sheets are not comparable, because of debt, and have materially different ways implicitly to recognize the gap between the cost of an investment and the value of that investment. Adjusting for this fact, I would argue, is just as important in any comparison of the two economies as adjusting for price differences.
PPP adjustments are useful when we are comparing two economies that are structurally similar and that compile GDP in ways that make them comparable.
But if we are going to compare two very dissimilar economies, France and Sudan, for example, or Brazil and North Korea, or the US and China, we have to be cautious because there are many other equally important adjustments we must make before we can usefully compare their GDPs. The PPP adjustment is an obvious example, but in these cases just adjusting on a PPP basis is a pretty random way of choosing which adjustment we are going to make.
So what? It may be a random adjustment but it is still an adjustment, right? On average, adjusting for PPP probably leaves us no worse off than not adjusting for PPP, so why would we want to oppose doing so?
Only because the adjustment can imply far more certainty than is warranted (a common mathematical mistake among non-mathematicians). We should be wary because of the implication that PPP is not just a random adjustment, and that it actually significantly improves our ability to compare any two economies. In some cases it does, but too often it cannot and actually makes the comparison worse. While the PPP adjustment should increase our confidence in our ability to say something meaningful about the relative sizes of the US and Canada, it should not increase our confidence in our ability to say something meaningful about the relative sizes of the US and China.
Conclusion
“Adjusting GDP for differences in purchasing power makes a great deal of sense in certain cases, but the way it is done is so filled with problems that it is extremely difficult to find any economist who takes these measures very seriously,” and to that I would add, especially for countries that hide debt as assets and who calculate GDP in vastly different ways.
Thoughts of the Day
- Comparisons of US to China using PPP is horrendously flawed. China, by any realistic measure, did not pass the US in GDP.
- “It is far, far better and much safer to have a firm anchor in nonsense than to put out on the troubled seas of thought.” John Kenneth Galbraith (1958).
- “Few things are harder to put up with than the annoyance of a good example.” Mark Twain, The Tragedy of Pudd’nhead Wilson (1894)
Looking for Deflation? Cast Your Eyes on China, Not the US
Please consider China Exports and Imports Collapse, Harbinger of the Global Economy?
More importantly, please consider Looking for Deflation? Cast Your Eyes on China, Not the US
Demographics in China have turned hugely negative. Coupled with a massive debt bubble that resulted from China trying to achieve ridiculous GDP targets, China is following closely in the deflationary footsteps of Japan.
China has not passed the US in GDP and will not do so any time soon.
More By This Author:
China Exports And Imports Collapse, Harbinger Of The Global Economy?
Wind Energy Projects Suffer From A Multi-Pronged Blow
Is GDPplus A Better Version Of GDP?


Comments
Log in or sign up to join the conversation.