
The Bureau of Economic Analysis announced today that seasonally adjusted U.S. real GDP grew at a 2.6% annual rate in the third quarter. That’s close to the historical average (3.1%), and is a welcome sequel to the two quarters of falling GDP with which we started the year.
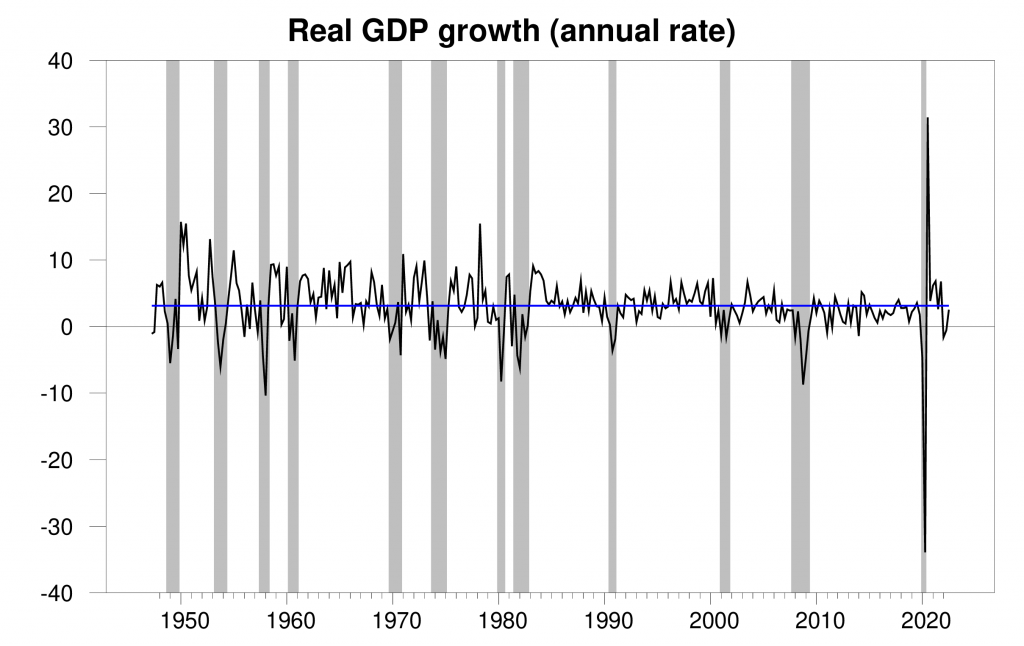
Real GDP growth at an annual rate, 1947:Q2-2022:Q3, with the historical average (3.1%) in blue. Calculated as 400 times the difference in the natural log of GDP from the previous quarter.
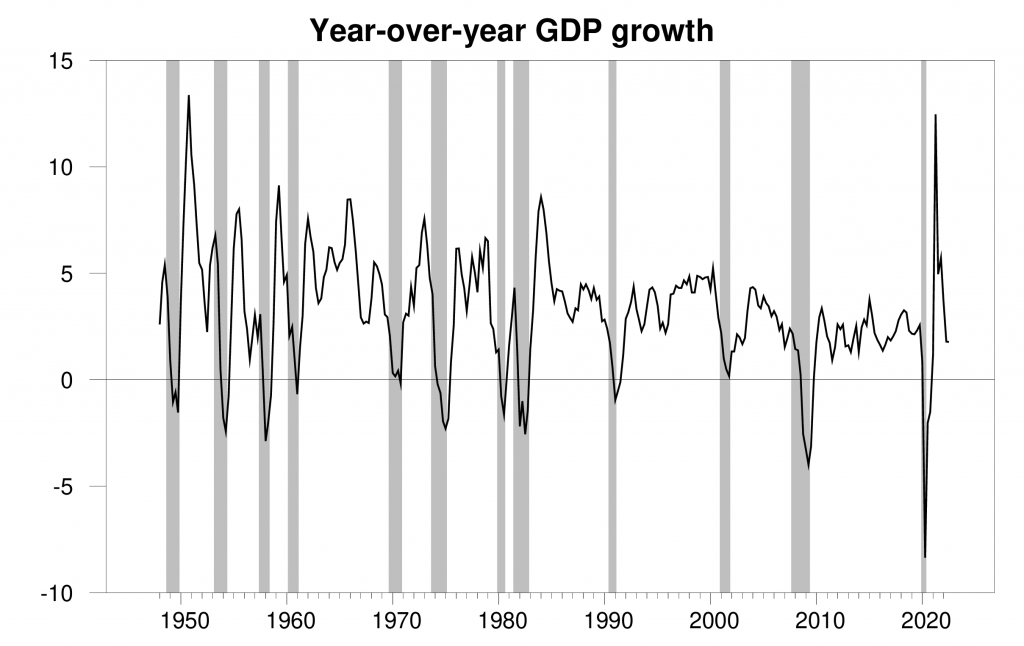
Here’s what the data look like when plotted as year-over-year growth rates.
The new data helped the Econbrowser recession indicator index to ease down a little to 29.2%. This is an assessment of the situation of the economy in the previous quarter (namely 2022:Q2). The index takes into account the fact that the Q3 growth was positive to refine the assessment of where the economy was last quarter. When Marcelle Chauvet and I first developed this index 17 years ago, we announced that we would only declare a recession to have started when the index rises to 65% (see pages 14-15 in our original paper).
The index itself is never revised, though each quarter’s updates and revisions to GDP allow an improved assessment of the economic conditions several quarters earlier as well the value of the index that we announce in real time based on the initial GDP report. If subsequent data send the real-time indicator above 65%, we would use the full range of revised historical data available at that date to announce the date at which the recession likely started. Here at Econbrowser we’ve followed that procedure to the letter as the data were released in real time over the last 17 years, successfully dating the beginning and end of the two recessions since we started this blog.
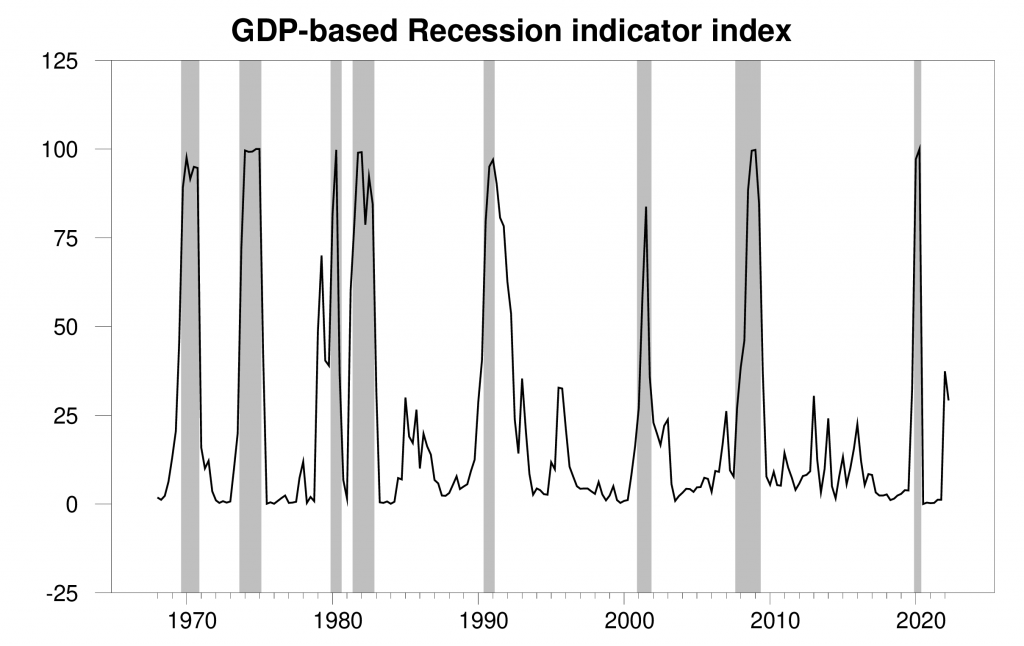
GDP-based recession indicator index. The plotted value for each date is based solely on the GDP numbers that were publicly available as of one quarter after the indicated date, with 2022:Q2 the last date shown on the graph. Shaded regions represent the NBER’s dates for recessions, which dates were not used in any way in constructing the index.
The recent hikes in interest rates have brought the U.S. housing market down quite quickly. The drop in new home construction subtracted 1.4% from the 2022:Q3 annualized GDP growth rate.

Another channel by which higher interest rates can slow GDP growth is through a stronger dollar, which discourages U.S. exports and encourages U.S. imports. But surprisingly, exports increased and imports decreased in Q3, between them adding +2.8% to the annual GDP growth rate. Nearly half of the rise in exports came from petroleum and products, as the U.S. stepped into the gap created by disruptions in Russian shipments. Supply-chain issues may have contributed to the decline in imports. With the headwinds from a strong dollar, it’s hard to see a big positive contribution from trade continuing.
Mild weather has eased some of the challenges Europe was facing with natural gas cut-offs from Russia, at least for now. But Europe’s energy situation will still be rough in 2023 and will be a drag on Europe and the world economy. China’s ongoing efforts to curtail COVID are another very serious headwind to global economic growth. When added to the continuing effects of the monetary contraction, a recession within the next year is a distinct possibility.
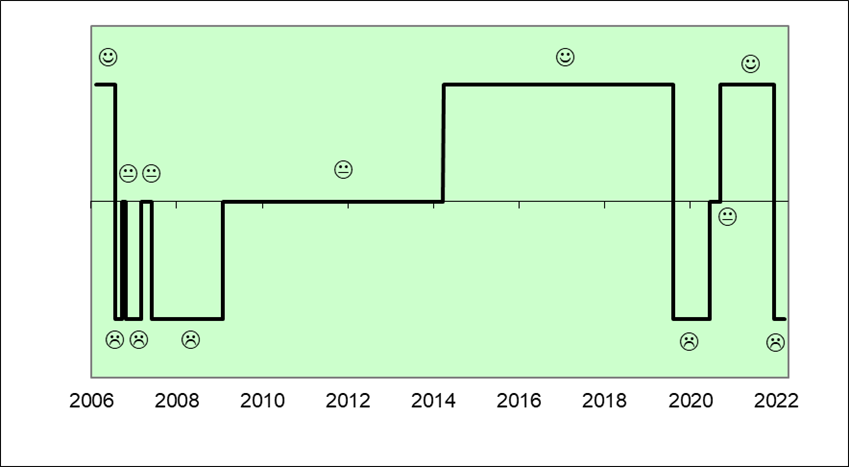
So while the Q3 GDP growth is welcome, our Little Econ Watcher remains very worried.
(Click on image to enlarge)
More By This Author:
Gauging Recessions with the Jobs-Workers Gap
Is This A Recession?
Miscalculating potential GDP
Comments
Log in or sign up to join the conversation.