
Today, we are fortunate to present a guest contribution written by Paweł Skrzypczyński, economist at the National Bank of Poland. The views expressed herein are those of the author and should not be attributed to the National Bank of Poland.
In February Goldman Sachs introduced the jobs-workers gap (Briggs & Hatzius, 2022). This measure is defined as the difference between the total number of jobs (i.e. employment plus job openings) and the number of workers (i.e. the labor force). We present the most recent reading of this gap and show a simple rule of using it in order to track the business cycle.
Formally, we calculate the jobs-workers gap for month as , where is household employment level, is job opening level and is labor force level. Notice that the gap calculated in this manner is scaled in number of workers. Alternatively one can express this gap relative to labor force level, i.e. as plotted in Figure 1. Notice that job openings data is available from Dec 2000, which means that some proxy of it is needed to calculate the jobs-workers gap for months prior to Dec 2000. To achieve that one uses the Help-Wanted Index developed by Barnichon, 2010 (data available on this website). Namely for months prior to Dec 2000 the Help-Wanted Index is used, while job openings time series for Dec 2000 and further months.
Figure 1. Jobs-Workers Gap (Percent)
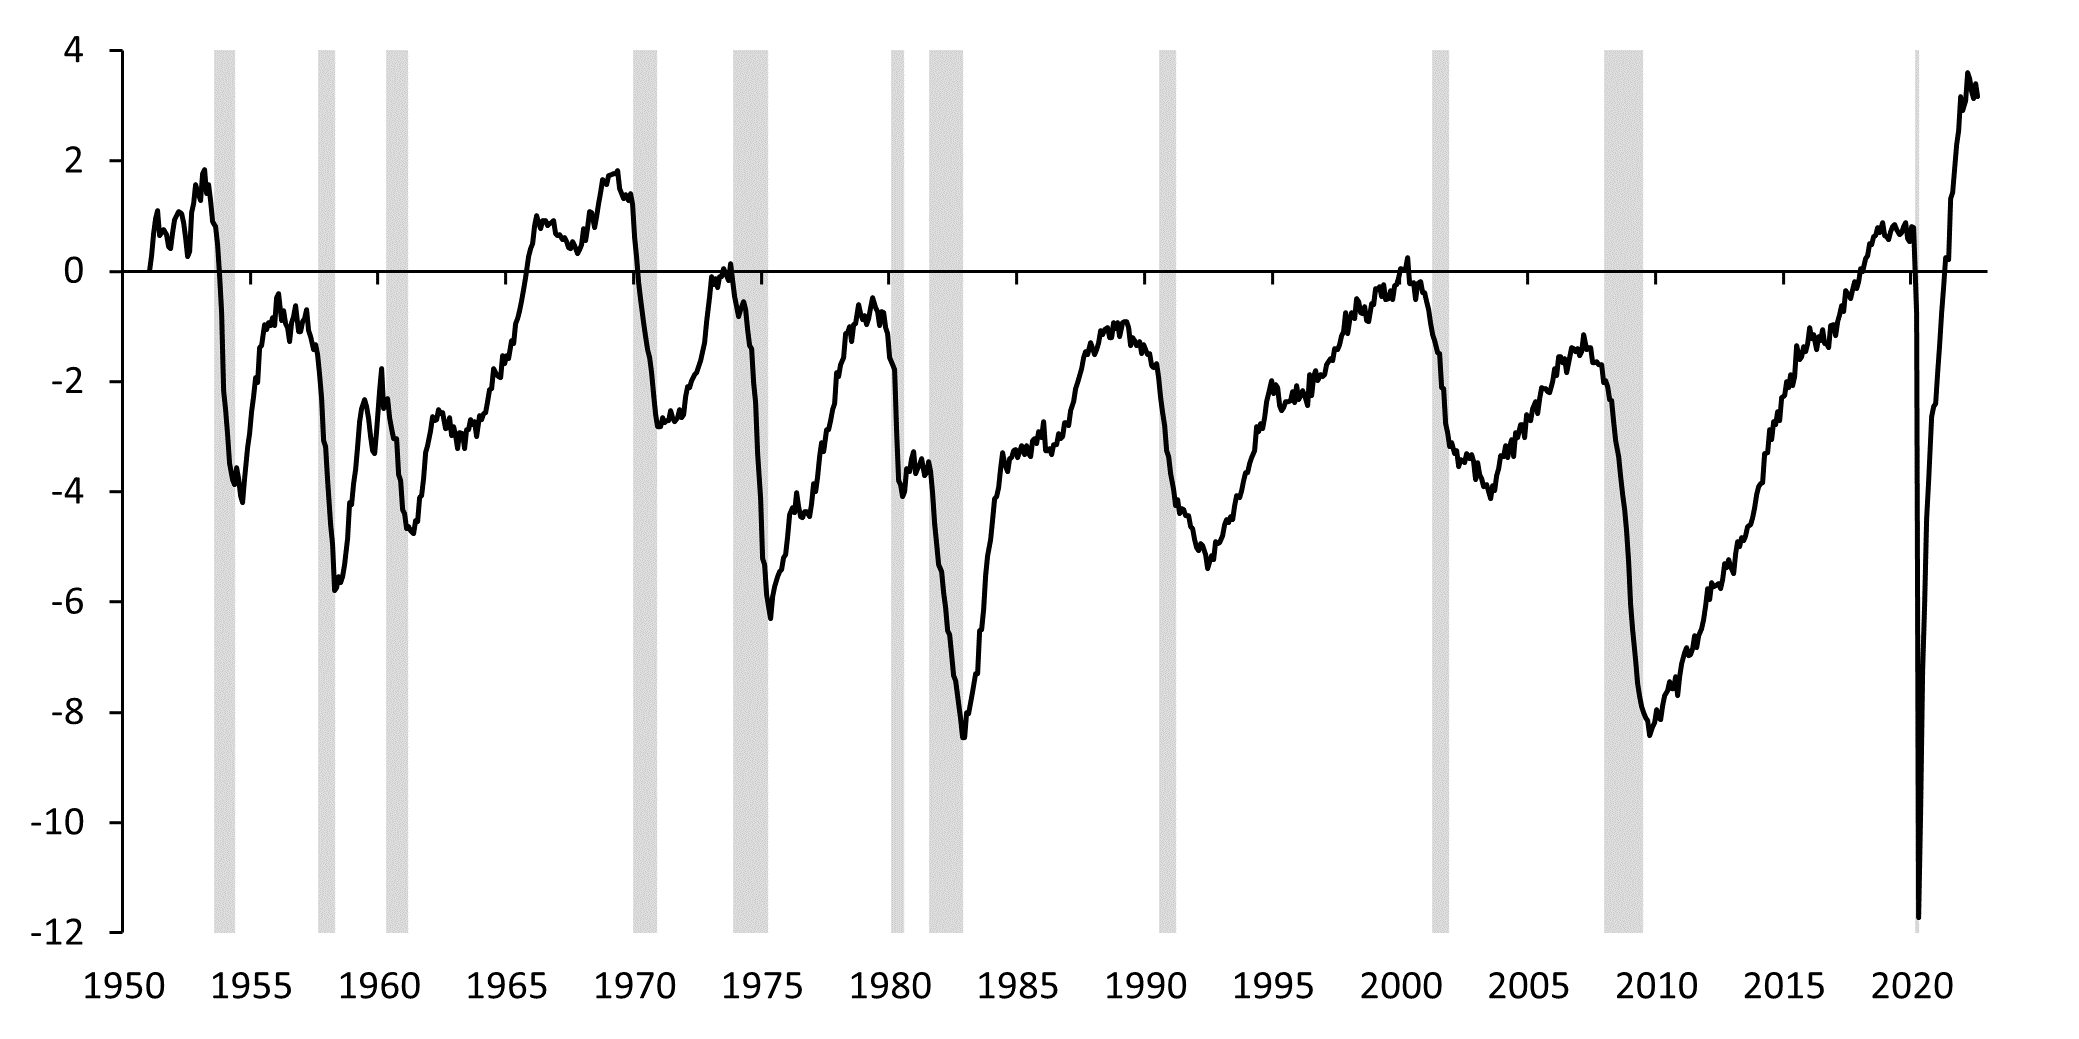
Notes: Calculations based on BLS releases The Employment Situation – August 2022, September 2, 2022, Job Openings and Labor Turnover – July 2022, August 30, 2022 and historical data for the Help-Wanted Index by Barnichon, 2010.
As of July 2022 the jobs-workers gap was at 5.6mn workers, meaning that employment and job openings (total labor demand) exceeded labor force (total labor supply) by 3.4%. Historically this reading was near an all-time high level of 3.6% (5.9mn workers) reached in March 2022. While job openings data for August is not available at the time the August household employment and labor force data is released, we make a working assumption that job openings did not change in August compared to July. Alternatively one can use job postings weekly data from Indeed to make a bridge regression and nowcast August job openings. Assuming constant level of job openings in August and incorporating August employment situation release (household employment increased by 442k m/m and labor force increased by 786k m/m) we find that the jobs-workers gap was at 3.2% (Figure 1) down 0.2 percentage points from July level.
What magnitude of change from the current level of the jobs-workers gap would be sufficient to generate a recessionary signal? To answer this question we propose a following measure. Namely, we calculate the m/m change in the three-month moving average of the jobs-workers gap, i.e. , relative to its maximum during previous twelve months. Smoothing allows us to get a less volatile time series which is more useful for tracking the cycle. The resulting measure, called the jobs-workers gap business cycle indicator (JWGBCI), is scaled in percentage points and plotted in Figure 2. Notice that derivation of this indicator is similar to what is done with the three-month moving average of the unemployment rate when calculating the so called “Sahm Rule”. Along with the JWGBCI time series we plot a recession threshold resulting from Berge & Jordà, 2011, framework. Namely we calculate a threshold value of the JWGBCI that maximizes the utility of the classification into periods of recession and expansion, so that the benefits of hits equal the costs of misses in magnitude. In other words the recession threshold value found using this method, which is -0.93 percentage points, is the optimal level of the JWGBCI that separates recessions from expansions.
Figure 2. Jobs-Workers Gap Business Cycle Indicator (Percentage Points)

Notes: Calculations based on BLS releases The Employment Situation – August 2022, September 2, 2022, Job Openings and Labor Turnover – July 2022, August 30, 2022 and historical data for the Help-Wanted Index by Barnichon, 2010.
If we were to declare that the recession began, we would need to see the JWGBCI fall to -0.93 or below. As of July 2022 the JWGBCI was at -0.19 percentage points versus -0.15 percentage points in June. Our conditional “guesstimate” based on the unchanged level of job openings in August was at -0.22 percentage points. Thus we conclude that despite labor market conditions eased somewhat at the beginning of Q3, they remained tight and visibly distant from levels associated with recession. Notice that for example if we were to observe the JWGBCI to reach -0.93 in September, we would need to see the underlying jobs-workers gap fall 2.2 percentage points m/m to the level of 1% (i.e. equivalent of 1.6mn workers gap in terms of August labor force level). Such a big move in one month was not seen, apart from the initial period of the COVID-19 pandemic, and given current economic developments seems highly unlikely.
Overall, we show that current labor market conditions remain tight and that they would need to deteriorate strongly in order for the JWGBCI to generate a recession call. Softening of the JWGBCI readings do not mean that the recession is imminent, unless the recession threshold is reached. Therefore we would interpret future values of this indicator above the recession threshold as being consistent with the soft landing scenario.
References
Barnichon R., 2010, Building a composite Help-Wanted Index, Economics Letters, 109 (2010): 175-178.
Berge T. J., Jordà Ò, 2011, Evaluating the Classification of Economic Activity into Recessions and Expansions, American Economic Journal: Macroeconomics, 3 (2): 246-77.
Briggs J, Hatzius J., 2022, More Jobs than Workers: A New Measure of Labor Market Tightness, US Economics Analyst, Goldman Sachs Economics Research.
More By This Author:
Is This A Recession?
Miscalculating potential GDP
Why Did U.S. Real GDP Fall?
Comments
Log in or sign up to join the conversation.