
The Bureau of Economic Analysis announced today that seasonally adjusted U.S. real GDP fell at a 1.4% annual rate in the first quarter. What does this portend?
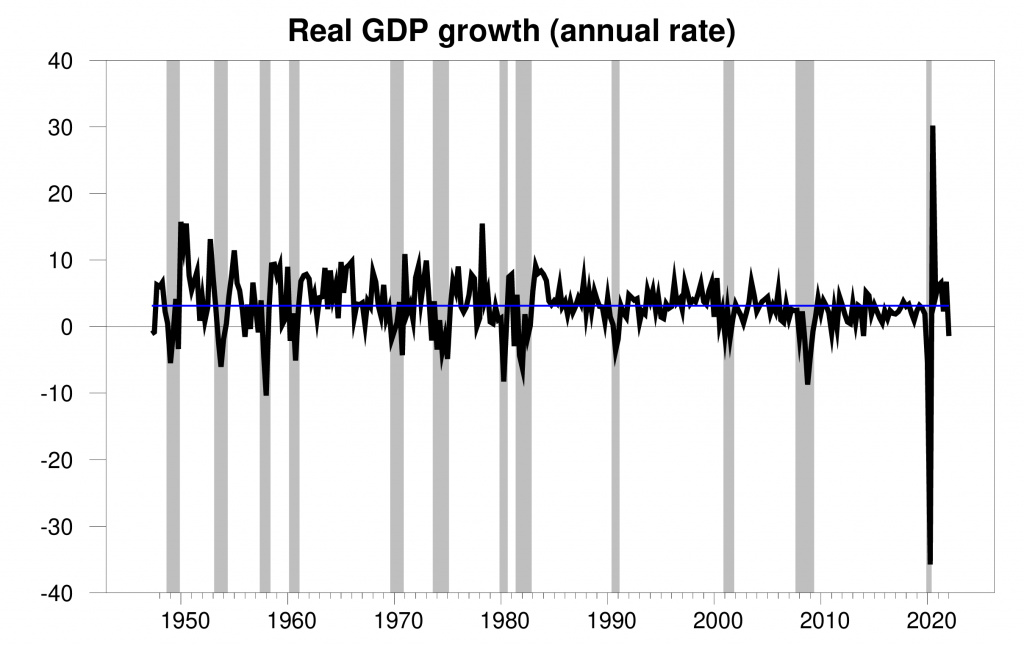
Real GDP growth at an annual rate, 1947:Q2-2022:Q1, with the historical average (3.1%) in blue. Calculated as 400 times the difference in the natural log of GDP from the previous quarter.
The new data left the Econbrowser recession indicator index at 1.2%, signaling very clearly that the economic expansion continued at least through the end of last year. This is not a predictive measure, but rather is an assessment of the situation of the economy in the previous quarter (namely 2021:Q4). We use the one-quarter lag to allow for data revisions (more on which below) and to gain better precision. This index provides the basis for an automatic procedure that we have been implementing for 15 years for assigning dates for the start and endpoints of economic recessions. We would declare a recession to have started if the index rises above 67%.
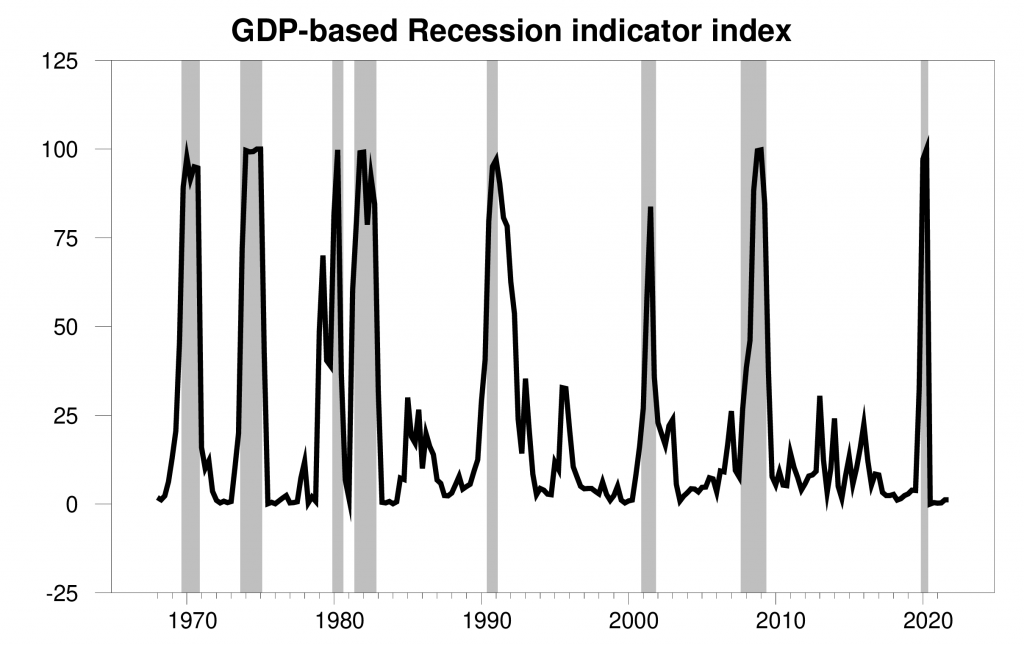
GDP-based recession indicator index. The plotted value for each date is based solely on the GDP numbers that were publicly available as of one quarter after the indicated date, with 2021:Q4 the last date shown on the graph. Shaded regions represent the NBER’s dates for recessions, which dates were not used in any way in constructing the index.
Some may wonder whether a withdrawal of fiscal stimulus could be a factor in the negative GDP growth. I’m skeptical of that possibility. The blue line in the graph below shows personal income excluding taxes and transfer payments, while the red adds transfer payments and subtracts taxes. The Coronavirus Aid, Relief, and Economic Security Act in March 2020 and the American Rescue Plan Act in March 2021 produced huge surges in disposable personal income, with total transfer payments exceeding personal taxes collected. Taxes net of transfers are now back near historical levels. It’s hard to look at this graph and conclude that the stimulus efforts associated with the red line have been the main driver of consumption spending in green. Indeed, the growth of U.S. consumption spending was stronger in 2022:Q1 than it had been in 2021:Q4.
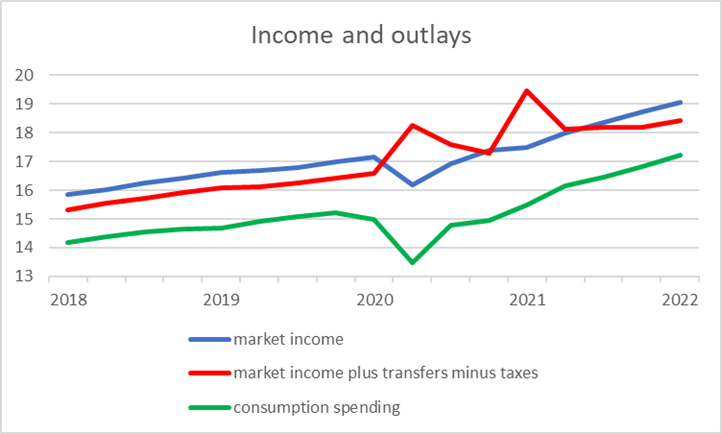
Blue: personal income (PINCOME) plus contributions for government social insurance (A061RC1Q027SBEA) minus government social benefits to persons (A063RC1Q027SBEA). Red: personal income minus personal taxes (W055RC1Q027SBEA). Green: personal outlays (A068RC1Q027SBEA). All data quarterly in billions of dollars at seasonally adjusted annual rates, from FRED. For details see BEA Table 2.1.
Others may worry about the Fed’s intended interest-rate hikes. We’ve only seen 25 basis points of these so far in the fed funds rate, but anticipation of more to come has already produced a 200-basis-point increase in 30-year mortgage rates since the start of the year. But if you borrow at the current 5% rate and see the price of your house go up 17%, as it did last year, it’s still hugely profitable to buy a home. Granted, it’s not clear how long those house price increases will extend into the future. But historically the series plotted below changes pretty slowly. To be sure, as the Fed continues its tightening cycle in an effort to control inflation, the cycle often ends in a recession. But we’re way too early in the cycle for that to be showing up now, and again, residential fixed investment was slightly stronger in Q1 than Q4.
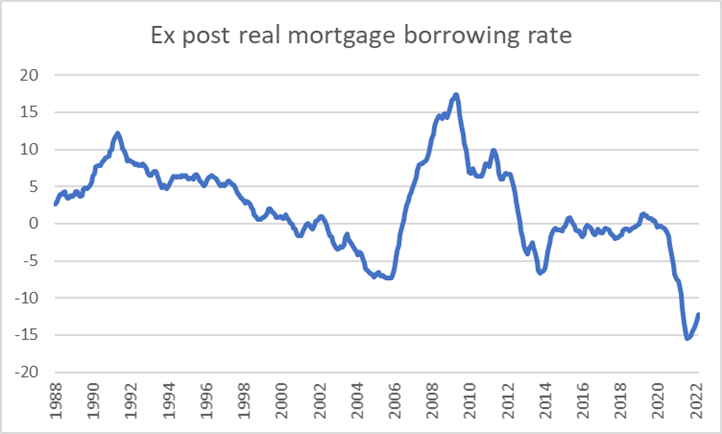
Nominal interest rate on 30-year fixed mortgage (end-of-month value of MORTGAGE30US) minus the year-over-year percent change in the Case-Shiller national house price index (CSUSHPINSA) for the 12-month period ended two months earlier, from FRED.
High oil prices are another headwind for the economy. These often send consumer sentiment falling, and the current episode is no exception. However, the current indications are that oil prices will end up lower and consumer sentiment higher in April than they were in March.
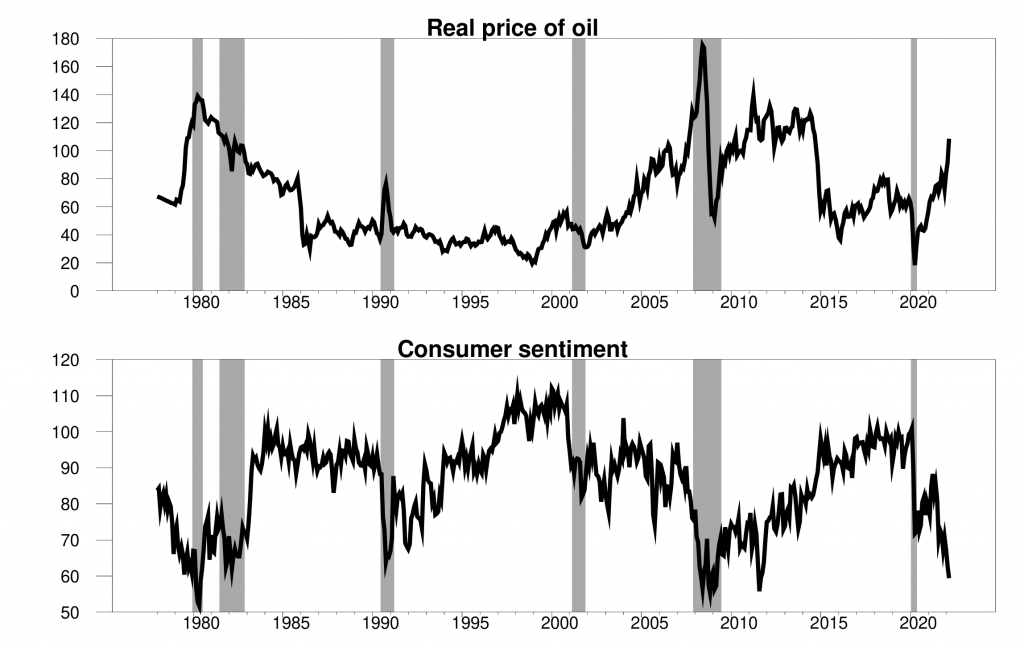
Top panel: real price of oil (WTI divided by CPI) in 2022 dollars. Bottom panel: University of Michigan survey of consumer sentiment. Monthly, 1978:M1 to 2022:M3.
A key place that sinking sentiment would historically show up is in purchases of consumer durables, particularly autos. The quarter-over-quarter growth in these was actually stronger than that of GDP. Inventories of autos have been so low due to supply-chain problems that it seems unlikely that this will be a big source of quarter-over-quarter declines. Lots of room for production gains from restocking even if consumer purchases are anemic.
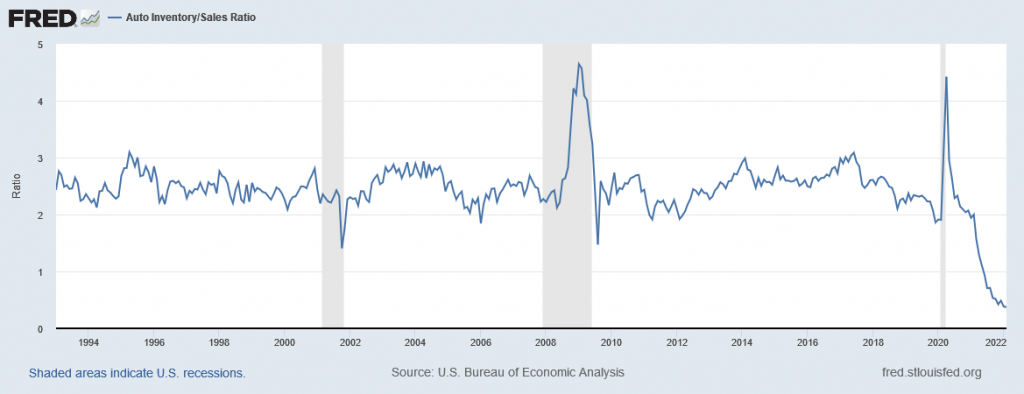
Source: FRED.
Nonresidential fixed investment is another component of spending where sentiment might show up. But this too has been holding its own.
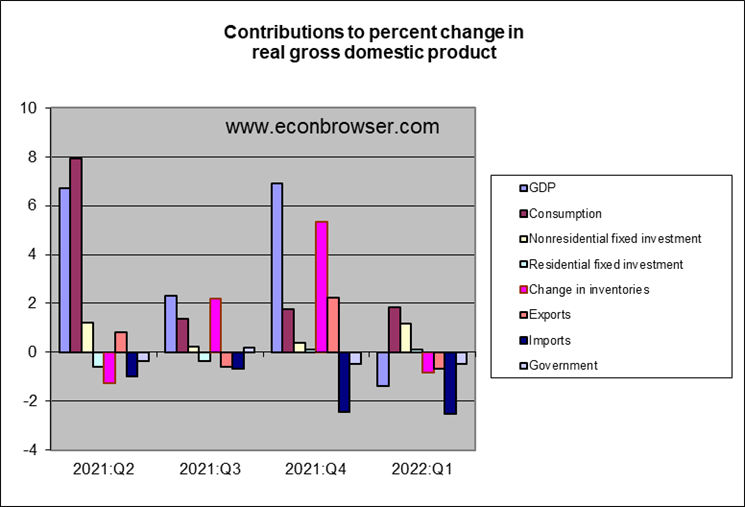
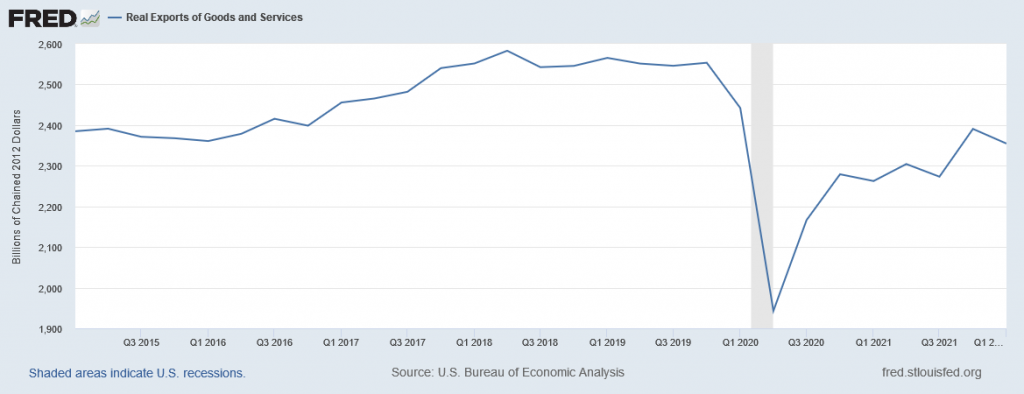
The one category that stands out most dramatically in the above graph is U.S. exports. Certainly, there is no shortage of deeply troubling events around the world that likely contributed to the export decline. But it’s worth noting that the Q1 over Q4 comparison (which is the way the numbers enter for the graph above) looks bad in part because Q4 exports were so strong. In terms of levels of exports rather than quarter-over-quarter changes, Q1 still looks reasonably solid.
Looking at BEA Table 4.2.2, I was surprised to find that almost half of the decline in U.S. exports for Q1 relative to Q4 is claimed to have come from a decrease in U.S. exports of petroleum and petroleum products. The Energy Information Administration reports two estimates of this number that are collected from different sources. A monthly series, constructed from data from refiners and transporters of oil, shows exports still strong. A weekly series, constructed separately by U.S. Customs and Border Protection, shows weakness.
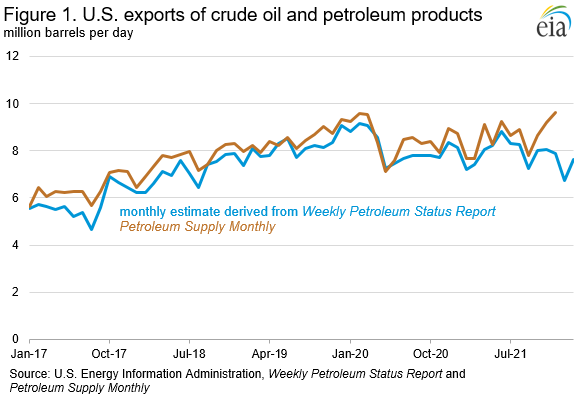
Here’s the EIA assessment of the discrepancy:
we likely underestimated export quantities for most products (including crude oil, finished motor gasoline, distillate fuel oil, propane/propylene, and other oils) in [our Weekly Petroleum Status Report] for November 2021 through the week ending February 18, 2022. We use information from the U.S. Customs and Border Protection (CBP) in our WPSR estimates and are consulting with them to determine the cause.
None of this is to deny that there are plenty of storm clouds to be concerned about, including another round of COVID-related shutdowns in Asia and the ongoing horrible tragedy in Europe. But it would be a mistake to conclude that these or other concerns have already led to the start of a recession in the United States.
Comments
Log in or sign up to join the conversation.