
How did the Fed get this so wrong?
Monetary stimulus can result in lower unemployment (which voters usually want) but higher inflation (which voters usually don’t want). One view of this tradeoff is that monetary policy should try to keep aggregate output near its long-run potential value. According to this view, as long as GDP is below potential, more stimulus may help lower unemployment with little cost in terms of inflation. But if GDP is above potential, more stimulus will do little for unemployment and mostly will result in higher inflation.
The diagram below, taken from a leading undergraduate macroeconomics textbook, summarizes some of the empirical evidence that is sometimes used to support this view. Each year between 1964 and 2018 is represented by a circle. The horizontal axis summarizes whether real GDP for that year was above or below the CBO estimate of potential GDP, and by how much. The vertical axis summarizes whether inflation for that year was higher or lower than the year before, and by how much. Years in which inflation did not change relative to the year before (zero on the vertical axis) tended to be years when output was equal to potential (zero on the horizontal axis). Years with big increases in inflation were often years when output was significantly above potential.
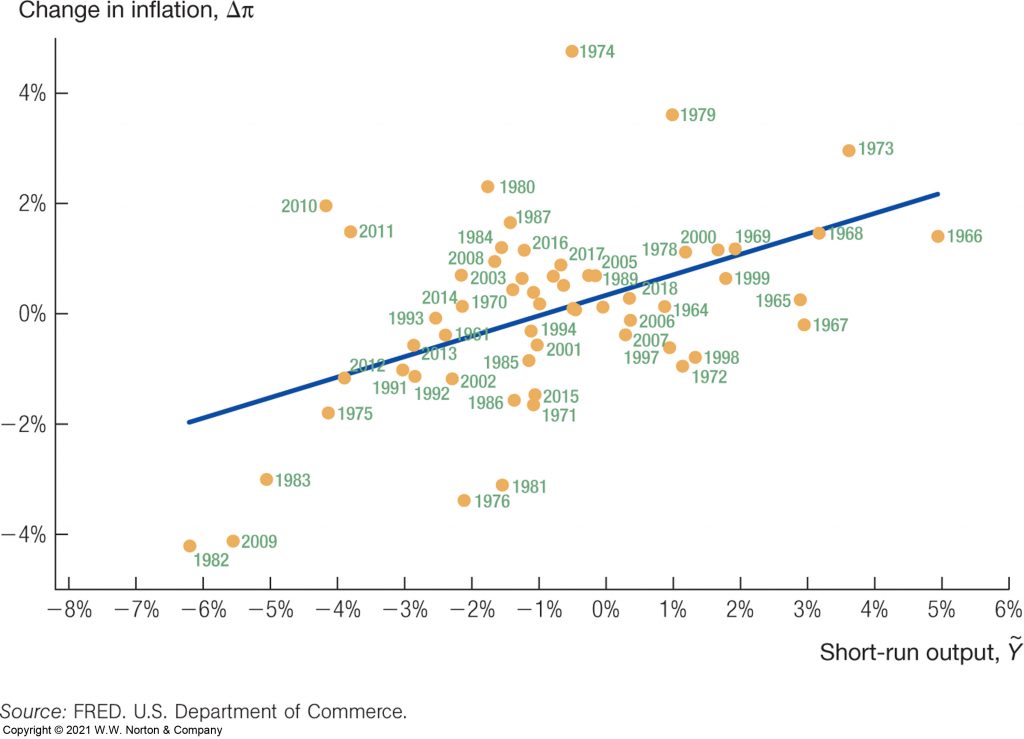
Source: Charles I. Jones, Macroeconomics, Fifth Edition, Figure 9.7, W.W. Norton & Co., Inc., 2021.
The figure below plots these data another way. The top panel plots the gap between actual and potential GDP for each quarter from 1960:Q1 to 2022:Q1. This gap remains negative up through the most recent data. A policy maker who was guided by the previous figure and the most recent CBO estimates of potential GDP would conclude that we could have continued with economic stimulus in 2021 and 2022 without worrying about a rise in inflation.
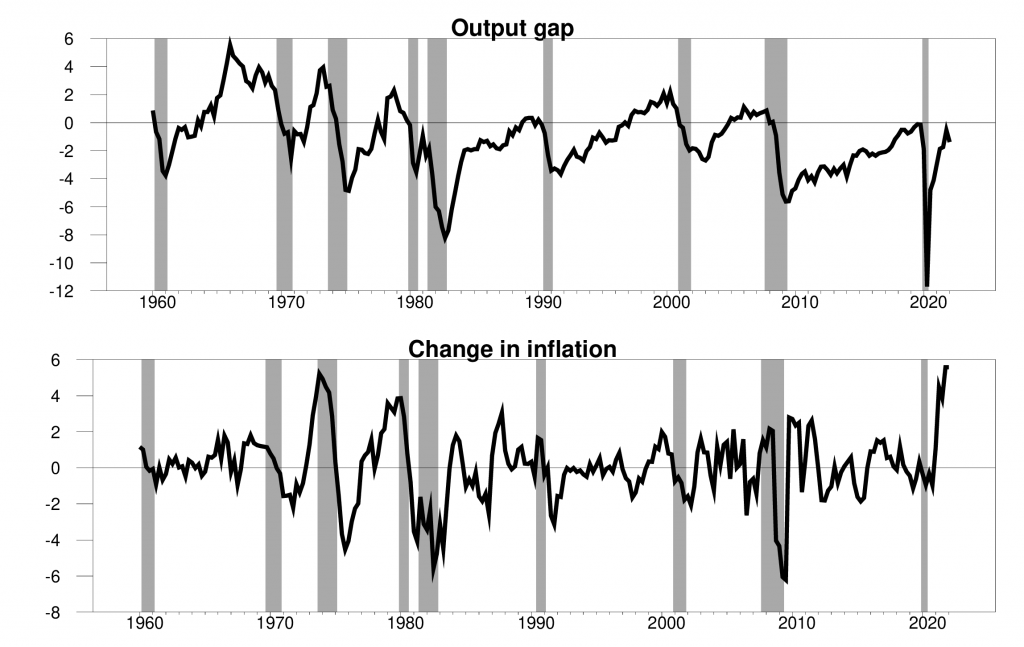
Top panel: 100 times the logarithmic difference between real GDP and potential GDP, 1960:Q1-2022:Q1. Bottom panel: Change between year-over-year inflation rate in quarter t (as measured by the CPI) and year-over-year inflation rate in quarter t-4.
Oops! The bottom panel shows this wasn’t the outcome, as everyone now knows only too well. Inflation has been on a tear upward. When Professor Jones updates his textbook, the first figure will show some pretty impressive outliers in 2021 and 2022.
But these may not be quite as impressive outliers as one might have guessed from the data plotted, if history is any judge. The reason I say this is that I’m guessing that the CBO in retrospect will decide that it probably overestimated potential GDP in 2021 and 2022, given what we now know happened to inflation. If CBO later decides that potential GDP in 2021 was lower than they are currently reporting that it was, it will make the output gap positive rather than negative in 2021, and make the data seem to predict at least some increase in inflation in 2021 and 2022. One of the reasons that the first figure seems to fit the data as well as it does (and honestly, the fit is not that great) is because the variable on the horizontal axis has been adjusted after the fact so as to better correspond to what turned out to happen to the variable on the vertical axis.
My view is that this traditional understanding of the limits to stimulus is not the right way to think about what happened over the last two years, and in fact never has been. I argue in a recent paper that the key feature that makes modern economies productive is specialization of labor, capital, and production networks. These are designed to be very efficient at accomplishing very particular tasks. In such a world, how much the economy can produce depends not just on the size and quality of our workforce and factories, but also on the match between the goods and services that producers set up in advance to be able to provide and the particular demands for those items by potential buyers. If demand for a particular good falls relative to the resources that were committed in advance to produce that item, the result will be a fall in the output of that good. Since we can’t change our specialties instantaneously, the result is idle resources and a drop in total GDP.
Our current problems have to be understood at the micro level of imbalances between productive capacity and specific demands rather than conventional summaries of the amount of water sloshing around in a big macroeconomic bathtub. We’re not producing more oil because the specialized drilling rigs aren’t in the fields. Cars aren’t being produced because chips are unavailable. Airline flights are being canceled because pilots who quit haven’t come back. A shortage of baby formula is not a problem that the Federal Reserve can solve.
I assume that most of us can agree that that such micro imbalances are a key component of the current situation. But I argue in the paper that the same issues are involved in most historic economic downturns, if people don’t want to buy the kinds of cars that Detroit is set up to produce, or construction workers are idle because no one wants to buy new homes. The latter is of course a problem the Fed can do something about. But I still think it’s better to view the construction market in terms of a mismatch between specialized factors of production and demands for the particular products (namely new houses) that they are set up to produce.
Where’s that leave us now? Well, for example, to get more baby formula on the shelves we could relax restrictions on imports and minimize regulatory shutdowns of producing plants. But monetary and fiscal stimulus is the wrong lever to push if the goal is to increase this particular component of GDP.
Comments
Log in or sign up to join the conversation.